
Activetrader0
@t_Activetrader0

What symbols does the trader recommend buying?
Purchase History
پیام های تریدر
Filter
Signal Type
Activetrader0
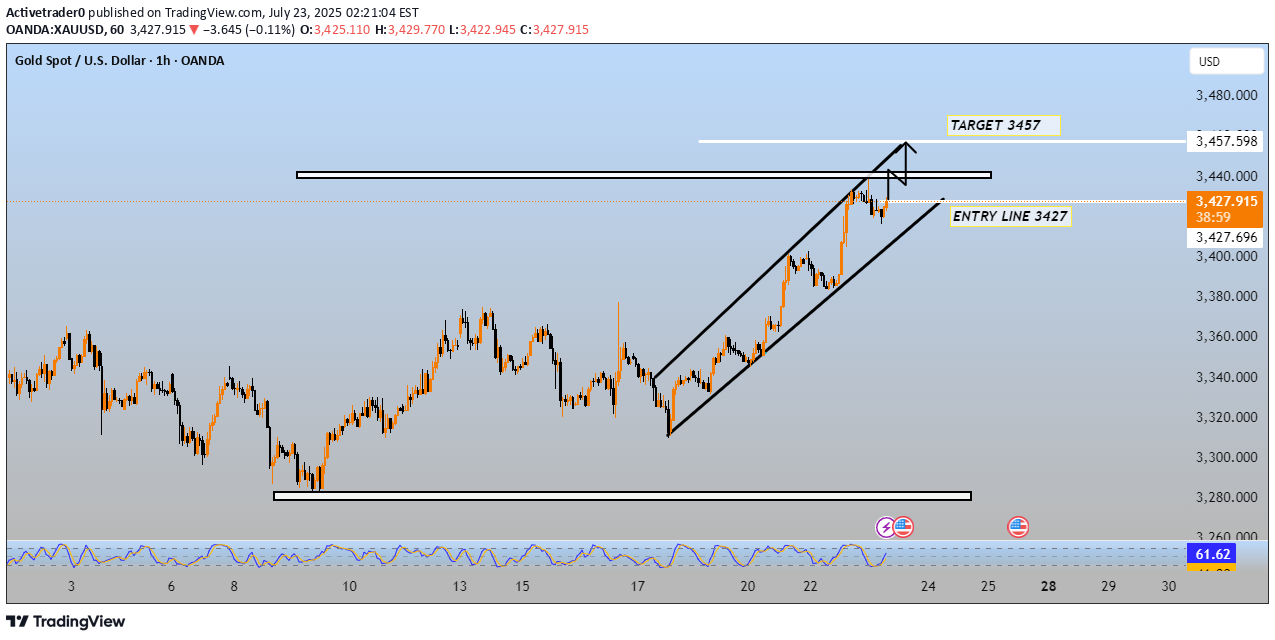
The chart you've shared is a 1-hour Gold Spot (XAU/USD) chart, highlighting a bullish ascending channel pattern with the following key levels: Key Chart Details: Current Price: $3,429.245 Entry Line: $3,427 Target: $3,457 Resistance Zone: Around $3,440 – $3,445 Support: Channel support (lower trendline), near $3,420 currently Observations: 1. Ascending Channel: Price is moving within an upward sloping channel. Price has recently bounced off the lower trendline and is heading toward the upper boundary. 2. Entry Strategy: A long (buy) position was marked at the entry line: $3,427. Suggests an expectation that price will break resistance and continue toward the target. 3. Target: Clearly defined target at $3,457, about 30 points above the entry level. The risk-reward ratio appears favorable if stop-loss is placed just below the lower channel line or last swing low. 4. Indicators: Stochastic RSI is currently near the overbought zone (~66), indicating bullish momentum but also a possible pullback if overextended. Conclusion: This chart represents a bullish breakout setup within an ascending channel. Traders might: Enter long positions above $3,427, Set stop-loss near the lower channel support (~$3,415–$3,420), Target a profit around $3,457. Would you like a detailed trading plan based on this setup?
Activetrader0
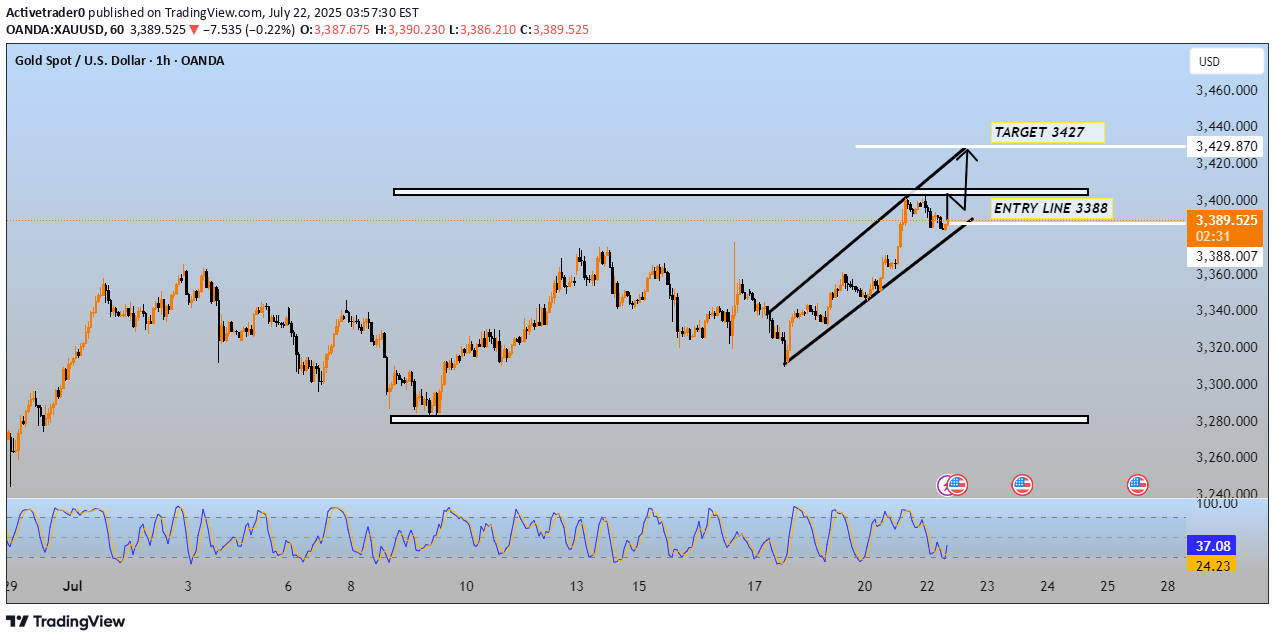
This chart shows a technical analysis of Gold Spot vs. U.S. Dollar (XAU/USD) on the 1-hour timeframe, as of July 22, 2025. Here's a breakdown: --- 🔍 Key Observations: Current Price: $3,389.49 Entry Line: $3,388 (highlighted) Target Price: $3,427 Chart Pattern: Ascending channel (bullish trend) Recent Price Action: Price is trending upward within a well-defined channel. Currently testing the top of a resistance zone (~$3,400). Stochastic RSI (bottom indicator): Shows a bearish crossover and is heading down from the overbought zone, which could signal short-term weakness. --- 🧠 Interpretation: Bullish Bias: The price is in an upward channel with momentum favoring buyers. The entry point at $3,388 suggests a breakout strategy is in play. The target at $3,427 represents the next key resistance level. Risk to Watch: The stochastic oscillator suggests a potential short-term pullback. Failure to stay above the entry level may invalidate the breakout scenario. --- ✅ Strategy Summary: ActionLevelNote Buy Entry$3,388Entry point for breakout confirmation Target$3,427Near upper resistance and top of the channel Stop-lossBelow channel support (~$3,360)Manage risk in case of breakdown --- Would you like a breakdown of support/resistance levels or suggested risk/reward ratios based on this setup?400 PIPS RUNNINGTARGET DONE ENJOY
Activetrader0
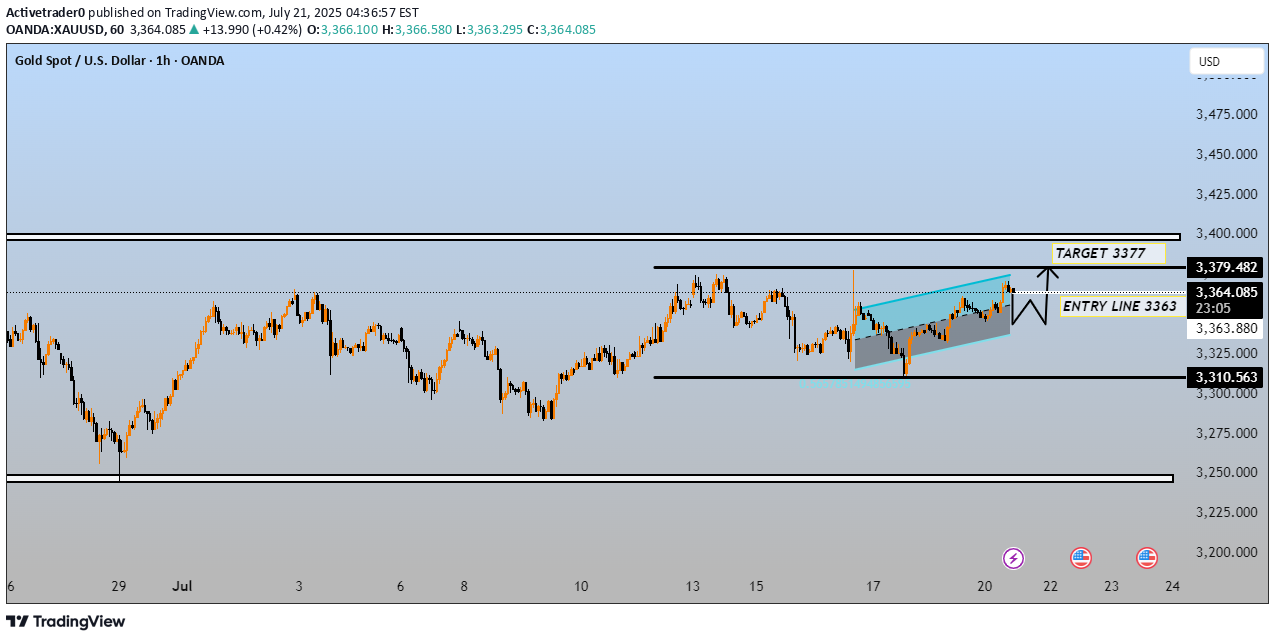
This chart represents Gold Spot (XAU/USD) on the 1-hour timeframe with the following key analysis elements: --- 🔍 Chart Highlights: Current Price: 3,364.175 USD Entry Line: 3,363 (marked clearly on the chart) Target Price: 3,377 Resistance Zone: ~3,377–3,379 Support Zone: ~3,310 Pattern: Ascending channel (highlighted in cyan) --- 📊 Technical Interpretation: The chart shows price breaking above a bullish ascending channel, suggesting bullish momentum. A long (buy) entry is proposed at the entry line (3,363), with a target set near the resistance level at 3,377. The price has moved above the entry point, implying the trade may already be active or triggered. The target zone (3,377–3,379) is a likely profit-taking area, as price previously reversed from this level. Stop-loss is not marked but would logically be placed below the channel or the support zone (around 3,310.563). --- ✅ Bullish Scenario: If price holds above 3,363 and continues the breakout from the channel, a test of 3,377–3,379 is expected. ❌ Bearish Scenario: If price falls back below 3,363 and re-enters the channel, a retest of 3,325–3,310 support is possible. --- Let me know if you’d like help setting stop-loss/take-profit ratios, or want this analysis converted to a trading plan.TARGET DONE
Activetrader0
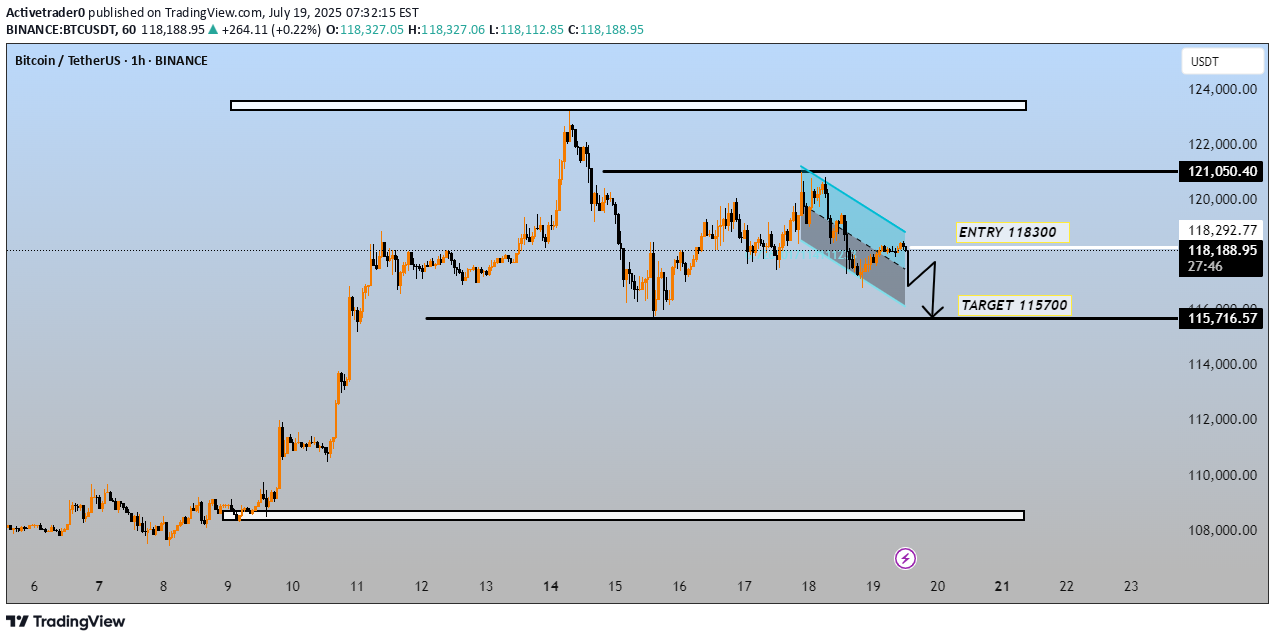
This chart shows a technical analysis of Bitcoin (BTC) / TetherUS (USDT) on a 1-hour timeframe from Binance, published on July 19, 2025. Key Details: Price at the time of chart: ~118,316 USDT Bearish setup with a descending channel pattern highlighted in cyan. Entry Level: 118,300 USDT (Short position) Target: 115,700 USDT Resistance zone: ~121,050 USDT Support zone: ~115,716 USDT Analysis Summary: The chart suggests a potential short trade with a bearish breakout from the descending channel. If price breaks below the channel support, the suggested move is short from 118,300 to 115,700, indicating a ~2.2% downside. The target (115,700) aligns with a previous support zone from earlier in the chart, adding confluence. The 121,050 level represents strong resistance from a previous high. Interpretation: This is a classic bear flag pattern forming after a significant down move from the recent peak. The trader expects a continuation to the downside once the pattern resolves. Let me know if you want: A trading plan based on this idea Risk/reward analysis Confirmation indicators to support this setup
Activetrader0
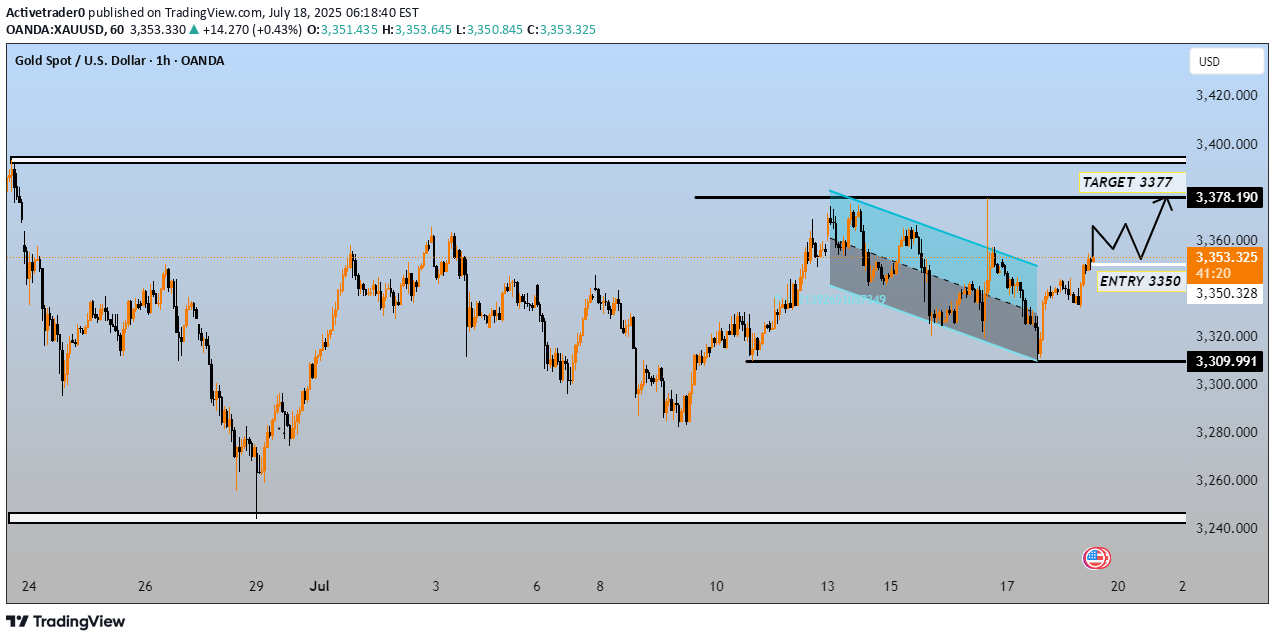
This chart is a technical analysis of Gold Spot (XAU/USD) on the 1-hour timeframe, showing a bullish setup with defined entry and target levels: Key Elements: 1. Entry Level: 3350 is marked as the optimal entry point for a long (buy) position. 2. Target Level: 3377 is the profit target, just below a resistance zone around 3,378.190. 3. Price Action: The price broke out of a falling wedge or descending channel, which is a bullish reversal pattern. This breakout is highlighted by the move above the descending blue channel. A retest of the breakout zone is suggested before the price moves higher. 4. Support & Resistance Zones: Support: 3,309.991 (strong horizontal support). Resistance: 3,378.190 (significant horizontal resistance). 5. Current Price: At the time of the screenshot, the price is 3,353.080, slightly above the entry level of 3350. Technical Implication: The chart suggests a buy-the-dip strategy, targeting 3377 after confirmation of support at 3350. A bullish bias is in play, provided the price stays above the 3350 entry zone and the 3309.991 support level holds. Would you like help calculating position size, stop loss, or risk/reward ratio for this trade?270 PIPS DONETARGET DONE
Activetrader0
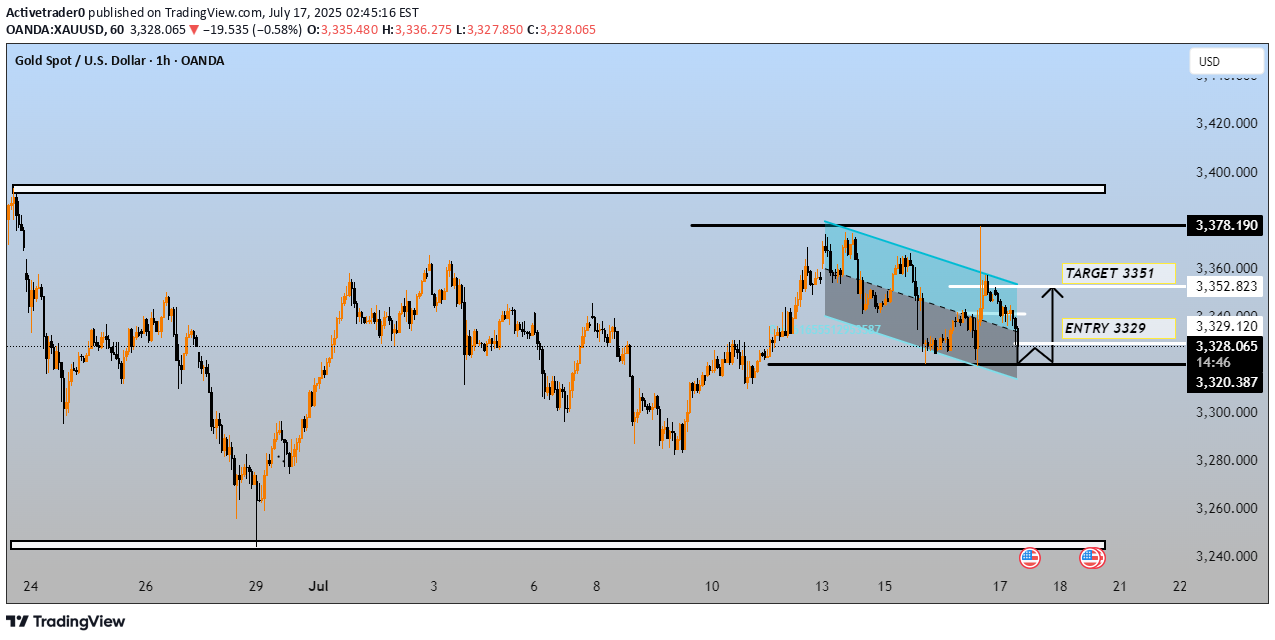
This is a technical analysis chart for Gold Spot vs. U.S. Dollar (XAU/USD) on the 1-hour timeframe. Here's a breakdown of what it's showing: --- 🔍 Key Observations: 1. Falling Wedge Pattern (Bullish Reversal) The chart highlights a falling wedge pattern (light blue area). This pattern often indicates a potential bullish breakout, especially if it occurs after an uptrend. 2. Entry and Target Levels: Entry Point: 3329 (marked near the current price) Target: 3351 The price has already approached the entry zone (~3329) and may now be looking to bounce upward. 3. Support and Resistance: Support Levels: Immediate: 3,329.120 Stronger: 3,320.387 Resistance Levels: Immediate: 3,351 (target zone) Major: 3,378.190 (top of the range) 4. Risk/Reward Setup: The setup offers a long (buy) trade from the 3329 zone. Target at 3351 provides about 22 points upside. Stop-loss likely placed just below support (~3320–3325), offering a decent risk-reward ratio. --- ✅ Bullish Confirmation: If price breaks out of the wedge and holds above 3330–3335, it increases the likelihood of hitting the 3351 target. ⚠ Bearish Risk: If price breaks below 3320, the pattern may fail, and a deeper retracement toward the 3240 zone could follow. --- Let me know if you’d like: Stop-loss suggestions Risk/reward ratio calculations A similar analysis for a different asset or timeframeTARGET DONE ENJOY
Activetrader0
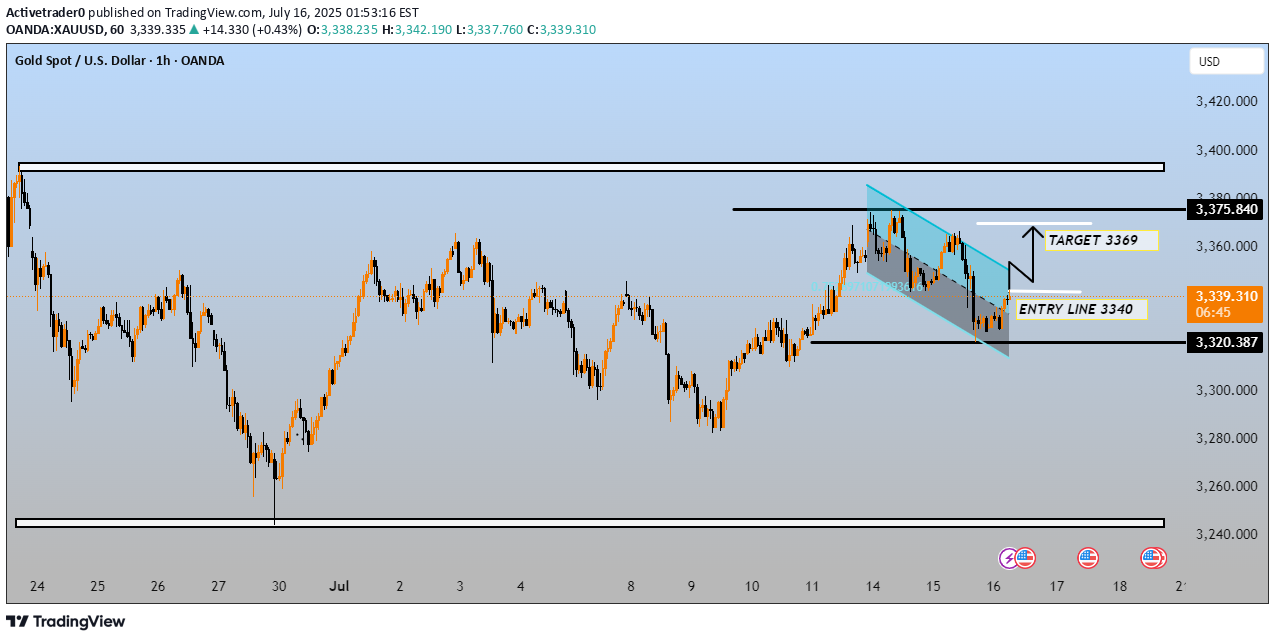
This chart shows the price action of Gold (XAU/USD) on a 1-hour timeframe with a bullish breakout setup. Here's a breakdown of the key technical elements: --- 🟦 Chart Overview: Instrument: Gold Spot (XAU/USD) Timeframe: 1 Hour (1h) Current Price: $3,339.655 --- 📉 Technical Patterns: 1. Falling Wedge / Bullish Flag: A descending channel (blue) indicates a consolidation or retracement after a prior uptrend. Price has just broken out of this wedge to the upside, which is typically a bullish signal. 2. Horizontal Support/Resistance: Support Zone: Around $3,320.387 Resistance Zone: Around $3,375.840 --- 📈 Trade Setup: Entry Line: $3,340 Price has already moved slightly above this level. Target: $3,369 A short-term target within the larger resistance zone at $3,375.840. Stop-Loss (Implied): Below $3,320.387 (the lower support line), although not explicitly marked. --- ✅ Bullish Signals: Breakout from a downward channel. Strong bounce near support ($3,320). Target level ($3,369) is realistic and below the next major resistance. --- ⚠ Risks: If the price falls back below $3,340 and re-enters the wedge, the breakout could be invalid. Strong resistance near $3,375 might limit further gains. --- Conclusion: This is a classic bullish continuation setup after consolidation. If momentum holds, the $3,369 target is reasonable in the near term. Would you like help calculating position size or risk-reward ratio for this trade?
Activetrader0
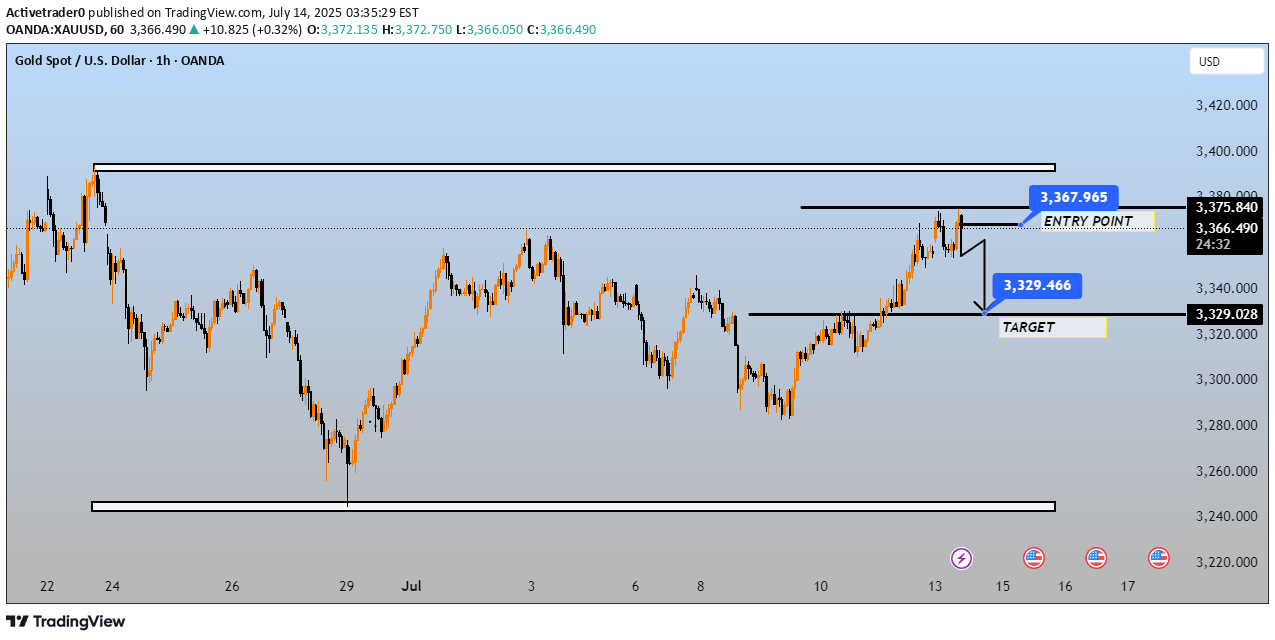
This chart is a technical analysis setup for Gold (XAU/USD) on the 1-hour timeframe. Here's a breakdown of what it's showing: --- Key Elements: Instrument: Gold Spot / U.S. Dollar (XAU/USD) Timeframe: 1-hour Date/Time: July 14, 2025 Current Price: ~3,367.205 USD --- Trade Setup (Sell Position): Entry Point: 3,367.965 Target: 3,329.466 Target Zone (Support): ~3,329.028 This suggests the trader expects a short-term price rejection at resistance, with the price falling from the entry zone down to the target zone. --- Technical Interpretation: Resistance Zone: Between ~3,367.965 and 3,375.840 — the price is currently testing this area, which previously acted as resistance. Support Zone: Around 3,329.028 — the expected target area, possibly a previous consolidation or reaction zone. Bearish Reversal Anticipation: The structure implies the trader anticipates price will fail to break above resistance and instead reverse downward. --- Potential Risk Factors: Price is still within a bullish trend from July 8–14. A clean breakout above 3,375.840 would invalidate this bearish setup. --- Let me know if you want a stop loss level suggested or a risk/reward ratio calculated.TARGET DONE
Activetrader0
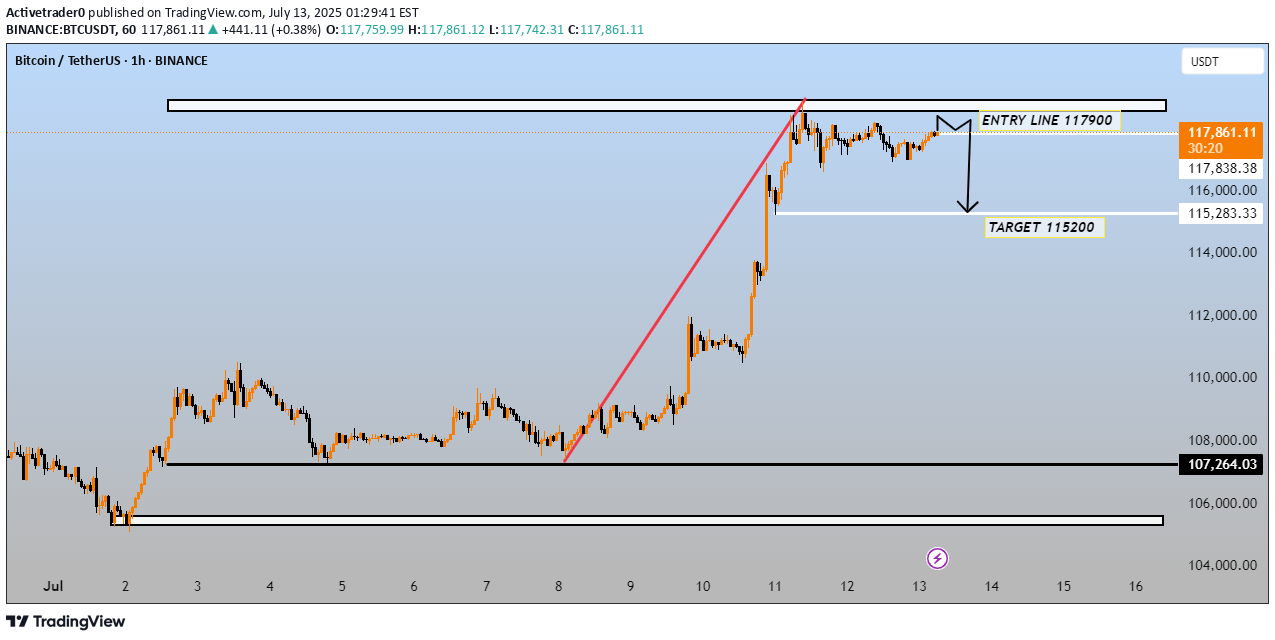
This chart is a technical analysis of the Bitcoin (BTC) / Tether (USDT) pair on the 1-hour timeframe from Binance, showing a potential short (sell) setup. Key Points from the Chart: Current Price: ~$117,861 Entry Line (Short Position): 117,900 Target Price: 115,200 Potential Downward Move: ~2,700 points Support Zone Below Target: Around 107,264 Interpretation: The chart shows a parabolic rally, followed by price consolidation near the top. The analyst is anticipating a reversal from the 117,900 resistance zone, expecting a short-term pullback to the 115,200 support area. The idea seems to be based on a potential double top / distribution pattern or liquidity grab above recent highs. Trade Setup (Bearish Bias): Sell Entry: Near 117,900 Target: 115,200 Stop Loss (not shown): Likely just above the recent high (~118,000+) Considerations: Confirming a reversal (e.g., bearish candlestick pattern or divergence) at 117,900 strengthens the short case. If price breaks and holds above 118,000, the bearish thesis would likely be invalidated. This is a short-term trading idea, not a long-term prediction. Would you like help building a trade plan around this or analyzing a different timeframe?
Activetrader0
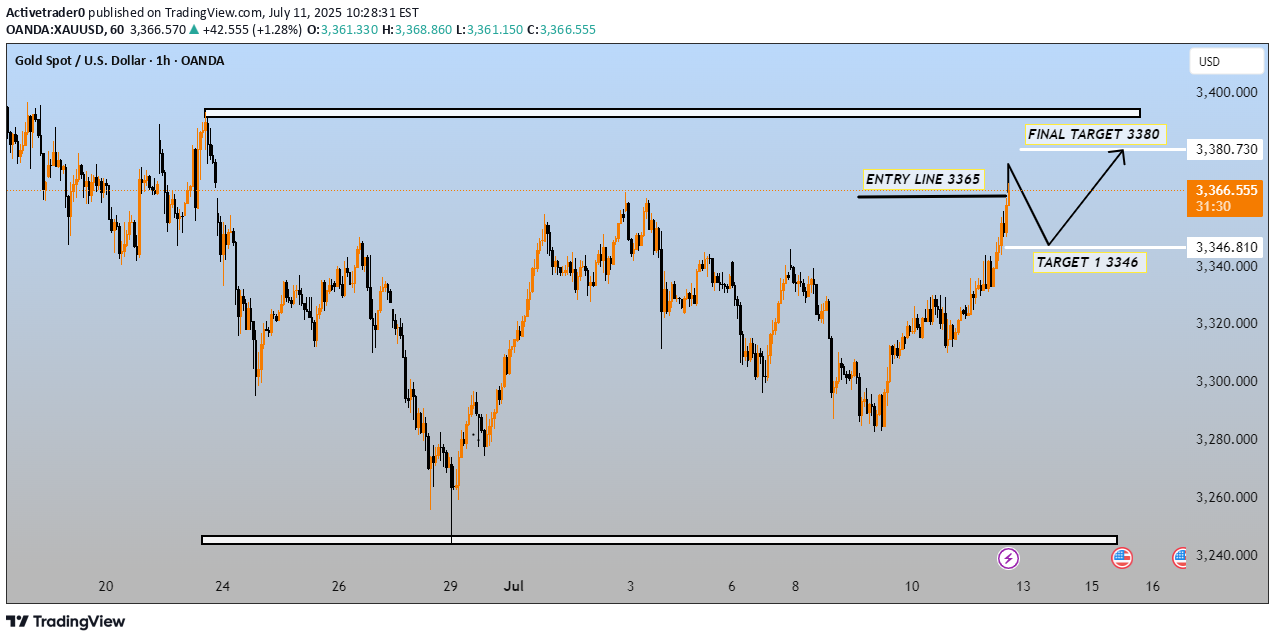
This chart is for Gold Spot against the U.S. Dollar (XAU/USD) on the 1-hour timeframe, and it outlines a potential bullish trading setup. Here's a breakdown of what it shows: --- 📈 Trading Plan Summary: Entry Line: 3365 USD Price is currently above this level at 3365.315 USD, so the entry has already been triggered. Target 1 (First Pullback Target): 3346 USD This is a potential pullback level after the initial move up. The chart anticipates price dipping back to this zone before continuing higher. Final Target: 3380 USD This is the bullish target, assuming the pullback completes and the uptrend resumes. --- 🔄 Expected Price Movement Path: 1. Price has moved up past the 3365 entry point. 2. A retracement/pullback is expected towards 3346 (first support). 3. From there, price is expected to bounce and continue upward to the final target at 3380. --- 🧠 Interpretation: The chart suggests a long (buy) bias with a breakout above 3365. The 3346 level is seen as a support zone where price might retest before continuing up. 3380 marks a potential resistance or take-profit area. --- If you're trading this setup, consider: Monitoring price behavior near 3346 for confirmation (e.g., bullish candles). Using stop-losses below the support zone (around 3340 or lower). Watching for momentum continuation above 3365 to hold toward 3380. Let me know if you want help calculating risk/reward, lot sizing, or confirming technical indicators.
Disclaimer
Any content and materials included in Sahmeto's website and official communication channels are a compilation of personal opinions and analyses and are not binding. They do not constitute any recommendation for buying, selling, entering or exiting the stock market and cryptocurrency market. Also, all news and analyses included in the website and channels are merely republished information from official and unofficial domestic and foreign sources, and it is obvious that users of the said content are responsible for following up and ensuring the authenticity and accuracy of the materials. Therefore, while disclaiming responsibility, it is declared that the responsibility for any decision-making, action, and potential profit and loss in the capital market and cryptocurrency market lies with the trader.