Technical analysis by Activetrader0 about Symbol PAXG: Buy recommendation (7/22/2025)

Activetrader0
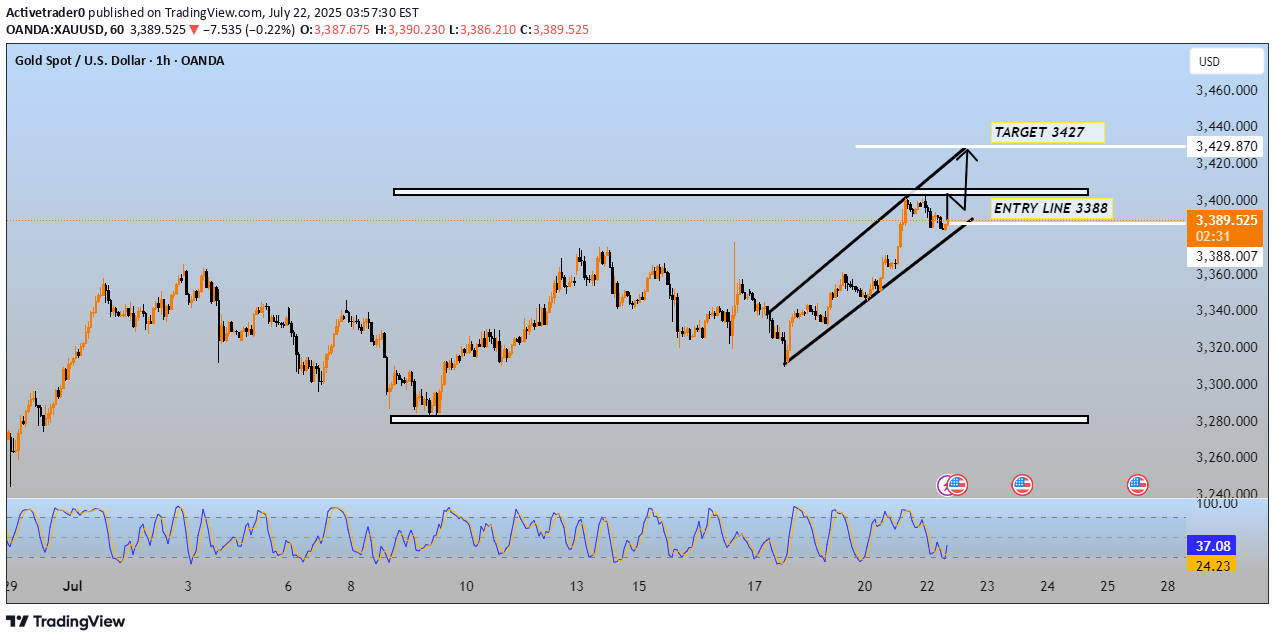
This chart shows a technical analysis of Gold Spot vs. U.S. Dollar (XAU/USD) on the 1-hour timeframe, as of July 22, 2025. Here's a breakdown: --- 🔍 Key Observations: Current Price: $3,389.49 Entry Line: $3,388 (highlighted) Target Price: $3,427 Chart Pattern: Ascending channel (bullish trend) Recent Price Action: Price is trending upward within a well-defined channel. Currently testing the top of a resistance zone (~$3,400). Stochastic RSI (bottom indicator): Shows a bearish crossover and is heading down from the overbought zone, which could signal short-term weakness. --- 🧠 Interpretation: Bullish Bias: The price is in an upward channel with momentum favoring buyers. The entry point at $3,388 suggests a breakout strategy is in play. The target at $3,427 represents the next key resistance level. Risk to Watch: The stochastic oscillator suggests a potential short-term pullback. Failure to stay above the entry level may invalidate the breakout scenario. --- ✅ Strategy Summary: ActionLevelNote Buy Entry$3,388Entry point for breakout confirmation Target$3,427Near upper resistance and top of the channel Stop-lossBelow channel support (~$3,360)Manage risk in case of breakdown --- Would you like a breakdown of support/resistance levels or suggested risk/reward ratios based on this setup?400 PIPS RUNNINGTARGET DONE ENJOY
