تحلیل کدال در چند ثانیه!
فقط کافیه سوالتو بپرسی! دستیار هوشمند سهمتو جواب رو از دل گزارشهای کدال،
فوری و به زبانی ساده برات آماده میکنه.
سوالتو بپرسهوش مصنوعی سهمتو
با اطلاعات بنیادی چت کن!
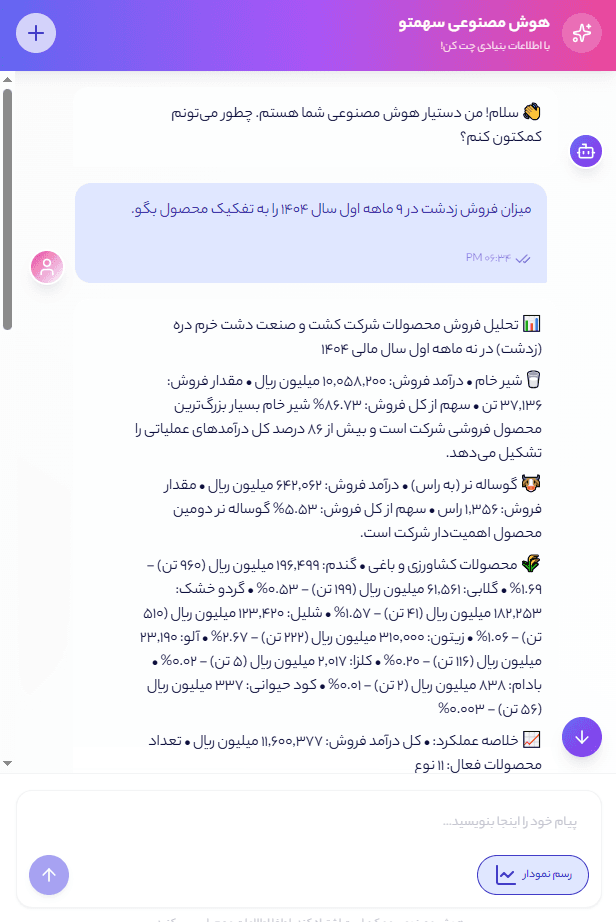
👋 سلام! من دستیار هوش مصنوعی شما هستم. چطور میتونم کمکتون کنم؟
سه قدم تا تحلیل کدال
سوال خود را بپرسید
سوال خود را در مورد گزارشهای کدال یا وضعیت شرکتها از دستیار هوشمند سهمتو بپرسید.
تحلیل با هوش مصنوعی
هوش مصنوعی سهمتو به سرعت گزارشها را بررسی و اطلاعات مورد نیاز شما را استخراج میکند.
دریافت پاسخ فوری
پاسخ دقیق و قابل فهم را در چند ثانیه، به زبان خودتان دریافت کنید.
چطور به شما کمک میکنیم؟
خلاصهسازی هوشمند
درک سریع نکات اصلی گزارشات مالی موجود در کدال بدون خواندن متن کامل
استخراج اطلاعات دقیق
یافتن سریع دادههای خاص مورد نیاز شما (مانند سود خالص، درآمد، نسبتهای مالی و…)
مقایسه شرکتها
مقایسه آسان شاخصها و عملکردهای شرکتهای مختلف بر اساس گزارشهای کدال
پاسخگویی سریع
دریافت نتایج تحلیل در چند ثانیه، حتی برای گزارشهای حجیم
رابط کاربری ساده
تعامل آسان و بدون نیاز به دانش تخصصی تحلیل