Technical analysis by Activetrader0 about Symbol PAXG: Buy recommendation (7/14/2025)

Activetrader0
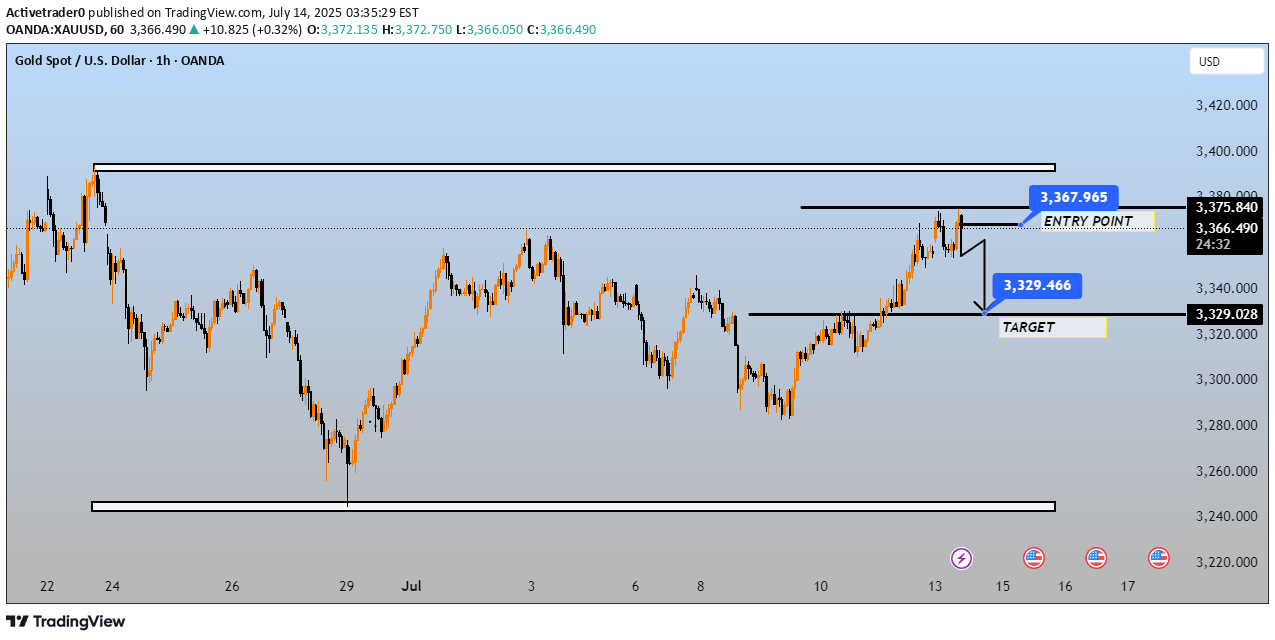
This chart is a technical analysis setup for Gold (XAU/USD) on the 1-hour timeframe. Here's a breakdown of what it's showing: --- Key Elements: Instrument: Gold Spot / U.S. Dollar (XAU/USD) Timeframe: 1-hour Date/Time: July 14, 2025 Current Price: ~3,367.205 USD --- Trade Setup (Sell Position): Entry Point: 3,367.965 Target: 3,329.466 Target Zone (Support): ~3,329.028 This suggests the trader expects a short-term price rejection at resistance, with the price falling from the entry zone down to the target zone. --- Technical Interpretation: Resistance Zone: Between ~3,367.965 and 3,375.840 — the price is currently testing this area, which previously acted as resistance. Support Zone: Around 3,329.028 — the expected target area, possibly a previous consolidation or reaction zone. Bearish Reversal Anticipation: The structure implies the trader anticipates price will fail to break above resistance and instead reverse downward. --- Potential Risk Factors: Price is still within a bullish trend from July 8–14. A clean breakout above 3,375.840 would invalidate this bearish setup. --- Let me know if you want a stop loss level suggested or a risk/reward ratio calculated.TARGET DONE
