Technical analysis by Activetrader0 about Symbol PAXG: Buy recommendation (7/16/2025)

Activetrader0

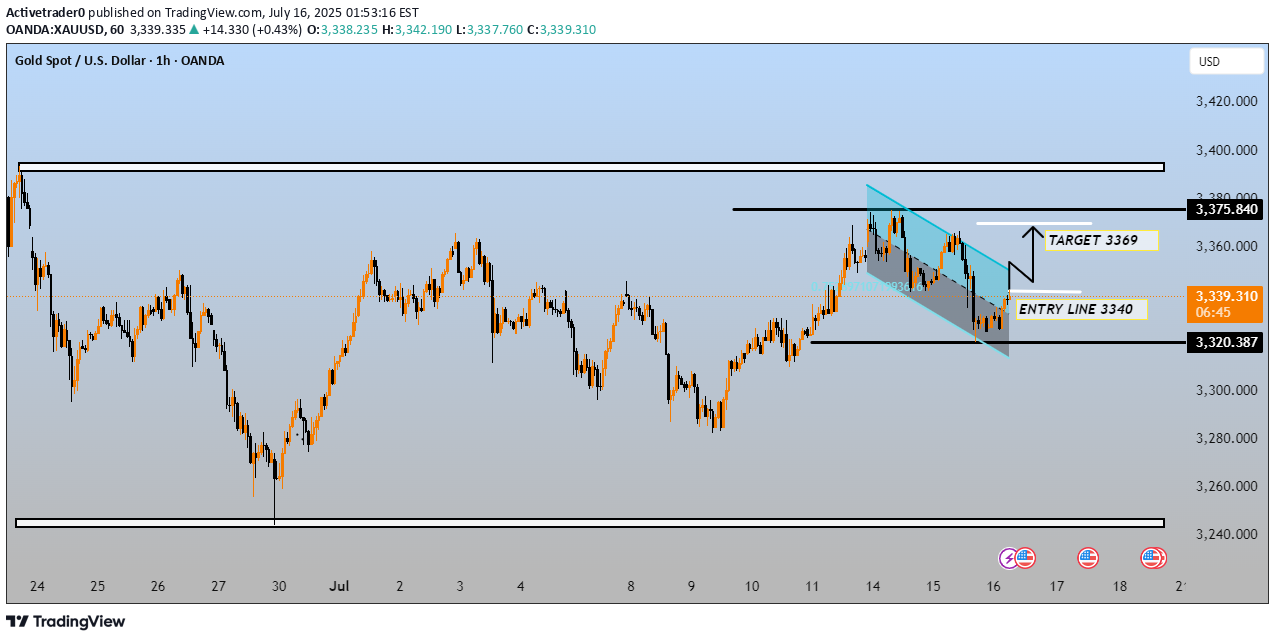
This chart shows the price action of Gold (XAU/USD) on a 1-hour timeframe with a bullish breakout setup. Here's a breakdown of the key technical elements: --- 🟦 Chart Overview: Instrument: Gold Spot (XAU/USD) Timeframe: 1 Hour (1h) Current Price: $3,339.655 --- 📉 Technical Patterns: 1. Falling Wedge / Bullish Flag: A descending channel (blue) indicates a consolidation or retracement after a prior uptrend. Price has just broken out of this wedge to the upside, which is typically a bullish signal. 2. Horizontal Support/Resistance: Support Zone: Around $3,320.387 Resistance Zone: Around $3,375.840 --- 📈 Trade Setup: Entry Line: $3,340 Price has already moved slightly above this level. Target: $3,369 A short-term target within the larger resistance zone at $3,375.840. Stop-Loss (Implied): Below $3,320.387 (the lower support line), although not explicitly marked. --- ✅ Bullish Signals: Breakout from a downward channel. Strong bounce near support ($3,320). Target level ($3,369) is realistic and below the next major resistance. --- ⚠ Risks: If the price falls back below $3,340 and re-enters the wedge, the breakout could be invalid. Strong resistance near $3,375 might limit further gains. --- Conclusion: This is a classic bullish continuation setup after consolidation. If momentum holds, the $3,369 target is reasonable in the near term. Would you like help calculating position size or risk-reward ratio for this trade?