Technical analysis by Activetrader0 about Symbol BTC: Sell recommendation (7/19/2025)

Activetrader0
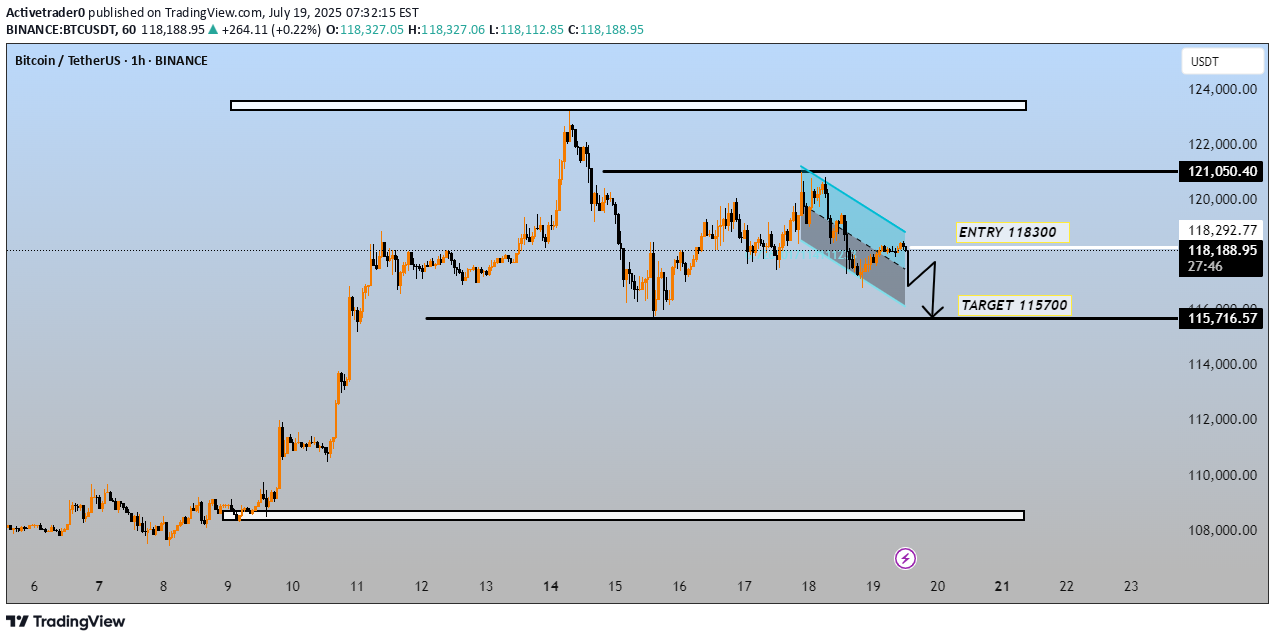
This chart shows a technical analysis of Bitcoin (BTC) / TetherUS (USDT) on a 1-hour timeframe from Binance, published on July 19, 2025. Key Details: Price at the time of chart: ~118,316 USDT Bearish setup with a descending channel pattern highlighted in cyan. Entry Level: 118,300 USDT (Short position) Target: 115,700 USDT Resistance zone: ~121,050 USDT Support zone: ~115,716 USDT Analysis Summary: The chart suggests a potential short trade with a bearish breakout from the descending channel. If price breaks below the channel support, the suggested move is short from 118,300 to 115,700, indicating a ~2.2% downside. The target (115,700) aligns with a previous support zone from earlier in the chart, adding confluence. The 121,050 level represents strong resistance from a previous high. Interpretation: This is a classic bear flag pattern forming after a significant down move from the recent peak. The trader expects a continuation to the downside once the pattern resolves. Let me know if you want: A trading plan based on this idea Risk/reward analysis Confirmation indicators to support this setup
