Technical analysis by Activetrader0 about Symbol PAXG on 7/17/2025

Activetrader0
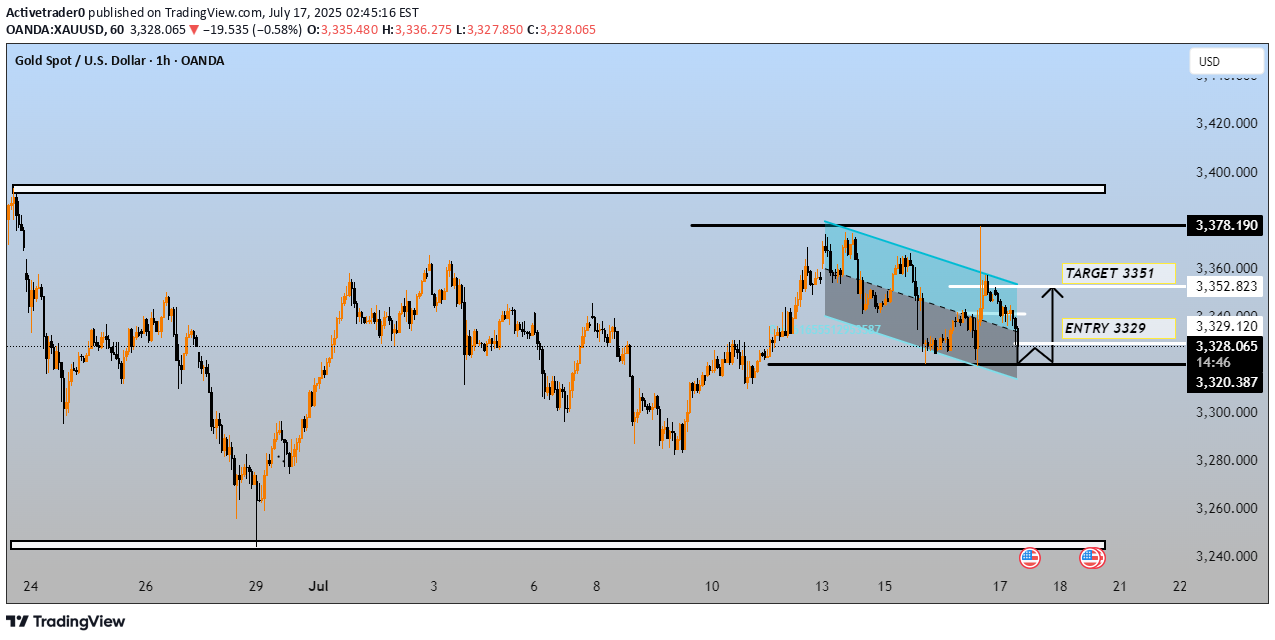
This is a technical analysis chart for Gold Spot vs. U.S. Dollar (XAU/USD) on the 1-hour timeframe. Here's a breakdown of what it's showing: --- 🔍 Key Observations: 1. Falling Wedge Pattern (Bullish Reversal) The chart highlights a falling wedge pattern (light blue area). This pattern often indicates a potential bullish breakout, especially if it occurs after an uptrend. 2. Entry and Target Levels: Entry Point: 3329 (marked near the current price) Target: 3351 The price has already approached the entry zone (~3329) and may now be looking to bounce upward. 3. Support and Resistance: Support Levels: Immediate: 3,329.120 Stronger: 3,320.387 Resistance Levels: Immediate: 3,351 (target zone) Major: 3,378.190 (top of the range) 4. Risk/Reward Setup: The setup offers a long (buy) trade from the 3329 zone. Target at 3351 provides about 22 points upside. Stop-loss likely placed just below support (~3320–3325), offering a decent risk-reward ratio. --- ✅ Bullish Confirmation: If price breaks out of the wedge and holds above 3330–3335, it increases the likelihood of hitting the 3351 target. ⚠ Bearish Risk: If price breaks below 3320, the pattern may fail, and a deeper retracement toward the 3240 zone could follow. --- Let me know if you’d like: Stop-loss suggestions Risk/reward ratio calculations A similar analysis for a different asset or timeframeTARGET DONE ENJOY
