Technical analysis by Activetrader0 about Symbol PAXG on 7/21/2025

Activetrader0
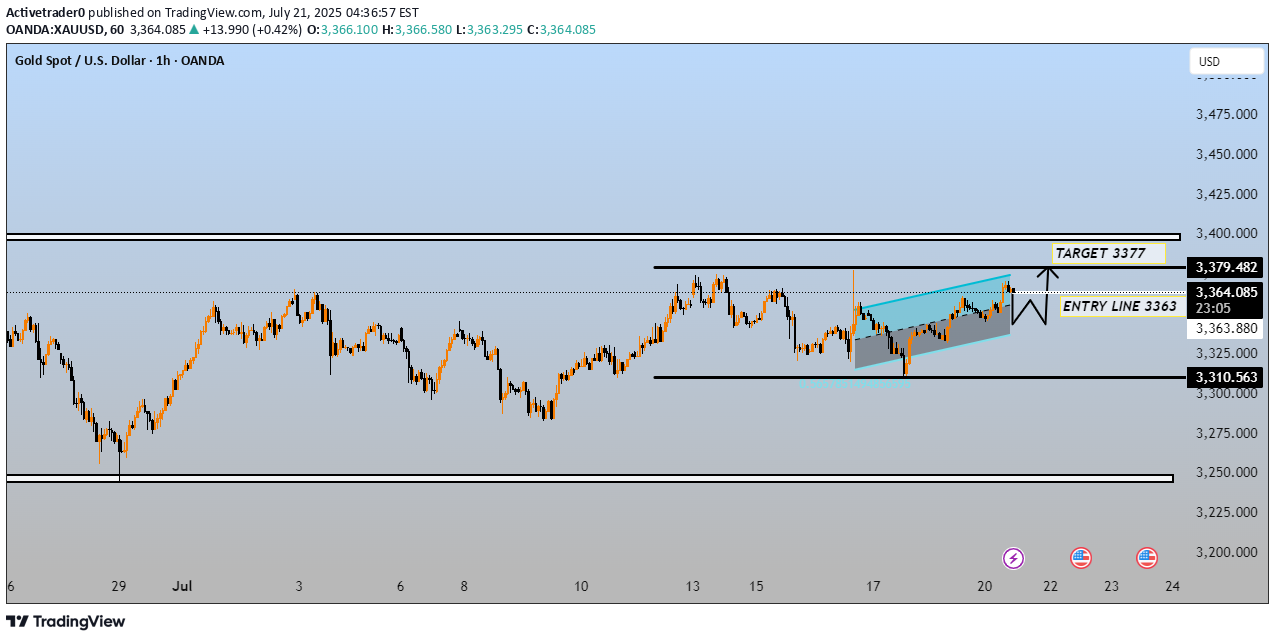
This chart represents Gold Spot (XAU/USD) on the 1-hour timeframe with the following key analysis elements: --- 🔍 Chart Highlights: Current Price: 3,364.175 USD Entry Line: 3,363 (marked clearly on the chart) Target Price: 3,377 Resistance Zone: ~3,377–3,379 Support Zone: ~3,310 Pattern: Ascending channel (highlighted in cyan) --- 📊 Technical Interpretation: The chart shows price breaking above a bullish ascending channel, suggesting bullish momentum. A long (buy) entry is proposed at the entry line (3,363), with a target set near the resistance level at 3,377. The price has moved above the entry point, implying the trade may already be active or triggered. The target zone (3,377–3,379) is a likely profit-taking area, as price previously reversed from this level. Stop-loss is not marked but would logically be placed below the channel or the support zone (around 3,310.563). --- ✅ Bullish Scenario: If price holds above 3,363 and continues the breakout from the channel, a test of 3,377–3,379 is expected. ❌ Bearish Scenario: If price falls back below 3,363 and re-enters the channel, a retest of 3,325–3,310 support is possible. --- Let me know if you’d like help setting stop-loss/take-profit ratios, or want this analysis converted to a trading plan.TARGET DONE
