Technical analysis by Activetrader0 about Symbol PAXG on 7/11/2025

Activetrader0
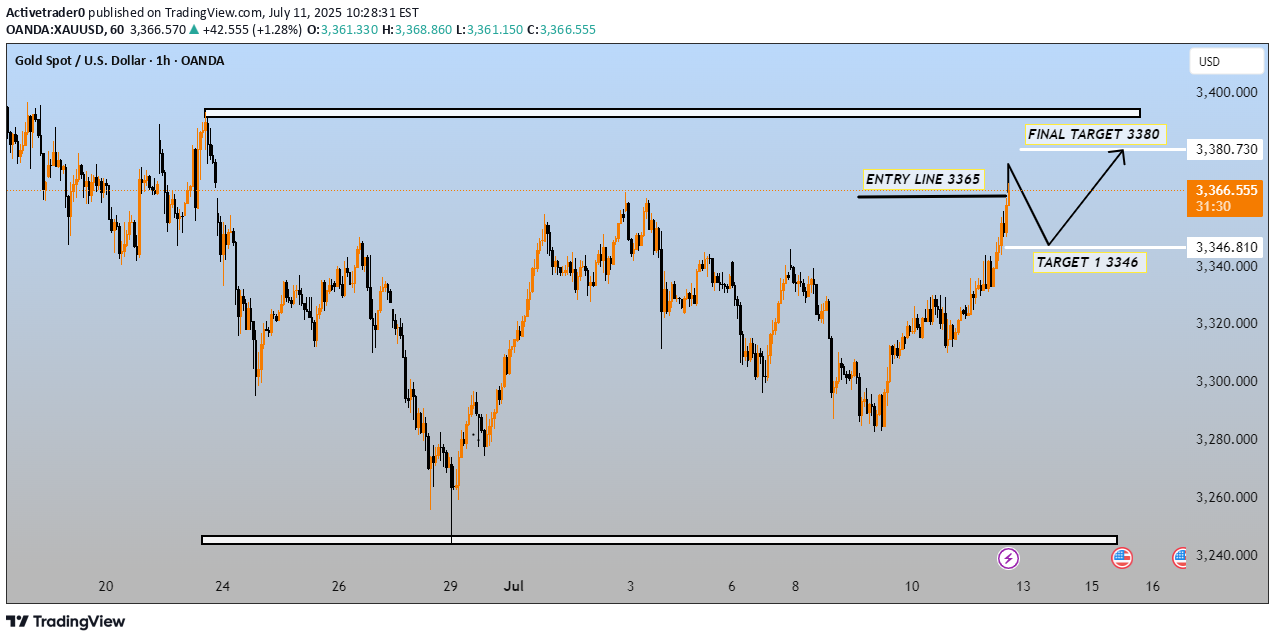
This chart is for Gold Spot against the U.S. Dollar (XAU/USD) on the 1-hour timeframe, and it outlines a potential bullish trading setup. Here's a breakdown of what it shows: --- 📈 Trading Plan Summary: Entry Line: 3365 USD Price is currently above this level at 3365.315 USD, so the entry has already been triggered. Target 1 (First Pullback Target): 3346 USD This is a potential pullback level after the initial move up. The chart anticipates price dipping back to this zone before continuing higher. Final Target: 3380 USD This is the bullish target, assuming the pullback completes and the uptrend resumes. --- 🔄 Expected Price Movement Path: 1. Price has moved up past the 3365 entry point. 2. A retracement/pullback is expected towards 3346 (first support). 3. From there, price is expected to bounce and continue upward to the final target at 3380. --- 🧠 Interpretation: The chart suggests a long (buy) bias with a breakout above 3365. The 3346 level is seen as a support zone where price might retest before continuing up. 3380 marks a potential resistance or take-profit area. --- If you're trading this setup, consider: Monitoring price behavior near 3346 for confirmation (e.g., bullish candles). Using stop-losses below the support zone (around 3340 or lower). Watching for momentum continuation above 3365 to hold toward 3380. Let me know if you want help calculating risk/reward, lot sizing, or confirming technical indicators.
