Technical analysis by Activetrader0 about Symbol BTC on 7/13/2025

Activetrader0
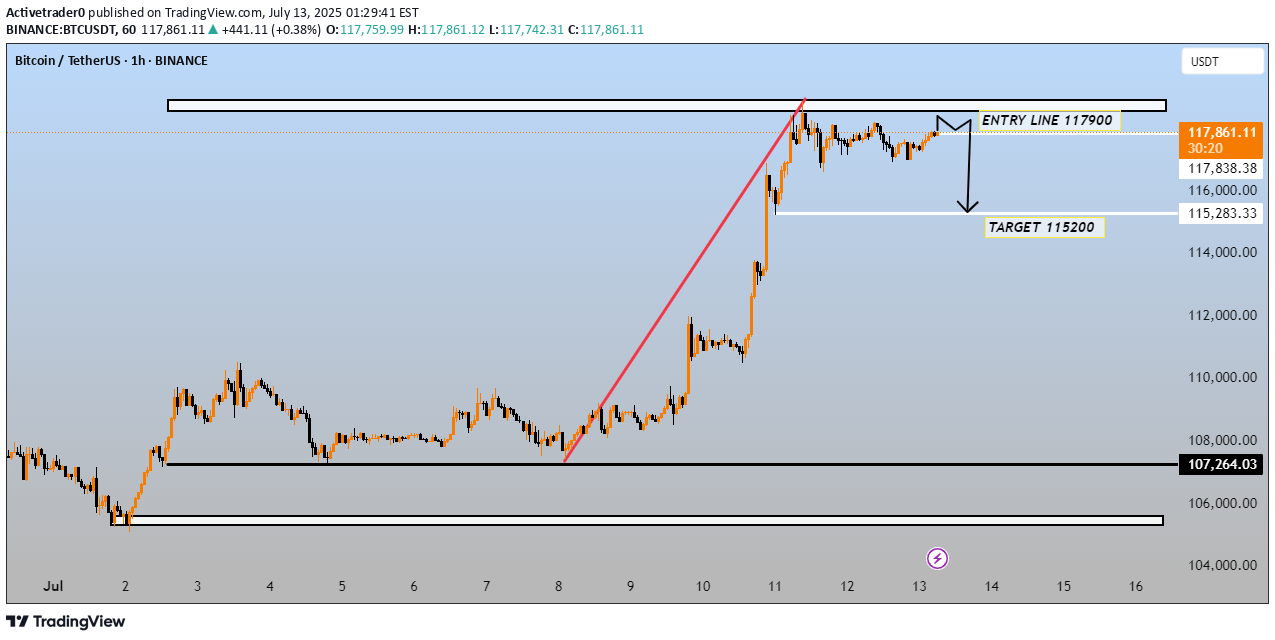
This chart is a technical analysis of the Bitcoin (BTC) / Tether (USDT) pair on the 1-hour timeframe from Binance, showing a potential short (sell) setup. Key Points from the Chart: Current Price: ~$117,861 Entry Line (Short Position): 117,900 Target Price: 115,200 Potential Downward Move: ~2,700 points Support Zone Below Target: Around 107,264 Interpretation: The chart shows a parabolic rally, followed by price consolidation near the top. The analyst is anticipating a reversal from the 117,900 resistance zone, expecting a short-term pullback to the 115,200 support area. The idea seems to be based on a potential double top / distribution pattern or liquidity grab above recent highs. Trade Setup (Bearish Bias): Sell Entry: Near 117,900 Target: 115,200 Stop Loss (not shown): Likely just above the recent high (~118,000+) Considerations: Confirming a reversal (e.g., bearish candlestick pattern or divergence) at 117,900 strengthens the short case. If price breaks and holds above 118,000, the bearish thesis would likely be invalidated. This is a short-term trading idea, not a long-term prediction. Would you like help building a trade plan around this or analyzing a different timeframe?
