
BitonGroup
@t_BitonGroup

Ne tavsiye etmek istersiniz?
önceki makale
پیام های تریدر
filtre
BitonGroup
XAUUSD Video Analysis Brief – Weekly Forecast Summary (2025)

Bu video, hem Fibonacci tabanlı projeksiyonları hem de makro temelleri entegre ederek entegre olan Altın (Xauusd) için temel senaryoları ve teknik görünümü özetler. 3,435 $ → 4300 $ 'a kadar mitingler → major Fibonacci hedeflerine doğru devam ediyor: TP: 4.320 $, Fibonacci% 261.8 Senaryo 2: Düzeltme Firstgold, 3.435 $' ın üzerinde tutulmuyor → 3,45 $ 'lık TP1: TP1: 2650 $' lık bir Destek Desteği: 1650 $ Destek 165. Düzeltme Bölgesi, yenilenmiş bir yükseliş aşaması beklenir. Macro Hizalama Merkezi Bankası Altın Satın Alma (özellikle BRICS) uzun vadeli teklifi destekler. Altın için DXY: DXY: DXY, 98.95'in Altında Dxy: DXY ile Krelasyon: Altcoinsif'in üstünde Golddxy için Golddxy için Boğuk, Riskli Düzeltme Düzeltme. Makro stresi veya USD gücü ile tetiklenen ALTS, altınla birlikte düşebilir.Bu analiz, tüccar, yatırımcılar ve makro analistleri izlemek için anahtar seviyelerle bir sonraki major altın hareketlerinde gezinmek için çoklu scenenario çerçevesi sunar.
BitonGroup
Gold (XAUUSD) Weekly TF 2025

Overview This analysis outlines the structural Fibonacci confluences, scenario planning, and macro-aligned projections for Gold (XAUUSD) on the weekly timeframe. It integrates multi-layered Fibonacci extensions and retracements, mapping out key support and resistance levels, and proposes a nuanced primary scenario that includes both intermediate rallies and corrective movements. Primary Scenario – Multi-Stage Movement Hypothesis We anticipate that gold may initially extend higher from the current level (~$3,325) to test the 127.2% Fibonacci extension at $3,435, with the possibility of a further intermediate peak near $3,500. This level marks a psychological and technical resistance zone and could act as a temporary top. Following this local peak, a corrective phase may unfold. This pullback could evolve into one of the two outlined correction scenarios: 1 TP Correction Scenario Support Target: ~$2,950 Basis: 100% Fib extension confluence and prior resistance turned support Expected Outcome: Price stabilizes at this level and resumes upward momentum 2 TP Correction Scenario Support Target: ~$2,650 Basis: Strong historical structure + 100% Fib confluence from a broader cycle Expected Outcome: This zone acts as a long-term demand accumulation area Upon completion of the corrective structure, we expect gold to reinitiate its primary bullish trend. Bullish Continuation Targets TP1: ~$4,050 (161.8% Fibonacci extension) TP2: ~$4,319 (261.8% Fibonacci extension) These targets align with macroeconomic conditions, central bank accumulation trends, and long-term structural cycles. Supporting Technicals RSI: Holding above 50, indicating preserved bullish momentum MACD: Positive crossover with widening histogram on weekly timeframe Price Action: Strong support zone between $3,280–$3,300 aligning with 161.8% Fib retracement of the recent minor wave Macro Fundamentals & Correlations Central Bank Gold Demand: Sustained net buying by BRICS nations, particularly China and Russia, supports the structural bid on gold Fed Policy: Market anticipates a prolonged pause or gradual rate cuts, favoring non-yielding assets like gold DXY & US10Y Yields: Any further decline in DXY or softening yields would add tailwinds to gold Crypto Correlation: During inflationary hedging or systemic risk periods, gold and crypto may correlate positively, especially with weakening USD Intermarket Relationships: Gold, DXY, and TOTAL (Crypto Market Cap) Gold vs. DXY (US Dollar Index) Gold historically maintains an inverse correlation with DXY. A rising DXY tends to apply downward pressure on gold prices, while a falling DXY enhances gold's upside momentum. Scenario Interactions: If DXY breaks below 98, this could validate the bullish scenario for gold toward $3,435–$4,050. If DXY rallies back above 100, it could trigger the correction scenarios ($2,950 or $2,650) in gold. Gold vs. TOTAL (Crypto Market Cap) Gold and TOTAL may show positive correlation during periods of USD weakening and global liquidity expansion. Scenario Interactions: If gold rallies toward $3,500 and TOTAL also breaks key resistance (e.g., $1.8T–$2T), this signals synchronized bullish risk appetite. If gold corrects while TOTAL continues to rise, it could indicate rotation of liquidity from defensive to risk-on assets. A simultaneous correction in both may occur if DXY strengthens aggressively or if macro shocks reduce global liquidity. These intermarket relationships should be monitored continuously to assess the evolving macro context and validate the chosen scenario. In the case of a gold correction toward $2,950 or $2,650, the impact on altcoins will hinge on the prevailing macroeconomic backdrop. If the correction stems from a healthy, technical rebalancing within a risk-on environment—without a concurrent surge in the U.S. dollar—it could signal a shift in capital from defensive assets like gold into more speculative plays, including altcoins. This type of capital rotation often benefits the crypto market, particularly if TOTAL (crypto market cap) holds or advances structurally. However, if the correction is caused by rising dollar strength, tightening financial conditions, or broader risk-off sentiment, altcoins may instead suffer alongside gold, as liquidity is withdrawn across the board. Therefore, the context and drivers behind gold’s correction are crucial in assessing its downstream effects on altcoin performance. From a philosophical lens, gold's cyclical ascent and retreat mirrors the rhythm of nature and human experience—expansion, contraction, and renewal. Just as rivers carve valleys before surging toward the ocean, the market too must surrender gains to gather force. A correction in gold is not merely a financial event, but a moment of recalibration—an inhale before the next exhale of momentum. It invites reflection: whether wealth seeks refuge or ventures into risk, whether fear contracts or ambition expands. In this interplay, altcoins may inherit the restless spirit of capital in search of yield, as gold, the ancient anchor of value, briefly pauses in its timeless journey. Conclusion We present a multi-phased path for gold where: An initial bullish breakout toward $3,435–$3,500 forms a short- to mid-term peak A subsequent correction brings gold to either $2,950 or $2,650, depending on macro triggers A renewed bull rally drives gold toward $4,050 and potentially $4,319 and beyond This scenario reflects both the cyclical nature of market structure and the macro-fundamental backing that continues to support long-term gold strength.the bullish momentum seems to be kicked offFirst Target AchievedAll Targets Achieved
BitonGroup
S&P 500 Index (SPX) Weekly TF – 2025
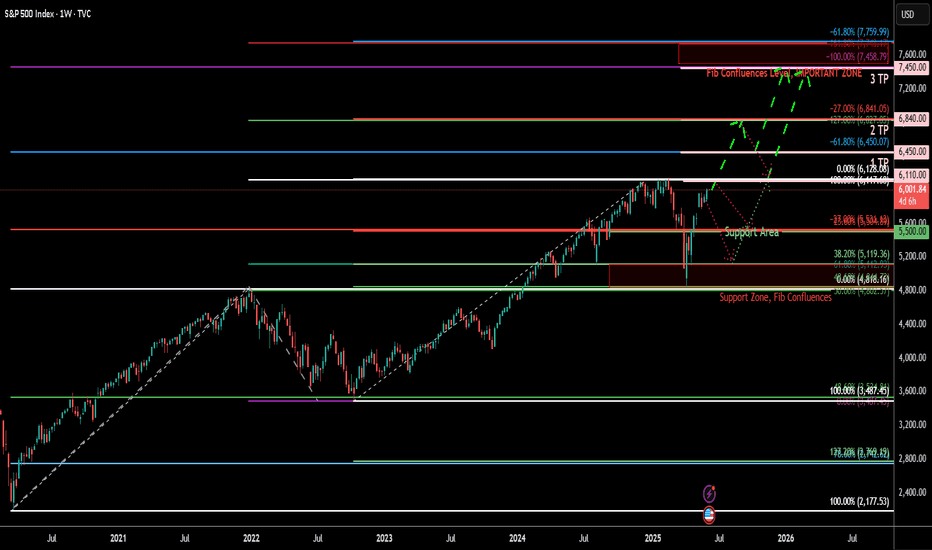
Grafik Bağlamı: Kullanılan Araçlar: 3 Fibonacci Araçlar: 1. Bir ** Fibonacci Retracle ** (ATH'den Alt'a) 2. İKİ ** TREND TEMEL FIBONACCI Uzantıları *** Anahtar Seviyeleri ve Bölgeleri: \ ~ 4,820–5,100*** Destek Alanı (Tesisat) ** Direnç) Bölgeler: ***TP1: ** 6.450 ** (FIB Confluence & -61.8)*TP2: ** 6.840 ** (-27%)*TP3: ** 7,450–7,760 ** (Major konfluence) teknik gözlemler:*spx a ** kritik direnç (\ ~ ~ ~ ~ ~ ~ upx ile yaklaşıyor. ** Yeşil Kesikli Yol **, mevcut \ ~ 6.000 seviyesinden TP1 (\ ~ 6,450), TP3 (\ ~ 7,450–7,760), eğer yoksa tp3 (\ ~ 7,450–7,760), ** Makro şok vuruşları önerir. Boğa mitingine devam etmeden önce \ ~ 5,120 ve hatta 4.820 bölge.*major Destek Bölgesi ** 4.820–5,120 **, hem uzatma hem de tarihsel koparma seviyelerinden önemli FIB geri çekilme seviyeleri (% 38.2 ve% 61.8) içerir. ** Q3-Q4 2025 ** 'daki oranları azaltması, hisse senedi değerlemelerini artırması bekleniyor.*Likidite genişlemesi ve Dovish Outlook, ** hisse senetleri ve kripto ** ** dahil olmak üzere risk varlıkları. Bir düzeltme kazanç hayal kırıklıklarını veya makro sürprizleri (örneğin, işler veya TÜFE şokları) takip edebilir. Sınır önyargısı ve senaryoları: ** Senaryo 1 -Ralli öncesi düzeltme (örn. Mor yol) *** SPX Makro Grep (yüksek CPI, Hawkish Fed) ile yüzleşirse, geri çekilme bekleyin:*5,600 = fib -23.6 bölge*5.82220,: Konfluence bölgesi*Bunlar act olarak ** birikim bölgeleri ** olarak bir sonraki ayağı TP1 ve ötesine doğru ayarlayacaktır. TP1 (\ ~ 6,450), TP2 (\ ~ 6,840)**sonunda ** TP3 (7,450–7,760) *** ** GOLD üzerindeki etkiye ulaşır **: Mayıs mücadelesi; yatırımcı hisse senedi tercihi.* ** kripto üzerinde etki **: Güçlü riskli iştah, altseason devam. Kullanılan endikatörler:* 3 fibonacci seviyeleri (geri çekilme + 2 uzantılar)* trend çizgileri (makro ve lokal)* Konfluence MappingPhilosophical/anlatıcı katman: pazarın bu aşaması, bir testi görmüştür. Parasal hafifleme başlarken ATHS'ye yaklaşan özkaynak piyasaları kırılgan bir optimism yansıtır. Fibonacci seviyeleri act Anlatı kontrol noktaları olarak - matematiksel kadar psikolojik. İnanç mı yoksa yeniden dengeleme için mi düşüyoruz? Önyargı ve Strateji Sonrası: Önyargı: Dikkatli Boğa*Strateji*Strateji:*Bekleme ** Taze Breakout> 6,128 ** Taze uzun girişler için ** 5,100–5,500 ** TP1, TP3 ** TP1, TP3 ** Referans Exts. Analiz - Bearish Bias:* Toplam: Boğa önyargısı* Total3 - Boğa önyargısı:* US10Y verimi - düşen önyargı etkisi:
BitonGroup
Ethereum / US Dollars (ETHUSDT) Short Selling with DCA 19/09/23
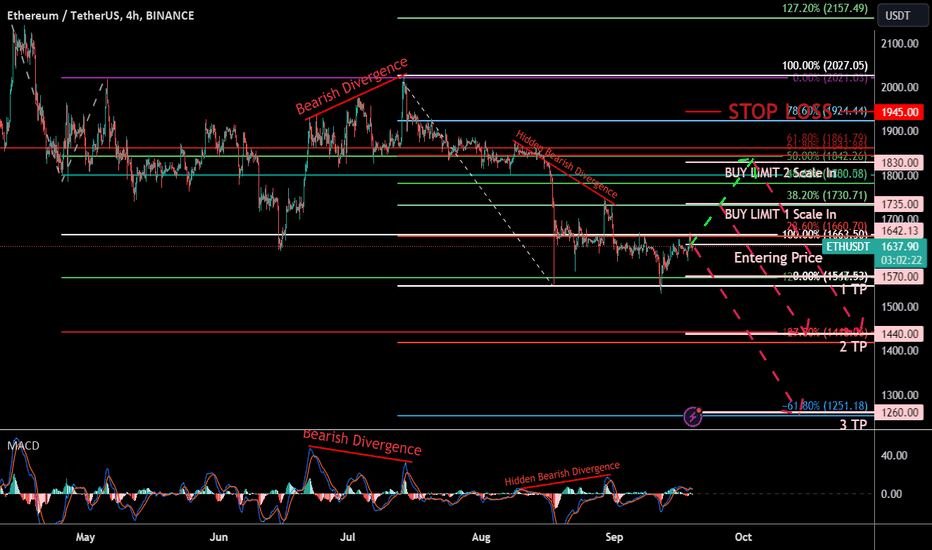
تحلیل تکنیکال: در این تحلیل، من یک رویکرد جامع را اتخاذ میکنم که سطوح اصلاحی و گسترشی فیبوناچی را با پروجکشن فیبوناچی، تحلیل همگرایی و اندیکاتور MACD ادغام میکند، با یک گرایش مشخص به فروش استقراضی در تایم فریم 4 ساعته، همانطور که در تکلیف درخواست شده بود، مربوط به تاریخ 15/09/2023، ساعت 12:55 بعد از ظهر در بخش پیامهای لینکدین. علاوه بر این، من یک استراتژی میانگین هزینه دلاری (DCA) را با دو سطح افزایش پلهای معرفی کرد. لطفا برای یک تحلیل بصری جامع به نمودار مراجعه کنید. لطفاً برای درک بهتر، نمودار را کوچکتر کنید (zoom out). مشاهدات کلیدی تکنیکال: سطوح فیبوناچی: تحلیل من به دقت سطوح اصلاحی، گسترشی و پروجکشن فیبوناچی را بر روی نمودار قرار میدهد و مناطق مقاومت بالقوه را برجسته میکند و گرایش به فروش استقراضی را تثبیت میبخشد. واگرایی MACD: هوشیاری برای الگوهای واگرایی MACD همچنان بسیار مهم است. (واگرایی نزولی) همراه با (واگرایی نزولی پنهان) گرایش به فروش استقراضی را تقویت میکند. نقاط ورود استراتژیک: من نقاط ورود کلیدی را برای شروع موقعیتهای فروش استقراضی، در قیمت لحظهای 1642 دلار در زمان انتشار، با بهرهگیری از حرکات قیمت در هماهنگی با گرایش کلی، شناسایی میکنم. شاخص دلار آمریکا (DXY) بسیار صعودی است، که نشانه دیگری است که نشان میدهد کل ارزش بازار ارزهای دیجیتال ممکن است کاهش یابد و در نهایت BTC به قیمتهای پایینتری سقوط کرد. تحلیل فوق میتواند احتمال افزایش شاخص دلار آمریکا (DXY) را نشان دهد. شرایط تکنیکال: سطوح برداشت سود (TPs): برای به حداکثر رساندن سودهای بالقوه از گرایش به فروش استقراضی، سطوح TP زیر را در نظر بگیرید: اولین TP: 1570 دلار دومین TP: 1440 دلار سومین TP: 1260 دلار میانگین هزینه دلاری (DCA): من از یک استراتژی DCA برای افزایش پلهای موقعیتهای فروش استقراضی حمایت میکنم. با یک موقعیت جزئی در نقطه ورود اولیه شروع کنید و به تدریج به موقعیت فروش استقراضی در سطوح افزایش پلهای DCA زیر اضافه کنید: سطح افزایش پلهای 1: سطح قیمت DCA 1: 1735 دلار سطح افزایش پلهای 2: سطح قیمت DCA 2: 1830 دلار حد ضرر: مدیریت ریسک محتاطانه شامل قرار دادن حد ضرر در 1945 دلار است که بالاتر از سطح 78.6٪ سطح اصلاحی فیبوناچی معکوس جزئی قرار دارد، تا در برابر معکوسهای غیرمنتظره قیمت محافظت شود. سناریوی معاملاتی: گرایش به فروش استقراضی: با توجه به همگرایی مقاومت فیبوناچی، واگرایی نزولی و واگرایی نزولی پنهان MACD و نقاط ورود استراتژیک، تحلیل من قویاً از گرایش به فروش استقراضی حمایت میکند. انعطافپذیری: نسبت به شرایط بازار انعطافپذیر باشید و آماده باشید تا استراتژی خود را در پاسخ به هرگونه تحول غیرمنتظره تنظیم کنید. این تحلیل مبتنی بر دادههای تاریخی، اندیکاتورهای تکنیکال و یک گرایش نزولی واضح است که با یک استراتژی DCA با دو سطح افزایش پلهای تکمیل میشود. مانند هر استراتژی معاملاتی، انجام تحقیقات کامل، پایبندی به برنامه معاملاتی خود و اصلاح مداوم رویکرد خود در حین پیمایش در بازارهای پویای ارزهای دیجیتال ضروری است. من مشتاقانه منتظر بینش و بحثهای جذاب شما در مورد این تحلیل هستم، زیرا ما فرصتها را در سناریوهای بازار صعودی بررسی میکنیم!نظر: ویرایش: اصلاح اشتباه تایپی... هر دو سطح افزایش پلهای، سفارشهای فروش محدود (Sell Limit) هستند و یک اشتباه تایپی وجود دارد. *(سفارشهای خرید محدود اشتباه تایپی (خطا) هستند.)* صحیح: فروش محدود 1: 1735 دلار فروش محدود 2: 1830 دلارنظر: تحلیل بنیادی - جلسه FOMC، 20 سپتامبر 2023 بررسی اجمالی: جلسه آتی کمیته بازار آزاد فدرال (FOMC) که برای 20 سپتامبر 2023 برنامهریزی شده است، از اهمیت بسزایی برای بازارهای مالی در سراسر جهان برخوردار است. یکی از نقاط کانونی این رویداد، حول تصمیم بالقوه در مورد افزایش نرخ بهره توسط فدرال رزرو S آمریکا متمرکز است. تصمیم نرخ بهره: فعالان بازار برای هرگونه نشانه ای از افزایش نرخ بهره در طول جلسه در حالت آماده باش هستند. تصمیم فدرال رزرو در مورد نرخ بهره، پیامدهای عمیقی برای اقتصاد S آمریکا و بازارهای مالی جهانی دارد. اگر افزایش نرخ بهره اعلام شود، نشان دهنده پاسخ بانک مرکزی به عوامل مختلف اقتصادی از جمله تورم، سطح اشتغال و ثبات کلی اقتصادی است. تاثیر بر دلار S آمریکا (DXY): افزایش نرخ بهره به طور معمول فشار صعودی بر دلار S آمریکا (USD) وارد میکند. در نتیجه، این ممکن است منجر به تقویت شاخص دلار S آمریکا (DXY) شود، که عملکرد USD را در برابر سبدی از ارزهای major اصلی جهان اندازه گیری می کند. تقویت USD می تواند پیامدهایی برای تجارت جهانی، بازارهای ارز و طبقات دارایی مختلف داشته باشد. تاثیر بر ارزهای دیجیتال: در حوزه ارزهای دیجیتال، دلار قویتر از نظر تاریخی با فشار نزولی بر قیمت داراییهای دیجیتال همبستگی دارد. یک USD قوی می تواند ورود سرمایه گذاران خارجی به بازار ارزهای دیجیتال را نسبتاً گران تر کند و منجر به کاهش تقاضا شود. با این حال، توجه به این نکته ضروری است که بازارهای ارزهای دیجیتال تحت تأثیر عوامل چندوجهی از جمله احساسات بازار، تحولات نظارتی و روندهای اقتصاد کلان قرار دارند. نتیجه گیری: جلسه FOMC در 20 سپتامبر 2023 به عنوان یک رویداد مهم برای سرمایه گذاران و معامله گران در بازارهای دارایی سنتی و دیجیتال عمل می کند. فراتر از واکنش فوری به تصمیمات نرخ بهره، نظارت بر اظهارات و چشم انداز فدرال رزرو برای بینش در مورد سیاست های پولی آینده بسیار مهم است. تعامل بین سیاست های پولی، مبانی اقتصادی و احساسات بازار، پویایی بازارهای مالی را در روزها و هفته های پس از این رویداد محوری شکل داد.معامله بسته شد: هدف محقق شد: اولین TP محقق شد معامله فعال است: دومین و سومین TP در حال پیشرفت است
BitonGroup
Zilliqa /US Dollars (ZILUSDT) Short Selling Chance19/02/2023

Zilliqa /US Dollars (ZILUSDT) Short Selling Chance19/02/2023 Technical Analysis: In this analysis, I adopt an all-encompassing approach that melds Fibonacci retracement and extension levels with Fibonacci Projection, confluence analysis, and the MACD indicator, with a distinct short sell bias for the 30 Minutes Time frame as requested on the assignment, dated on 15/09/2023, 12:55 pm on LinkedIn message section. Additionally, I'll introduce a strategic Dollar-Cost Averaging (DCA) strategy with two scale-in levels. Please refer to the chart for a comprehensive visual analysis: please zoom out the chart for better comprehension. Key Technical Observations: Fibonacci Levels: My analysis meticulously places Fibonacci retracement and extension and levels on the chart, highlighting potential resistance zones and solidifying the short sell bias. MACD Divergence: Vigilance for MACD divergence patterns remains paramount. (Bearish Divergence) accompanied with (Hidden Bearish Divergence) bolsters the short sell bias. Strategic Entry Points: I identify key entry points for initiating short positions, at $0.01620 Spot Price at the time of publication capitalizing on price movements in harmony with the overall bias. DXY is very much bullish which is an other sign that the Total Crypto Market cap may fall and ultimately BTC will dip to the lower prices the above analysis can show the possibilities of DXY rally Technical Conditions: Take-Profit Levels (TPs): To maximize potential gains from the short sell bias, consider the following TP levels: 1st TP: $0.01619 2nd TP: $0.01580 3rd TP: $0.01550 Dollar-Cost Averaging (DCA): I advocate a DCA strategy for scaling into short positions. Start with a partial position at the initial entry point and progressively adding to the short position at the following DCA scale-in levels: Scale-In Level 1: DCA Price Level 1: $0.01635 Scale-In Level 2: DCA Price Level 2: $0.01650 Stop Loss: Prudent risk management includes placing a stop loss at $0.017 which is above the 0% level of the minor reverse Fibonacci Retracement level, to safeguard against unexpected price reversals. Trading Scenario: Short Sell Bias: Given the confluence of Fibonacci resistance, a bearish and a hidden MACD divergence, and strategic entry points, my analysis strongly favors a short sell bias. Adaptability: Stay adaptable to market conditions, prepared to adjust your strategy in response to any unexpected developments. This analysis is grounded in historical data, technical indicators, and a clear bearish bias, complemented by a DCA strategy with two scale-in levels. As with any trading strategy, it's essential to conduct thorough research, adhere to your trading plan, and continuously refine your approach as we navigate the dynamic cryptocurrency markets. I eagerly await your insights and engaging discussions about this analysis, as we explore opportunities in bullish market scenarios!Comment: Fundamental Analysis : FOMC Meeting, September 20, 2023 Overview: The upcoming Federal Open Market Committee (FOMC) meeting scheduled for September 20, 2023, holds paramount significance for financial markets worldwide. One of the focal points of this event centers on the potential decision regarding an interest rate increase by the U.S. Federal Reserve. Interest Rate Decision: Market participants are on high alert for any indication of an interest rate hike during the meeting. The Federal Reserve's decision regarding interest rates carries profound implications for the U.S. economy and global financial markets. If an interest rate increase is announced, it signifies the central bank's response to various economic factors, including inflation, employment levels, and overall economic stability. Impact on the U.S. Dollar (DXY): An interest rate hike typically exerts upward pressure on the U.S. Dollar (USD). Consequently, this may lead to a strengthening of the U.S. Dollar Index (DXY), which measures the USD's performance against a basket of major world currencies. A stronger USD can have implications for global trade, foreign exchange markets, and various asset classes. Effect on Cryptocurrencies: In the realm of cryptocurrencies, a stronger USD historically correlates with downward pressure on digital asset prices. A robust USD can make it relatively more expensive for foreign investors to enter the cryptocurrency market, leading to decreased demand. However, it's essential to consider that cryptocurrency markets are influenced by multifaceted factors, including market sentiment, regulatory developments, and macroeconomic trends. Conclusion: The FOMC meeting on September 20, 2023, serves as a critical event for investors and traders across traditional and digital asset markets. Beyond the immediate reaction to interest rate decisions, it is vital to monitor the Federal Reserve's statements and outlook for insights into future monetary policy. The interplay between monetary policy, economic fundamentals, and market sentiment will shape the dynamics of financial markets in the days and weeks following this pivotal event.
BitonGroup
Shentu / US Dollars (CTKUSDT) Coin Analysis 11/09/2023

Shentu / US Dollars (CTKUSDT) Coin Analysis 11/09/2023 Fundamental Analysis: Shentu Chain is a security-focused delegated proof-of-stake blockchain designed for the secure execution of mission-critical applications, including DeFi, NFTs, and autonomous vehicles. The platform places a strong emphasis on cross-chain compatibility and operates as a Cosmos Hub with comprehensive compatibility for EVM (Ethereum Virtual Machine) and Hyperledger Burrow. It also supports eWASM and Ant Financial's AntChain. Shentu Chain offers a Security Oracle that delivers real-time monitoring of on-chain transactions across various protocols, proactively identifying and flagging potential malicious vulnerabilities before they can be exploited. Depending on their security score, audited blockchain projects from any protocol may qualify for ShentuShield membership, a decentralized reimbursement system designed to compensate users for crypto assets that are lost or stolen due to security issues. ShentuShield memberships are open to all community members of eligible blockchain projects, providing an added layer of security for crypto asset holders in case of unexpected events. Projects on Shentu Chain have the option to code in DeepSEA, an exceptionally secure programming language supported by prominent organizations such as the Ethereum Foundation, Qtum Foundation, and IBM. DeepSEA seamlessly interfaces with the Shentu Virtual Machine (SVM), which is fully compatible with EVM. SVM introduces innovative ways to access, verify, and incorporate risk-related information into smart contract decisions. The native digital utility token of Shentu Chain is CTK, which serves as the core utility for various on-chain functions, including operating the Security Oracle and ShentuShield systems, covering gas costs on the Shentu Chain, and participating in governance decisions within the network. ShentuShield is a decentralized membership system designed to facilitate reimbursements for lost or stolen cryptocurrency assets from any blockchain protocol. The decision-making process for reimbursements lies entirely in the hands of ShentuShield members, who can be blockchain projects or individual community supporters. Members have the option to participate in various capacities, either as Collateral Providers or Shield Purchasers. Collateral Providers contribute their own collateral, typically in the form of CTK tokens, and in return, they earn staking rewards on their staked CTK. They also receive a portion of the fees paid by Shield Purchasers. Shield Purchasers, on the other hand, set aside funds from the Pool to act as a reserve for potential reimbursements of their own cryptocurrency assets. In exchange for this protection, Shield Purchasers pay a fee in CTK, which directly benefits the Collateral Providers. The CTK fees collected from Shield Purchasers are used to compensate Collateral Providers in the event of a reimbursement request. This unique system fosters a collaborative ecosystem where participants collectively share the responsibility of safeguarding crypto assets and providing reimbursement support. It offers transparency through a list of publicly viewable and audited clients, ensuring accountability and trust within the community. The Security Oracle comprises a decentralized network of operators equipped with cutting-edge security technologies, responsible for assessing the trustworthiness of mission-critical smart contracts, particularly those employed in DeFi applications. As compensation for delivering real-time, updatable security scores, these operators are rewarded with CTK tokens. The Security Oracle is designed for interoperability, making it compatible with any protocol. This interoperability empowers users of various protocols to make informed decisions before engaging with smart contracts. Smart contracts that have integrated the Security Oracle can proactively identify and block potentially malicious transactions, thereby mitigating the risk of cryptocurrency asset loss. Although the Shentu Virtual Machine (SVM) is fully compatible with the Ethereum Virtual Machine (EVM), its architecture is inspired by the widely used x86-64 OS process model found in computers worldwide. There is also potential for future extensions to support arm64. The SVM introduces the capability to configure on-chain security parameters, allowing smart contracts to interact with one another in ways that align with their individual risk tolerances. Moreover, the SVM is designed to incorporate a smart contract sandbox, which isolates the operation of smart contracts, particularly those that haven't been adequately secured, from the broader system. This isolation enhances security and minimizes potential risks associated with unverified smart contracts. DeepSEA is a highly secure programming language and compiler toolchain that seamlessly integrates with the Shentu Virtual Machine (SVM), Ethereum Virtual Machine (EVM), eWASM, and Ant Financial's AntChain. DeepSEA has received research grants from Ethereum, IBM-Columbia, and Qtum to advance its exceptionally secure programming language. When developers use DeepSEA for coding, the language automatically generates mathematical proofs to demonstrate the alignment between the intended specification and the actual code. This automatic proof generation enables a more comprehensive level of formal verification and correctness in smart contract development, enhancing security and reliability. Technical Analysis: We have applied Fibonacci retracement tools, extending from $0 to $3.97 the so called last great bullish cycle. Within this analysis, we have identified potential support and resistance areas on the chart based on the retracement levels. In addition to the retracement levels, we have utilized Fibonacci projection tools to delineate additional potential support areas below the previous all-time low price. This projection is based on the most recent market cycle. Consequently, we have established two potential support levels at $0.45 and $0.2. Furthermore, we have outlined three potential price targets using the Fibonacci retracement levels from the ATH cycle. These targets are anticipated within the next few weeks to months and are as follows: First Target Price (1 TP): $0.85 Second Target Price (2 TP): $1.5 Third Target Price (3 TP): $2 These levels serve as key reference points for our analysis, guiding our expectations for future price movements. Sentiment Analysis: Considering the possibility of depreciation in the total market capitalization of cryptocurrencies and the price of Bitcoin (BTC) in the upcoming months, it is reasonable to consider employing a Dollar Cost Averaging (DCA) strategy for long positions at the specified support levels.
BitonGroup
dYdX / US Dollar (DYDXUSDT) Token Analysis 11/09/2023

dYdX / US Dollar (DYDXUSDT) Token Analysis 11/09/2023 Fundamental Analysis: DYDX (dYdX) is the governance token associated with the layer 2 protocol of the decentralized cryptocurrency exchange that shares its name. This token plays a crucial role in facilitating the operation of the layer 2 protocol and empowers traders, liquidity providers, and partners to actively participate in shaping the protocol's future as part of the community. Token holders enjoy various privileges, including the ability to propose changes to the dYdX layer 2 protocol. They also have opportunities for profit through activities such as token staking and trading fee discounts. Leveraging the StarkEx scalability engine from Starkware, the layer 2 solution on dYdX is specifically tailored for cross-margined perpetual trading. This scaling solution enhances transaction speed, eliminates gas costs, reduces trading fees, and lowers minimum trade sizes on the platform. As an open-source platform with smart contract capabilities, dYdX serves as a versatile ecosystem for users to engage in lending, borrowing, and trading various crypto assets. While the platform does support spot trading, its primary focus lies in derivatives and margin trading. Founded in 2017, dYdX secured over $10 million in seed venture capitalist funding and officially launched in 2019. The DXDY token's initial coin offering (ICO) took place on September 9th, 2021. dYdX stands as a cryptocurrency exchange that melds advanced financial tools with the principles of decentralization. The platform offers support for margin trading, a financial product that empowers investors to amplify their exposure to digital assets through leverage. dYdX offers two distinct margin trading options: isolated margin, allowing users to allocate specific funds for a trade, and cross-margin, which utilizes all assets held by a trader on the platform. Additionally, dYdX facilitates the trading of perpetuals, a type of futures contract without a predetermined expiry date. The exchange provides a maximum leverage of 25x on synthetic assets that have no expiration date. When users deposit funds into their dYdX accounts, they immediately begin earning interest, as their assets become part of a global lending pool dedicated to each cryptocurrency. dYdX ensures the security of lenders by requiring borrowers to maintain sufficient collateral in their accounts at all times. Borrowing on dYdX enables users to swiftly acquire any available asset on the platform by using their existing funds as collateral for the loan. Unlike automated market makers such as Uniswap, dYdX employs an order book architecture. dYdX's Layer 2 solution enhances network scalability by implementing zero-knowledge rollup technology, specifically zkSTARKS. This technology generates proofs while validating a batch of transactions off-chain. These proofs are then transmitted back to the blockchain, where they are verified by a smart contract. zkSTARKS allows for the offloading of resource-intensive computations from the mainnet without compromising decentralization. In addition to trading and liquidity provider rewards, dYdX introduces retroactive mining benefits, demonstrating gratitude to historical users and encouraging their continued participation on the Layer 2 protocol. Token holders can stake their assets in dYdX's safety and liquidity pools. The safety pool serves as a safeguard in case of a shortfall event, while the liquidity pool aims to attract high-quality market makers to the platform. DYDX is an ERC-20 token that has been deployed on the Ethereum mainnet. The layer 2 scaling solution utilized by dYdX is constructed on Starkware's ZK-STARKS technology, leveraging the Ethereum blockchain to validate transaction proofs. The DYDX token was initially made available for purchase in September 2021. Antonio Juliano, a seasoned programmer with a strong background in blockchain technology, serves as the Founder and CEO of dYdX. His foray into the cryptocurrency realm began in 2015 when he secured a position as a software engineer at Coinbase, a prominent cryptocurrency exchange platform. Holding a computer science degree from Princeton University, Antonio Juliano embarked on his entrepreneurial journey and established dYdX in early 2017. Zhuoxun Yin assumes the role of Head of Operations at dYdX. His prior experience includes positions at Nimble, a social sales and marketing CRM, and Bain & Company, a renowned consulting service. Zhuoxun Yin pursued his education at the University of Queensland, where he earned a bachelor's degree in commerce. Technical Analysis: We have applied Fibonacci retracement tools, extending from $0 to its all-time high (ATH) of $27.9. Within this analysis, we have identified potential support and resistance areas on the chart based on the retracement levels. In addition to the retracement levels, we have utilized Fibonacci projection tools to delineate additional potential support areas below the previous all-time low price. This projection is based on the most recent market cycle. Consequently, we have established three potential support levels at $1.4 or 95% and $1 Defined by Price Action and $0.5 defined by Projection of the past cycle. Furthermore, we have outlined three potential price targets using the Fibonacci retracement levels from the ATH cycle. These targets are anticipated within the next few weeks to months and are as follows: First Target Price (1 TP): $4.15 Second Target Price (2 TP): $6 Third Target Price (3 TP): $10.5 These levels serve as key reference points for our analysis, guiding our expectations for future price movements. Sentiment Analysis: Considering the possibility of depreciation in the total market capitalization of cryptocurrencies and the price of Bitcoin (BTC) in the upcoming months, it is reasonable to consider employing a Dollar Cost Averaging (DCA) strategy for long positions at the specified support levels.
BitonGroup
JOE / US Dollar (JOEUSDT) Token Analysis 11/09/2023

JOE / US Dollar (JOEUSDT) Token Analysis 11/09/2023 Fundamental Analysis: JOE (JOE) serves as the native token for Trader Joe, a decentralized exchange (DEX) operating on the Avalanche (AVAX) blockchain. Trader Joe offers a range of DeFi services, including swapping, staking, and yield farming. Since its launch in June 2021, the exchange has experienced rapid growth, attracting over $4 billion in total value locked (TVL). Trader Joe places a strong emphasis on a community-first approach and values innovation, speed, and security. The platform aims to provide a comprehensive DeFi experience, offering various services while prioritizing the safety of its users' assets. To achieve these goals, Trader Joe has laid out an ambitious roadmap for 2021, focusing on token-holder growth. This roadmap includes plans for enhanced staking, the addition of non-fungible-token (NFT) exchange listings, collateralization of the JOE token, and the introduction of leveraged trading features. Trader Joe offers a full suite of features akin to a modern decentralized exchange (DEX) and combines this with a user-friendly interface, ensuring swift and cost-effective transactions. Users have the option to participate in yield farms, providing liquidity and earning JOE (JOE) tokens as rewards, which can subsequently be staked and used for voting in governance proposals. In addition to its DEX functionality, Trader Joe operates a lending protocol known as Banker Joe, built upon the Compound (COMP) protocol. This non-custodial lending platform enables users to both borrow and lend funds. Furthermore, users can open leveraged positions, utilizing either their provided liquidity or borrowed funds. Trader Joe is committed to enhancing the utility and adoption of the JOE token. To achieve this, the project is working on several key additions, aiming to establish itself as the primary DeFi platform within the Avalanche ecosystem. These forthcoming features include the ability to use JOE as collateral for borrowing, the introduction of limit orders, and the inclusion of options and futures trading on the platform. Thanks to its rapid pace of innovation and distinctive comic book-inspired branding, Trader Joe has attracted substantial support from prominent figures within the DeFi community. Notable backers include Stani Kulechov, the founder of AAVE (AAVE), and Darren Lau, among others. Trader Joe operates on the Avalanche (AVAX) blockchain, which features a distinctive proprietary consensus mechanism. In this mechanism, all nodes engage in processing and validating transactions by utilizing a directed acyclic graph (DAG) protocol. At present, the management of the project's treasury is entrusted to its developers, Cryptofish and 0xMurloc. However, the Trader Joe community has plans to establish a multi-signature governance mechanism in the future. In the interim, token holders have the ability to vote on the development of the protocol through the Snapshot platform. Trader Joe was founded by two pseudonymous developers known as Cryptofish and 0xMurloc. Cryptofish is a self-described full-stack and smart contract engineer who played an early role in various Avalanche projects, including Snowball and Sherpa Cash. Prior to this, Cryptofish worked at Google and holds a Master's degree in Computer Science from a U.S. university. On the other hand, 0xMurloc is a full-stack developer with a background in launching several startups and serving as a Senior Product Lead at Grab. In addition to Cryptofish and 0xMurloc, the Trader Joe team comprises over a dozen other pseudonymous contributors who work across various areas, including software development, marketing, and community management. The total supply of JOE (JOE) amounts to 500 million tokens. Notably, JOE was introduced to the market without any pre-sale, private sale, or pre-listing allocations. The distribution of JOE tokens is structured as follows: 50% allocated to liquidity providers. 20% allocated to the project's treasury. 20% designated for the team, subject to a three-month cliff period. 10% reserved for future investors, also subject to a three-month cliff period. JOE tokens are being emitted over a 30-month period, and individuals staking JOE can earn 0.05% of all trades conducted on the platform. Furthermore, JOE tokens are designed to share a portion of the fees generated from lending interest and liquidations with the staking pool. It's important to note that the emission rates of JOE are programmed to progressively decrease over time and are set to conclude at the start of January 2024. Technical Analysis: We have applied Fibonacci retracement tools, extending from $0 to its all-time high (ATH) of $2.79. Within this analysis, we have identified potential support and resistance areas on the chart based on the retracement levels. In addition to the retracement levels, we have utilized Fibonacci projection tools to delineate additional potential support areas below the previous all-time low price. This projection is based on the most recent market cycle. Consequently, we have established two potential support levels at $0.13 and $0.07. Furthermore, we have outlined three potential price targets using the Fibonacci retracement levels from the ATH cycle. These targets are anticipated within the next few weeks to months and are as follows: First Target Price (1 TP): $0.6 Second Target Price (2 TP): $1.065 Third Target Price (3 TP): $1.4 These levels serve as key reference points for our analysis, guiding our expectations for future price movements. Sentiment Analysis: Considering the possibility of depreciation in the total market capitalization of cryptocurrencies and the price of Bitcoin (BTC) in the upcoming months, it is reasonable to consider employing a Dollar Cost Averaging (DCA) strategy for long positions at the specified support levels.
BitonGroup
Curve / US Dollars (CRVUSDT) Token Analysis 11/09/2023

Temel analiz: Curve, likidite yönetimini denetlemek için otomatik bir piyasa maker (AMM) kullanan, sabit paralarda uzmanlaşmış merkezi olmayan bir borsa olarak işlev görmektedir. Yolculuğu Ocak 2020'de başladı ve Curve o zamandan beri merkezi olmayan finans (DeFi) hareketiyle yakından ilişkilendirildi ve 2020'nin sonlarında önemli bir büyüme yaşadı. Curve, Ağustos ayında yerel token'ı olarak CRV'yi içeren merkezi olmayan otonom bir organizasyon (DAO) tanıttı. Bu DAO, kullanıcıların yatırdığı likiditeyi yönetmekten sorumlu çeşitli akıllı sözleşmeler arasında bağlantılar kurmak için Ethereum tabanlı oluşturma aracı Aragon'dan yararlanır. Bu DAO içindeki yönetimin, Aragon ile karşılaştırıldığında ağırlıklandırma ve diğer önemli yönler açısından farklılık gösterdiğini belirtmekte fayda var. Curve, özellikle sabit para ticareti için tasarlanmış bir Otomatik Piyasa Maker (AMM) rolünü yerine getirerek önemli bir ilgi topladı. DAO ve CRV token'larının tanıtımı, CRV bir yönetim işlevi gördüğü ve kullanıcılara likidite taahhüt seviyelerine ve sahiplik sürelerine göre dağıtıldığı için karlılığına katkıda bulundu. DeFi ticaretindeki artış, AMM'lerin önemli miktarda likiditeyi yönetmeye devam etmesi ve kullanıcı karlarının artmasına yol açmasıyla Curve'ün sektördeki konumunu sağlamlaştırdı. Sonuç olarak Curve, getiri çiftçiliği ve likidite madenciliği yapanların yanı sıra nispeten istikrarlı ve oynak olmayan sabit paraları tutarken getirileri optimize etmek isteyen kişiler de dahil olmak üzere geniş bir DeFi katılımcı yelpazesine hitap ediyor. Platform, daha sonra likidite sağlayıcılarına ödüllendirilen mütevazı bir ücret uygulayarak gelir elde ediyor. Curve, akıllı sözleşmelere para yatırma ve Otomatik Piyasa Yapıcıları (AMM'ler) ile etkileşime girmeyle ilişkili tipik riskleri, özellikle de geçici kayıp riskini içerir. Curve'ün yalnızca sabit paralarla ilgilenmesi göz önüne alındığında, hızlı piyasa dalgalanmaları olasılığı azalır. Ancak, piyasalar çapraz piyasa fiyat ayarlamalarıyla uyumlu hale getirilmek üzere yeniden dengelemeye tabi tutulduğunda kullanıcılar yine de kayıplar yaşayabilir. Curve denetimlerden geçmiş olsa da, bu denetimlerin belirli bir kripto para birimine maruz kalmanın doğasında bulunan riskleri ortadan kaldırmadığını kabul etmek önemlidir. Curve (CRV), Ağustos 2020'de Curve DAO'in lansmanıyla aynı zamana denk gelecek şekilde piyasaya sürüldü. Birincil rolü, bir yönetim mekanizması olarak hizmet etmek, teşvikler sağlamak, ücret ödemelerini kolaylaştırmak ve likidite sağlayıcılarına uzun vadeli kazançlar için bir araç sunmaktır. CRV token'ın toplam arzı 3,03 milyara ulaşmış olup, çoğunluğu (%62) likidite sağlayıcılarına tahsis edilmiştir. Kalan token'lar şu şekilde dağıtılır: %30 hissedarlara, %3 çalışanlara ve %5 topluluk rezervine. Hem hissedar hem de çalışan tahsislerinin iki yıllık bir hak kazanma programına tabi olduğunu belirtmek önemlidir. CRV bir ön madencilikten geçmedi ve tokenların kademeli olarak açılması, ilk lansmandan bir yıl sonra yaklaşık 750 milyon tokenin dolaşımda olması gerektiğini gösteriyor. Curve'ün kurucusu ve CEO'su, kripto para birimiyle ilgili girişimlerde çeşitli deneyimlere sahip bir Rus bilim insanı olan Michael Egorov'dur. 2015 yılında, CTO rolünü üstlendiği NuCypher'ı kurdu. NuCypher, gizliliği koruyan altyapı ve protokoller geliştirmeye odaklanan bir kripto para birimi şirketidir. Egorov ayrıca, merkezi olmayan bir banka ve kredi ağı olan LoanCoin'in arkasındaki beyindir. Curve'ün çekirdek ekibi, CRV tahsis yapısına entegre edilmiştir ve bu da onlara ilk lansman planına göre iki yıllık bir hak kazanma süresi boyunca token alma hakkı verir. Ağustos 2020'de Egorov, yearn.finance'ın oy gücüne yanıt olarak önemli sayıda CRV token'ı kilitleyerek "aşırı tepki verdiğini" kabul etti ve bu süreçte yönetim kontrolünün %71'ini elde etti. Teknik Analiz: Gördüğümüz gibi, fiyat şu anda %78,6 ve %95'lik Fibonacci geri çekilme seviyeleriyle sınırlanmış bir aralıkta işlem görüyor. Özellikle, 0,15$'da potansiyel bir destek seviyesi var. Öngörülen yükseliş döngüleri için üç potansiyel fiyat hedefi belirledik: Birinci Hedef Fiyat (1TP): 6,75$ İkinci Hedef Fiyat (2TP): 8,5$ Üçüncü Hedef Fiyat (3TP): 11$ Grafikte Fibonacci geri çekilme seviyelerine karşılık gelen birden fazla direnç seviyesinin işaretlendiğini belirtmekte fayda var. Duygu Analizi: Kripto para birimlerinin toplam piyasa değerinde ve önümüzdeki aylarda Bitcoin (BTC) fiyatında değer kaybı olasılığı göz önüne alındığında, belirtilen destek seviyelerinde ve mevcut Fiyatta uzun pozisyonlar için Dolar Maliyet Ortalaması (DCA) stratejisinin kullanılmasının düşünülmesi makuldür.
BitonGroup
Synthetix / US Dollar (SNX/USDT) Token Analysis 11/09/2023

تحلیل بنیادی: Synthetix در حال ساخت یک پروتکل غیرمتمرکز تامین نقدینگی است که برای اهداف مختلف توسط هر پروتکلی قابل دسترسی است. نقدینگی قابل توجه و کارمزدهای حداقلی آن act به عنوان زیرساختی برای پروتکلهای هیجانانگیز متعدد در شبکههای Optimism و Ethereum عمل میکند. مجموعهای از پروتکلهای رو به کاربر در اکوسیستم Synthetix، مانند Kwenta (اسپات و فیوچرز)، Lyra (آپشنها)، Polynomial (آپشنهای خودکار)، و همچنین 1inch و Curve (تبادل اتمی)، از نقدینگی Synthetix برای توانمندسازی عملکردهای خود بهره میبرند. Synthetix بر روی پلتفرمهای Optimism و Ethereum mainnet توسعه یافته است. شبکه Synthetix توسط وثیقهای در قالب SNX، ETH و LUSD ایمن میشود که امکان ایجاد داراییهای مصنوعی به نام Synths را فراهم میکند. این Synths داراییهای پایه را تقلید کرده و بازدهی بر اساس آنها ایجاد میکنند، بدون اینکه نیازی به مالکیت مستقیم داراییها باشد. این وثیقهگذاری تجمیعشده، راه را برای انواع ابزارهای مالی زنجیرهای و قابل ترکیب که توسط نقدینگی حاصل از Synthetix پشتیبانی میشوند، هموار میکند. برخی از موردانتظارترین نسخههای آتی SNX شامل Perps V2 است که به دنبال فعال کردن معاملات آتی زنجیرهای مقرونبهصرفه با استفاده از اوراکلهای خارج از زنجیره است، و Synthetix V3 که برای بازسازی پروتکل مطابق با هدف اصلی آن یعنی تبدیل شدن به یک پروتکل مشتقات کاملاً بدون مجوز طراحی شده است. میتوانید اطلاعات بیشتری در مورد Synthetix در وبلاگ آنها یا با پیوستن به انجمن دیسکورد SNX پیدا کنید. ماموریت این پلتفرم گسترش قلمرو ارزهای دیجیتال با معرفی داراییهای غیر بلاکچین است و بدین ترتیب دسترسی به یک بازار مالی گستردهتر و قویتر را فراهم میکند. Synthetix به عنوان یک صرافی غیرمتمرکز (DEX) عمل میکند و به عنوان بستری برای داراییهای مصنوعی عمل میکند. معماری آن به گونهای طراحی شده است که از طریق Synths، دسترسی کاربران به داراییهای پایه را فراهم میکند و نیازی به نگهداری خود داراییها نیست. این پلتفرم به کاربران این امکان را میدهد که به طور مستقل Synths را معامله و مبادله کنند، در حالی که یک استخر استیکینگ نیز ارائه میدهد که دارندگان توکن SNX میتوانند توکنهای خود را استیک کرده و به صورت سهمی از کارمزدهای تراکنش از صرافی Synthetix پاداش دریافت کنند. برای ردیابی داراییهای پایه، Synthetix از پروتکلهای تحویل قیمت قرارداد هوشمند معروف به اوراکل استفاده میکند. این رویکرد تضمین میکند که کاربران میتوانند به طور یکپارچه Synths را بدون مواجهه با مشکلات نقدینگی یا لغزش معامله کنند و نیاز به واسطههای شخص ثالث را از بین میبرد. توکنهای SNX نقش مهمی به عنوان وثیقه برای ضرب داراییهای مصنوعی ایفا میکنند. هر زمان که Synths تولید میشوند، توکنهای SNX در یک قرارداد هوشمند قفل میشوند. این پروتکل از زمان آغاز به کار خود به Optimistic Ethereum mainnet منتقل شده است تا کارمزدهای gas را در شبکه کاهش داده و تأخیر اوراکل را کاهش دهد. توکن SNX با استاندارد ERC20 اتریوم سازگار است. شبکه Synthetix از طریق اجماع اثبات سهام (PoS) ایمن میشود. دارندگان Synthetix، SNX های خود را استیک میکنند و از کارمزدهای شبکه بازدهی کسب میکنند. یکی دیگر از راههای کسب پاداش برای استیککنندگان SNX از طریق سیاست پولی تورمی پروتکل، معروف به پاداشهای استیکینگ است. حداکثر عرضه SNX، 323,506,696 سکه است که از این تعداد 269,871,212 SNX تا سپتامبر 2023 در گردش است. در مراحل Seed Round و فروش توکن، Synthetix بیش از 60 میلیون توکن فروخت و توانست 30 میلیون دلار جمع آوری کند. از کل 100,000,000 سکه صادر شده در طول ICO، 20٪ به تیم و مشاوران، 3٪ به پاداشها و مشوقهای بازاریابی، 5٪ به مشوقهای مشارکت و 12٪ به بنیاد اختصاص یافت. این شبکه در ابتدا در سپتامبر 2017 توسط Kain Warwick تحت نام Havven (HAV) راه اندازی شد. تقریباً یک سال بعد، این شرکت تغییر نام داد و نام Synthetix را برگزید. Kain Warwick، بنیانگذار Synthetix، همچنین به عنوان مدیر غیر اجرایی در شبکه خرده فروشی blueshyft نیز فعالیت می کند. وارویک قبل از تاسیس Synthetix در چندین پروژه ارز دیجیتال دیگر نیز مشارکت داشته است. علاوه بر این، او بنیانگذار Pouncer، یک سایت auction زنده منحصر به فرد برای استرالیا است. پیتر مککیان، که به عنوان مدیرعامل پروژه فعالیت میکند، بیش از دو دهه تجربه در توسعه نرمافزار دارد. او قبل از حضور در Synthetix، به عنوان برنامهنویس در ICL Fujitsu کار میکرد. جردن ممتاز، مدیر ارشد عملیات Synthetix، با تخصص خود به عنوان یک استراتژیست تجاری، تحلیلگر بازار و رهبر فروش، با تجربه فراوان در بلاکچین، ارزهای دیجیتال، پرداختهای دیجیتال و سیستمهای تجارت الکترونیک، به تیم کمک میکند. جاستین جی موزز، مدیر ارشد فناوری، قبلاً به عنوان مدیر مهندسی در MongoDB و معاون رئیس مهندسی در Lab49 خدمت می کرد. او همچنین یکی از بنیانگذاران Pouncer است. تحلیل تکنیکال: همانطور که مشاهده می کنیم، قیمت از بالاترین سطح خود (ATH) به مبلغ 29 دلار کاهش یافته است و در حال حاضر در سطوح اصلاحی فیبوناچی 88.6٪ و 95٪ در نوسان است. در این محدوده، دو منطقه حمایت قیمتی قابل توجه در 0.8 دلار و 0.3 دلار وجود دارد. ما سه هدف قیمتی بالقوه را شناسایی کرده ایم: هدف قیمتی اول (1TP): 28.8 دلار هدف قیمتی دوم (2TP): 36.5 دلار هدف قیمتی سوم (3TP): 46.5 دلار علاوه بر این، می توانیم سطوح اصلاحی فیبوناچی major را به عنوان سطوح مقاومت بالقوه در نظر بگیریم که در نمودار نشان داده ایم. تحلیل احساسات: با در نظر گرفتن احتمال کاهش در کل ارزش بازار ارزهای دیجیتال و قیمت Bitcoin (BTC) در ماههای آینده، منطقی است که از استراتژی میانگین هزینه دلار (DCA) برای موقعیتهای لانگ در سطوح حمایتی مشخص شده استفاده شود.
Sorumluluk Reddi
Sahmeto'nun web sitesinde ve resmi iletişim kanallarında yer alan herhangi bir içerik ve materyal, kişisel görüşlerin ve analizlerin bir derlemesidir ve bağlayıcı değildir. Borsa ve kripto para piyasasına alım, satım, giriş veya çıkış için herhangi bir tavsiye oluşturmazlar. Ayrıca, web sitesinde ve kanallarda yer alan tüm haberler ve analizler, yalnızca resmi ve gayri resmi yerli ve yabancı kaynaklardan yeniden yayınlanan bilgilerdir ve söz konusu içeriğin kullanıcılarının materyallerin orijinalliğini ve doğruluğunu takip etmekten ve sağlamaktan sorumlu olduğu açıktır. Bu nedenle, sorumluluk reddedilirken, sermaye piyasası ve kripto para piyasasındaki herhangi bir karar verme, eylem ve olası kar ve zarar sorumluluğunun yatırımcıya ait olduğu beyan edilir.