
AAVE
آوی
| تریدر | نوع سیگنال | حد سود/ضرر | زمان انتشار | مشاهده پیام |
|---|---|---|---|---|
 ROBO416رتبه: 302 | خرید | حد سود: تعیین نشده حد ضرر: تعیین نشده | ۱۴۰۴/۹/۲۶ | |
خرید | حد سود: تعیین نشده حد ضرر: تعیین نشده | ۱۴۰۴/۱۰/۶ | ||
 leilizamanipourرتبه: 32452 | خرید | حد سود: تعیین نشده حد ضرر: تعیین نشده | ۱۴۰۴/۹/۹ |
نمودار قیمت آوی
سود ۳ ماهه :
خلاصه سیگنالهای آوی
سیگنالهای آوی
فیلتر
مرتب سازی پیام براساس
نوع پیام
نوع تریدر
فیلتر زمان

Maddox_Metrics
AAVE Short-term analysis | Trading and expectations

AAVE 🎯 قیمت از واگرایی صعودی روزانه RSI و پشتیبانی از Node با حجم بالا، یک شمع صعودی را چاپ کرد. در حال حاضر در حال آزمایش پیوت است. غلبه بر این امر اعتماد به نفس را به حرکت صعودی افزایش می دهد، با هدف اول 200EMA روزانه و مقاومت گره با حجم بالا در 220 دلار. غلبه بر 200EMA روزانه تلاقی را به پایین بودن major اضافه می کند. 📈 به نظر می رسد موج (C) موج مثلثی (D) در جریان است. RSI روزانه در EQ کانال می نشیند و به صورت صعودی عبور می کند. 👉 اگر موج (B) را زنده نگه داریم، اگر به زیر 148 دلار کاهش دهیم، تجزیه و تحلیل باطل می شود. Safe تجارت

Cryptojobs


tradecitypro
آینده AAVE در کجاست؟ راز حمایت کلیدی و سیگنال شروع صعود/نزول!

👋 به TradeCityPro خوش آمدید! در این تحلیل می سکه AAVE را برای شما بررسی کنم. یکی از پروژه های محبوب DeFi که با ارزش بازار 2.52 میلیارد دلار در CoinMarketCap در رتبه 36 قرار دارد. 🗓 بازه زمانی روزانه در بازه زمانی روزانه، AAVE پس از تثبیت در زیر منطقه 261.98، روند نزولی را آغاز کرد و با ساختار نزولی که داشت، تا سطح 144.61 سقوط کرد. 🎲 یک ناحیه حمایتی بین 144.61 و 157.43 وجود دارد که سکه در حال حاضر از آن پشتیبانی شده است و می تواند از این ناحیه به سمت بالا move خود را شروع کند. ✨ مقاومت اصلی که قیمت در حال حاضر با آن سروکار دارد 202.53 است و تا زمانی که قیمت بالاتر از آن تثبیت نشود، روند صعودی آغاز شد. 🎯 بنابراین، برای موقعیت خرید یا خرید نقطه ای، ماشه ای که روی این سکه داریم 202.53 است. ↗️ با این حال، اگر روند نزولی ادامه پیدا کند و یک بالاترین پایین تر زیر 202.53 تشکیل شود، می توانیم با شکست 144.61 یک موقعیت فروش باز کنیم. ⚡️ پشتیبانی بعدی که AAVE در حال حاضر دارد 124.79 است و قیمت ممکن است در مرحله نزولی بعدی به این منطقه کاهش یابد. 📝 افکار نهایی آرام بمانید، عاقلانه معامله کنید و بیایید از بهترین فرصت های بازار استفاده کنیم! این تحلیل منعکس کننده نظرات ما است و توصیه مالی نیست. نظرات خود را در نظرات به اشتراک بگذارید و فراموش نکنید که این تحلیل را با دوستان خود به اشتراک بگذارید! ❤️

karwanbk
پرچم گاوی در ارز دیجیتال AAVE: سیگنال ورود به قیمت ۱۶۴ و هدف ۱۷۶!

الگو: پرچم گاوی (الگوی ادامه دهنده) نقطه ورود: ۱۶۴ - ۱۶۵ هدف: ۱۷۶ حد ضرر: ۱۶۳

ObamaPump
#AAVE $AAVE

سفت شدن تثبیت - خروج از این محدوده می تواند باعث ایجاد حرکت شود.

mastercrypto2020
AVEEUSDT LONG SIGNAL
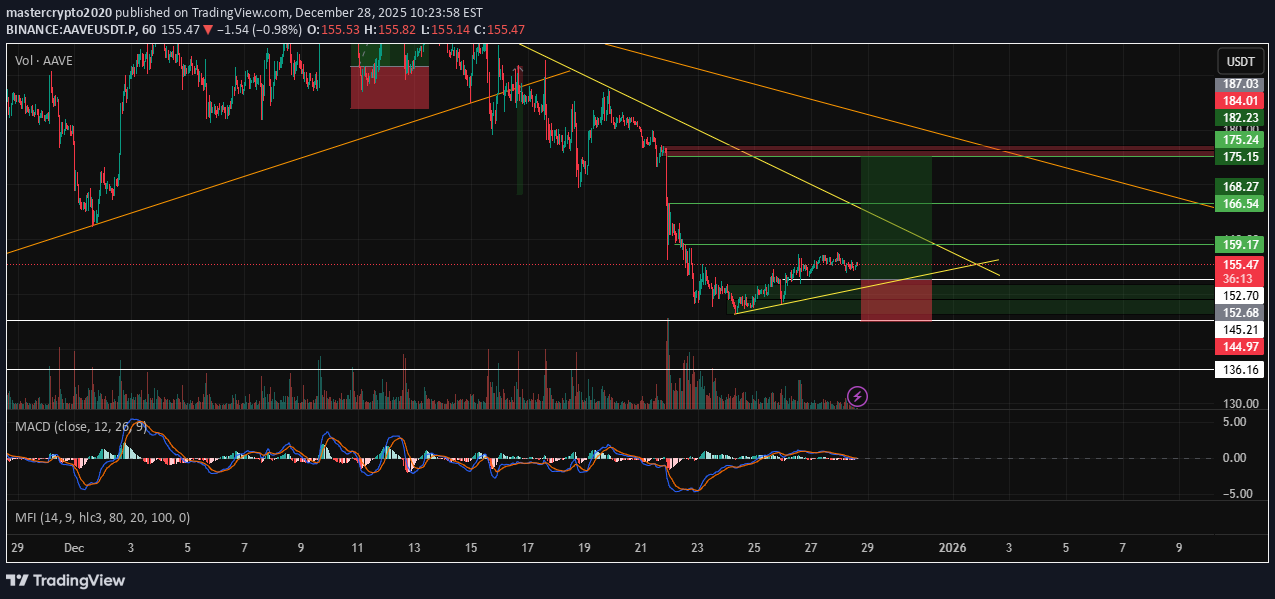
📊 تجزیه و تحلیل AAVE/USDT سوگیری: بازگشت صعودی (مقابل روند) منطقه ورودی: 152.7 - 155.2 توقف ضرر: 145 اهداف: TP1: 159.1 TP2: 166.5 TP3: 168.2 TP4: 175.1 اهرم: 3× – 5× نکات فنی: واکنش شدید از ناحیه تقاضا قیمت در حال تشکیل سطوح پایین تر تلاش برای شکست در بالای خط روند محلی حجم پس از فروش تثبیت شد بهبود حرکت در بازه زمانی پایین تر مدیریت تجارت: در TP1 سود جزئی بگیرید Move SL به Break-Even بعد از TP1 SL را به سمت اهداف بالاتر دنبال کنید #AAVEUSDT #AAVE #Crypto #TradingView #Altcoins
AAVE — Reaction From Higher-Timeframe Demand (As Anticipated)

AAVE از منطقه تقاضای بازه زمانی بالاتر که در اوایل این هفته مشخص شده بود، واکنش نشان می دهد، و قیمت دقیقاً همانطور که پیش بینی شده بود، منطقه را رعایت می کند. پس از یک عقب نشینی طولانی مدت، فشار فروش با ورود به تقاضا کاهش یافت. حرکت نزولی متوقف شد، فتیله ها جذب خود را نشان دادند و قیمت به جای کاهش بیشتر شروع به تثبیت کرد. این تایید می کند که خریداران همچنان در این منطقه فعال هستند. این یک سیگنال تغییر فوری روند نیست، بلکه یک واکنش تقاضای کتاب درسی است. تا زمانی که قیمت بالاتر از این ناحیه باقی بماند، احتمال به نفع تثبیت یا فشار تدریجی به سمت مقاومت بعدی است. از دست دادن خالص تقاضا، راه اندازی را باطل می کند و ریسک نزولی را دوباره باز می کند. یک بار دیگر، قبل از ساخت move بعدی، به ساختار احترام گذاشته شد.
AAVE/USDT – Reaction-Based Analysis (1H)

AAVE واکنش تمیز و از نظر فنی سالمی را پس از ورود به یک منطقه تقاضای کاملاً تعریف شده، ارائه کرد. قیمت در اولین نفوذ به شدت دفاع شد، و پس از آن یک جابجایی تند به سمت بالا رخ داد، که نشاندهنده خرید واکنشی قوی و نه صرفاً جذب منفعلانه بود. پس از این جهش شتابدار، AAVE به سمت یک تحکیم (کنسولیدیشن) کنترلشده در بالای سطح بازپسگرفتهشده حرکت کرد. این یک جزئیات کلیدی است. به جای توزیع فوری یا یک رد سریع، قیمت در حال حفظ شدن در بالای کفهای دامنه قبلی است، که نشاندهنده پذیرش و یک تغییر بالقوه در ساختار کوتاهمدت است. رفتار فعلی به نکات زیر اشاره دارد: - فروشندگان پس از تلاش برای شکست/بریکداون، کنترل را از دست میدهند - خریداران به طور قاطع در منطقه تقاضا وارد عمل میشوند - یک فاز فشردهسازی در حال شکلگیری بالاتر از منطقه واکنش است، که اغلب قبل از ادامه حرکت یا توسعه (اکسپنشن) مشاهده میشود تا زمانی که قیمت بالاتر از سطح بازپسگرفتهشده باقی بماند، واکنش صعودی معتبر ماند. از دست دادن این ناحیه، سِتاپ (تنظیمات) را باطل میکند و نشان میدهد که move صرفاً اصلاحی بوده است. به طور کلی، این یک مثال درسی از واکنش ← بازپسگیری ← حفظ (سطح) است، که اغلب مقدم بر حرکت جهتدار بعدی move میباشد. به محض اینکه محدوده فعلی حل شود، توسعه/گسترش محتمل است.
Cryptojobs
سقوط سنگین AAVE به زیر 145 دلار؟ منتظر ریزش 20 درصدی تا 110 دلار باشید!

AAVE ضربه TP2✅ منطقه سبز به عنوان پشتیبان عمل می کند، اما شکست کمتر از 145 دلار می تواند منجر به 20٪ + تخلیه شدید دیگر شود! به یاد داشته باشید --> سطح کلید بعدی حدود 114 - 110 دلار است! 🎯

Leo524
$AAVE Looks Weak… But History Says Something Else . ?

📌 AAVE اکنون در نزدیکی منطقه حمایت قوی 1 روزه همانطور که در نمودار مشخص شده است معامله می شود 📌 در تاریخ، قیمت پس از لمس همین منطقه پشتیبانی، دو بار واکنش نشان داده و پمپاژ کرده است 📌 اگر قیمت این حمایت را لمس کرد و حفظ کرد، میتوانیم انتظار یک جهش قوی را از اینجا داشته باشیم 📌 اهداف صعودی احتمالی پس از تایید عبارتند از 150 دلار، 180 دلار، 200 دلار، 250 دلار و 300 دلار + 📌نتیجه گیری نهایی: تا زمانی که منطقه حمایت 1 روزه باقی بماند، بازیابی صعودی امکان پذیر است 🔥 #AAVE #AAVEUSDT #رمز #CryptoTrading #آلت کوین #تحلیل فنی #PriceAction
سلب مسئولیت
هر محتوا و مطالب مندرج در سایت و کانالهای رسمی ارتباطی سهمتو، جمعبندی نظرات و تحلیلهای شخصی و غیر تعهد آور بوده و هیچگونه توصیهای مبنی بر خرید، فروش، ورود و یا خروج از بازارهای مالی نمی باشد. همچنین کلیه اخبار و تحلیلهای مندرج در سایت و کانالها، صرفا بازنشر اطلاعات از منابع رسمی و غیر رسمی داخلی و خارجی است و بدیهی است استفاده کنندگان محتوای مذکور، مسئول پیگیری و حصول اطمینان از اصالت و درستی مطالب هستند. از این رو ضمن سلب مسئولیت اعلام میدارد مسئولیت هرنوع تصمیم گیری و اقدام و سود و زیان احتمالی در بازار سرمایه و ارز دیجیتال، با شخص معامله گر است.