
CRV
کرو دائو توکن
| تریدر | نوع سیگنال | حد سود/ضرر | زمان انتشار | مشاهده پیام |
|---|---|---|---|---|
خرید | حد سود: تعیین نشده حد ضرر: تعیین نشده | ۱۴۰۴/۱۰/۵ | ||
خرید | حد سود: تعیین نشده حد ضرر: تعیین نشده | ۱۴۰۴/۱۰/۴ | ||
خرید | حد سود: تعیین نشده حد ضرر: تعیین نشده | ۱۴۰۴/۹/۲۳ | ||
خرید | حد سود: تعیین نشده حد ضرر: تعیین نشده | ۱۴۰۴/۹/۱۵ | ||
خرید | حد سود: تعیین نشده حد ضرر: تعیین نشده | ۱۴۰۴/۹/۱۱ |


نمودار قیمت کرو دائو توکن
سود ۳ ماهه :
خلاصه سیگنالهای کرو دائو توکن
سیگنالهای کرو دائو توکن
فیلتر
مرتب سازی پیام براساس
نوع پیام
نوع تریدر
فیلتر زمان

Professional Analysis of CRV/USDT Price Movement
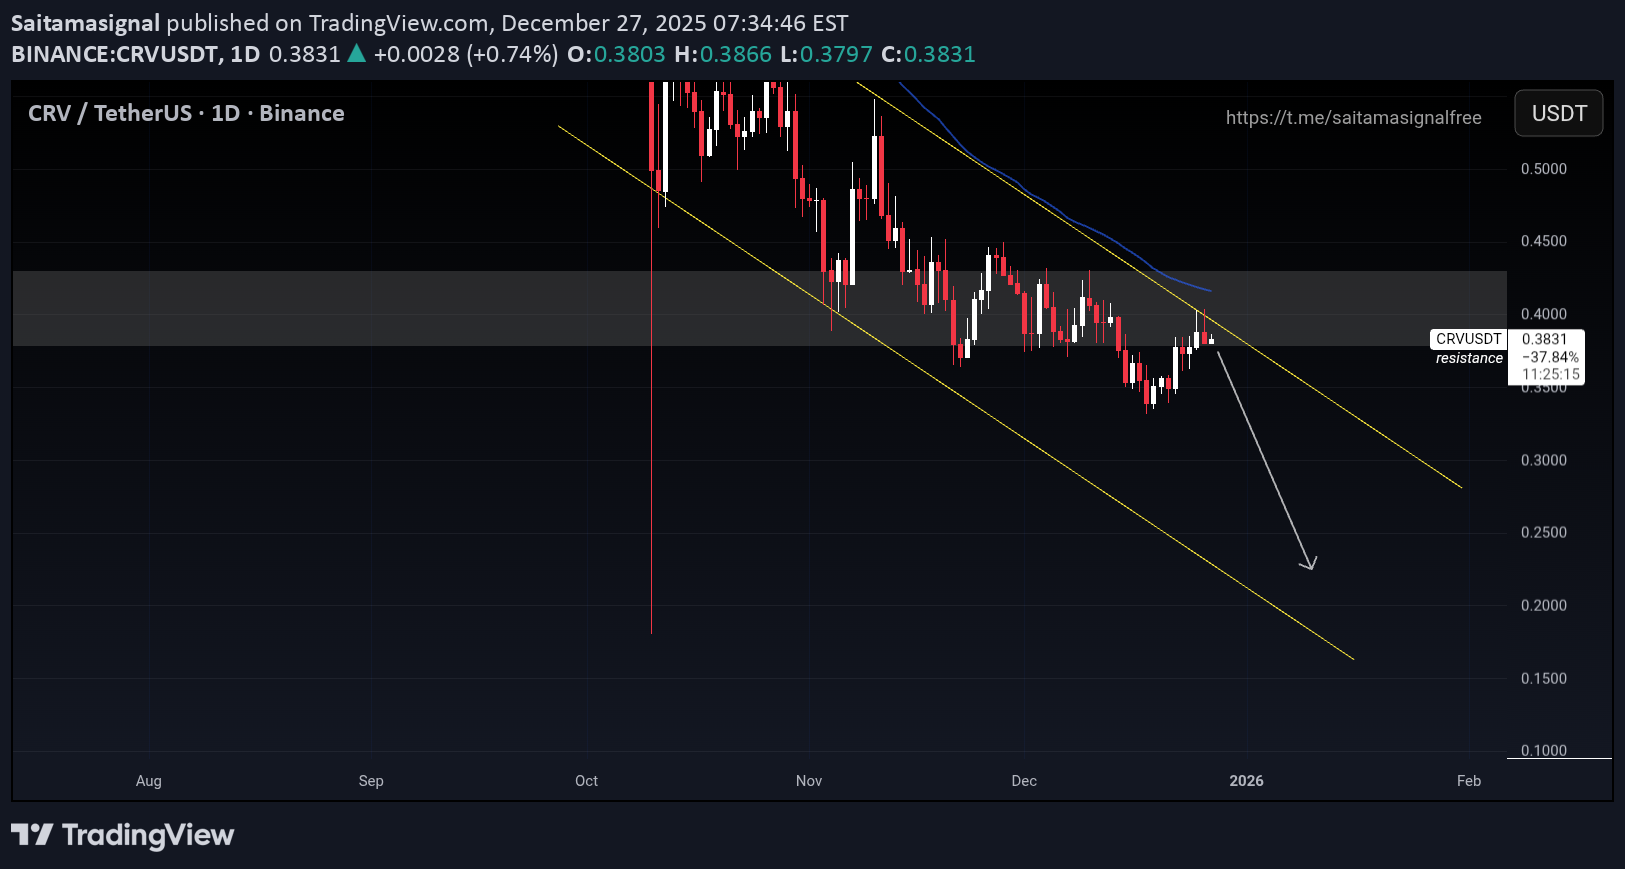
بر اساس نمودار روزانه CRV/TetherUS در بایننس، به نظر می رسد که این دارایی در یک روند نزولی آشکار است و تقریباً از اکتبر در یک کانال نزولی حرکت می کند. تحلیل فنی کلیدی روند بلندمدت: جفت ارز رمزنگاری در یک روند نزولی پایدار قرار دارد که با تشکیل اوج و پایینترین سطح در کانال قابل مشاهده قیمت در نمودار مشخص میشود. میانگین متحرک بلند مدت نیز نشان دهنده روند ضعیف یا نزولی است. سطح مقاومت کلیدی: قیمت فعلی حدود 0.3833 دلار است و به خط روند مقاومت بالای کانال نزدیک می شود. این منطقه بسیار مهم است. افزایش عرضه از سوی فروشندگان اغلب در سطوح مقاومت رخ میدهد و باعث میشود که افزایش قیمت متوقف شود. فرصت شکست: اگر CRV با موفقیت در بالای این خط روند مقاومت شکسته و حفظ شود، این یک سیگنال صعودی اولیه بود که نشاندهنده معکوس شدن روند کوتاهمدت بالقوه یا حداقل یک طرفی movement برای تثبیت است. اهداف صعودی بالقوه بعدی می تواند در مناطق نقدینگی بالاتر باشد، به عنوان مثال در اطراف سطوح قیمت قبلی یا مقاومت قابل توجه بعدی. اهمیت تأیید: معاملهگران حرفهای قبل از گرفتن پوزیشنهای خرید قابل توجه منتظر تأیید واضح (مانند بستن شمع روزانه بالاتر از سطح مقاومت یا آزمایش مجدد موفقیتآمیز پشتیبانی جدید در حین عقبنشینی) بود، زیرا بازار ارزهای دیجیتال به نوسانات بالا معروف است.
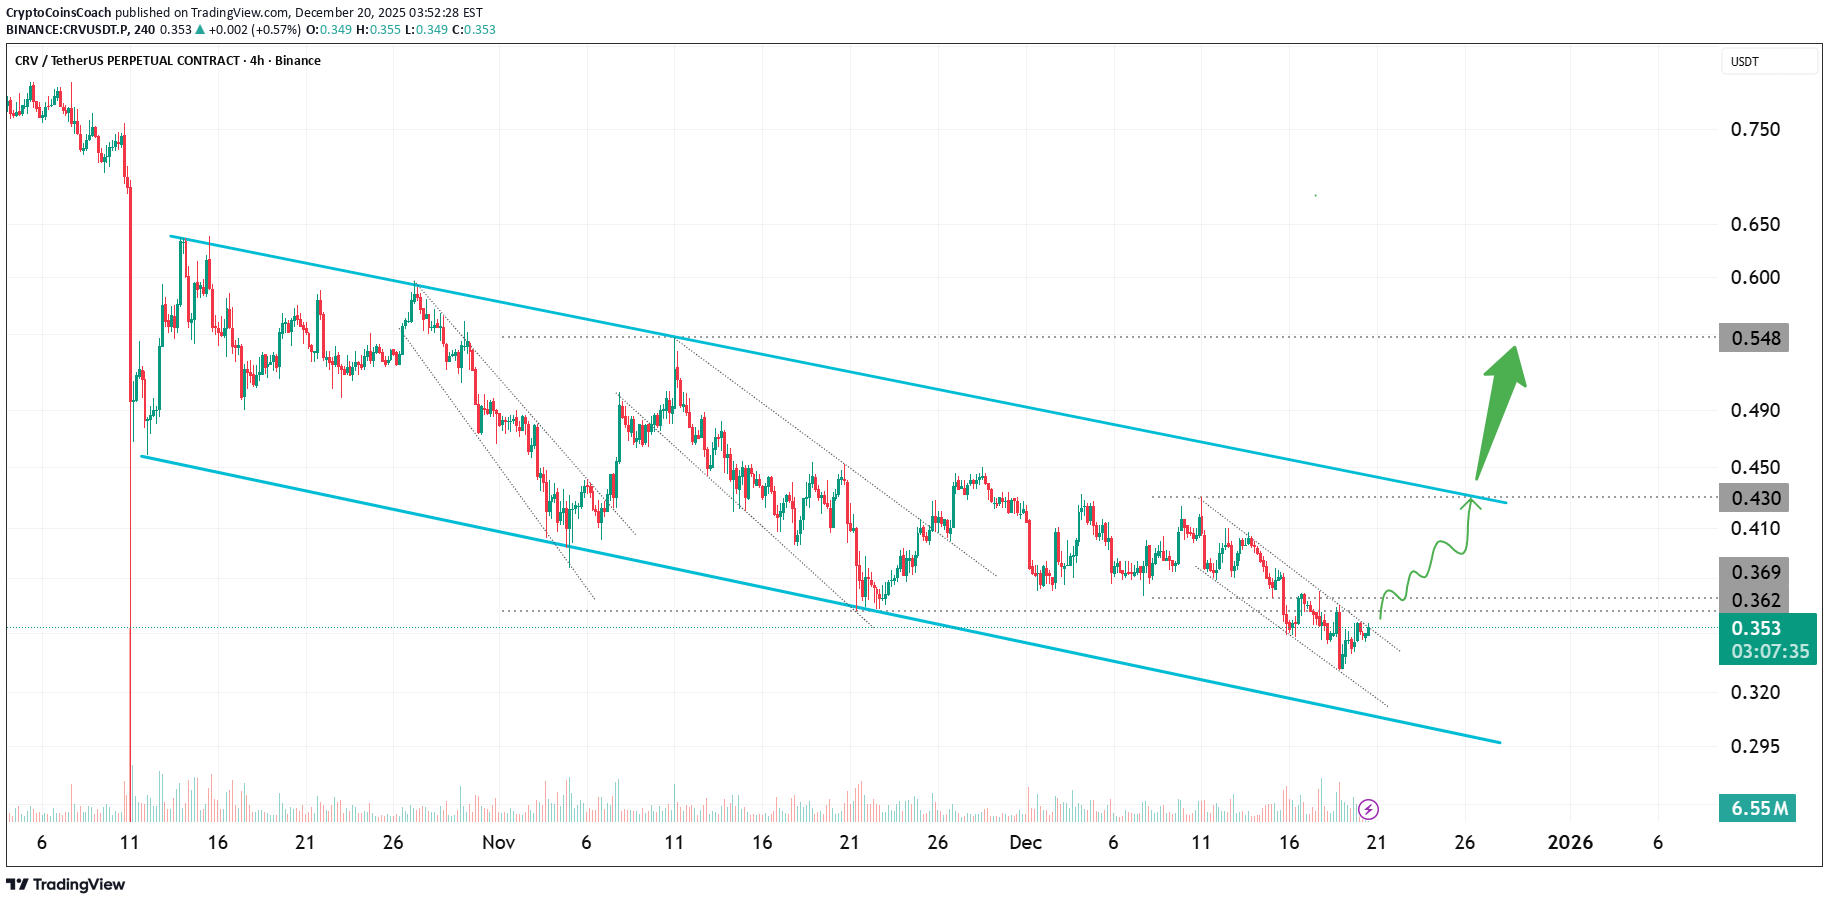
CRVUSDT BREAKOUT
پس از شکست خط روند نزولی، موقعیت خرید را باز کرد. قیمت در بالای منطقه شکست باقی می ماند. 🎯 هدف: 0.430 🛡️ باطل شدن: 4 ساعت به عقب در زیر خط روند / منطقه پشتیبانی نزدیک شوید. تجارت بر اساس شکست خط روند + تأیید پشتیبانی است. مدیریت ریسک بر این اساس #CRV #CRVUSDT #Long #CryptoTrade #Altcoins
تحلیل فوری CRV: فرصت خرید بعد از شکست خط روند!
غواصی Bearidh در 15 دقیقه شکست خط روند و تست مجدد در rsi قابل امتحان است
$CRV X= mrprofessoreXBT
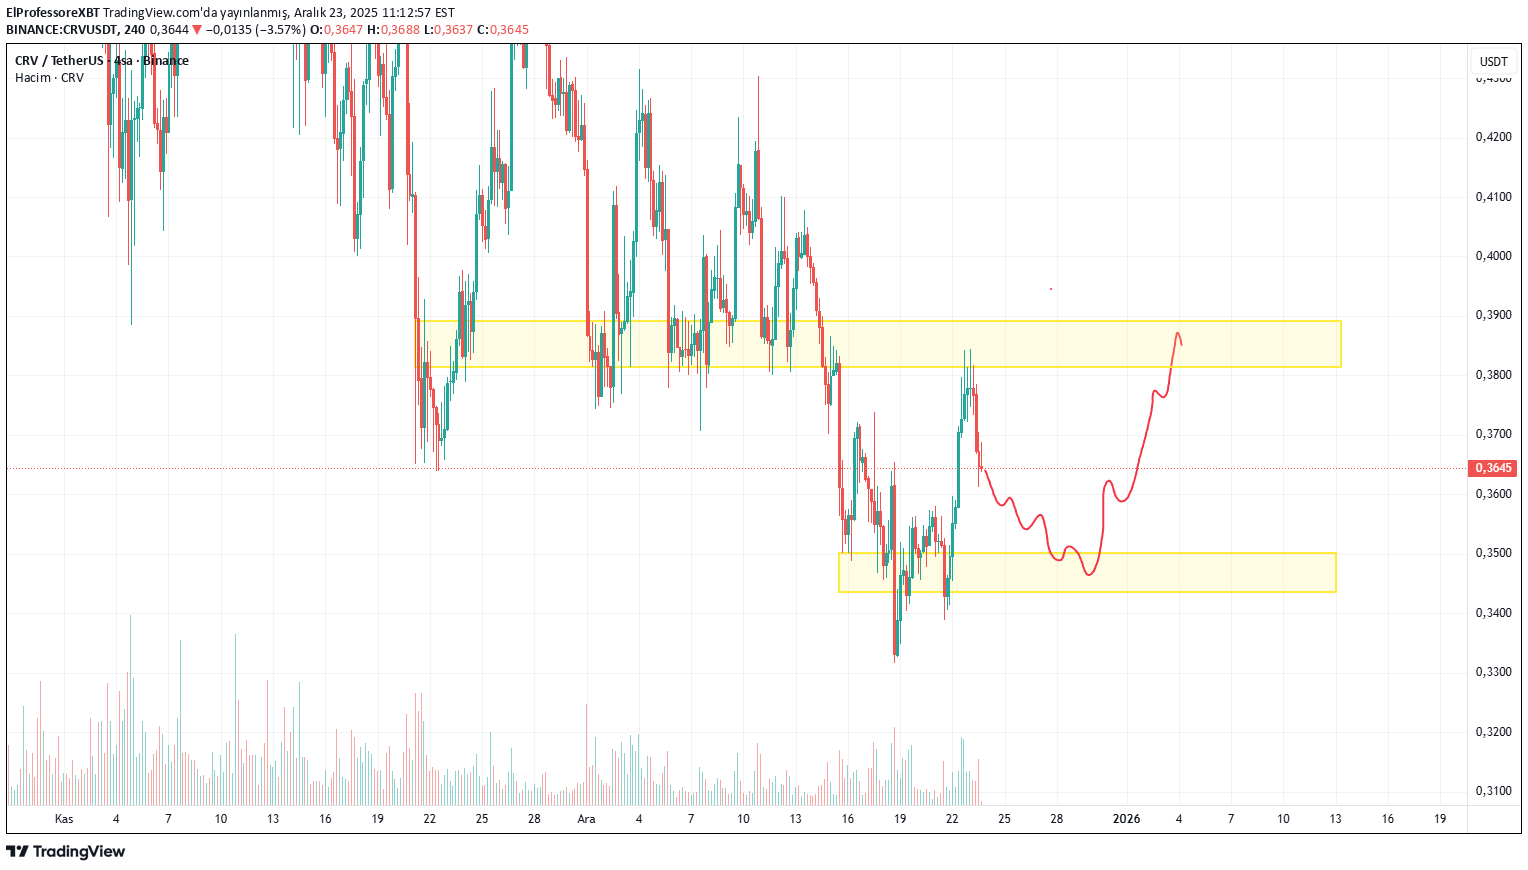
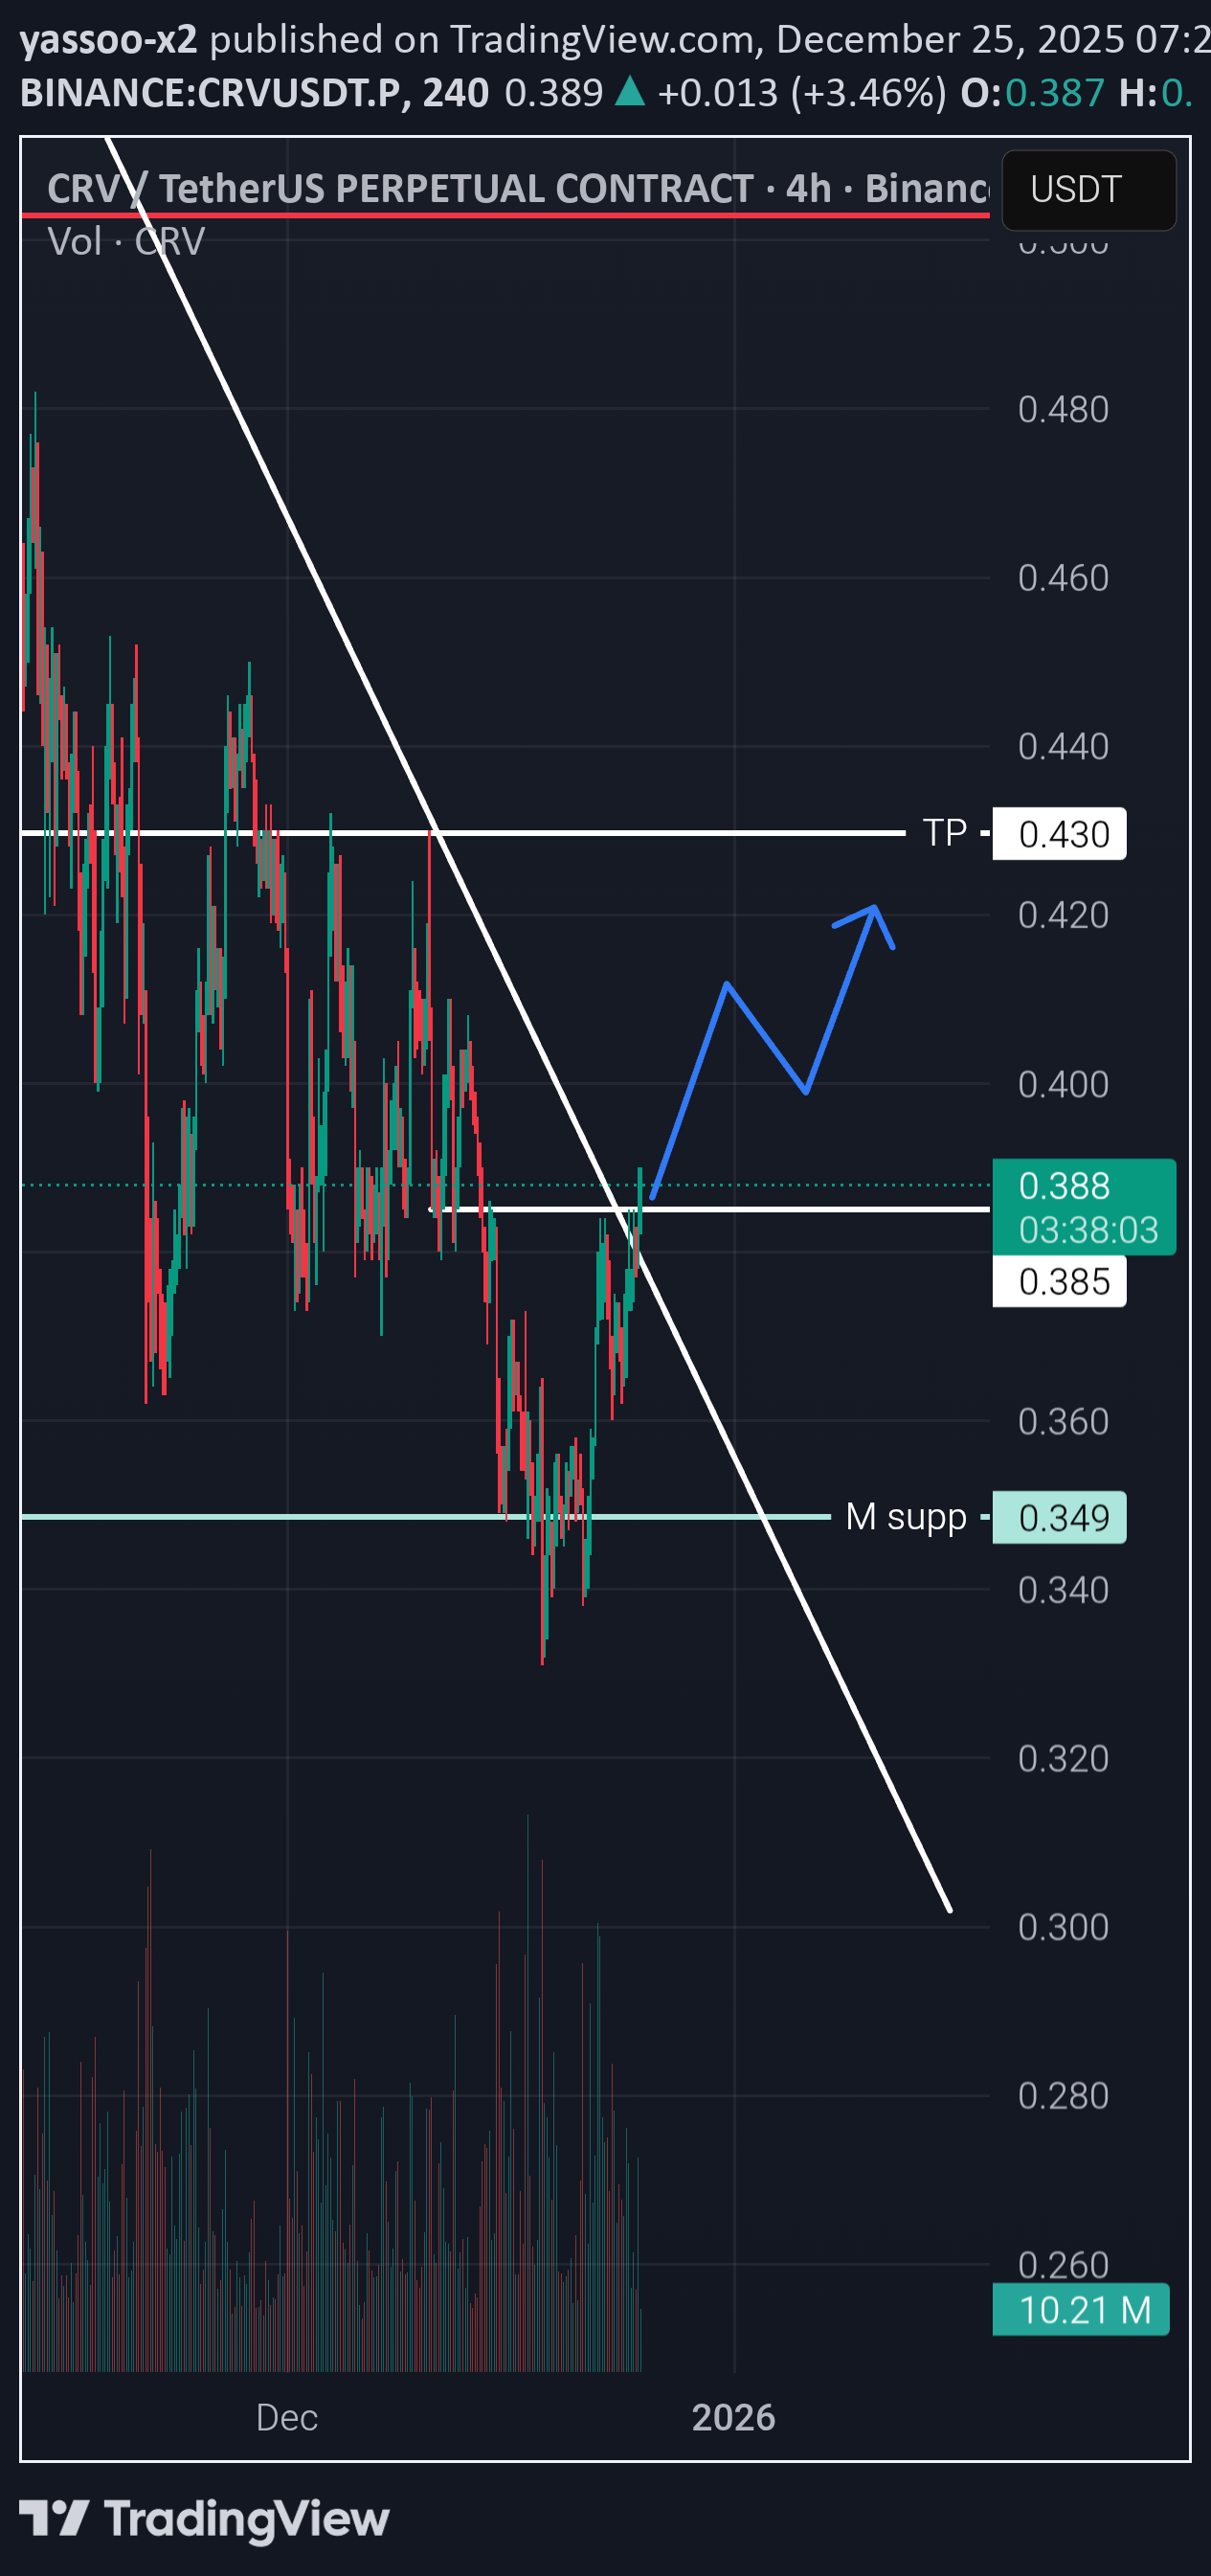
قیمت در حال حاضر در داخل یک منطقه تقاضای کاملاً تعریف شده در حال تثبیت است، که قبلاً ثابت شده است که یک منطقه واکنش قوی در گذشته است. پس از فروش شدید، حرکت نزولی به وضوح در حال از دست دادن قدرت خود است و بازار اکنون به جای ادامه روند کاهشی، در حال شکل گیری یک ساختار پایه است. تا زمانی که این ناحیه حمایتی پایینتر پابرجا باشد، انتظار دارم ابتدا تثبیت دامنه، و سپس یک فشار تدریجی به سمت منطقه عرضه بالا باشد. پیشبینی شده move نشاندهنده یک پا بالقوه بهبودی است، با تشکیل پایینهای بالاتر در داخل محدوده - یک نشانه معمولی از تجمع. یک شکست تمیز و نگه داشتن بالاتر از سطح متوسط احتمالاً در را برای یک move به سمت ناحیه مقاومت بالایی باز می کند، جایی که فروشندگان ممکن است دوباره وارد عمل شوند. تا زمانی که این اتفاق نیفتد، این یک سناریوی صعودی مبتنی بر حمایت باقی می ماند که تنها در صورتی باطل می شود که قیمت منطقه تقاضا را با حجم قوی از دست بدهد. صبر در اینجا کلیدی است - ساختار سازنده به نظر می رسد تا زمانی که حمایت رعایت شود.
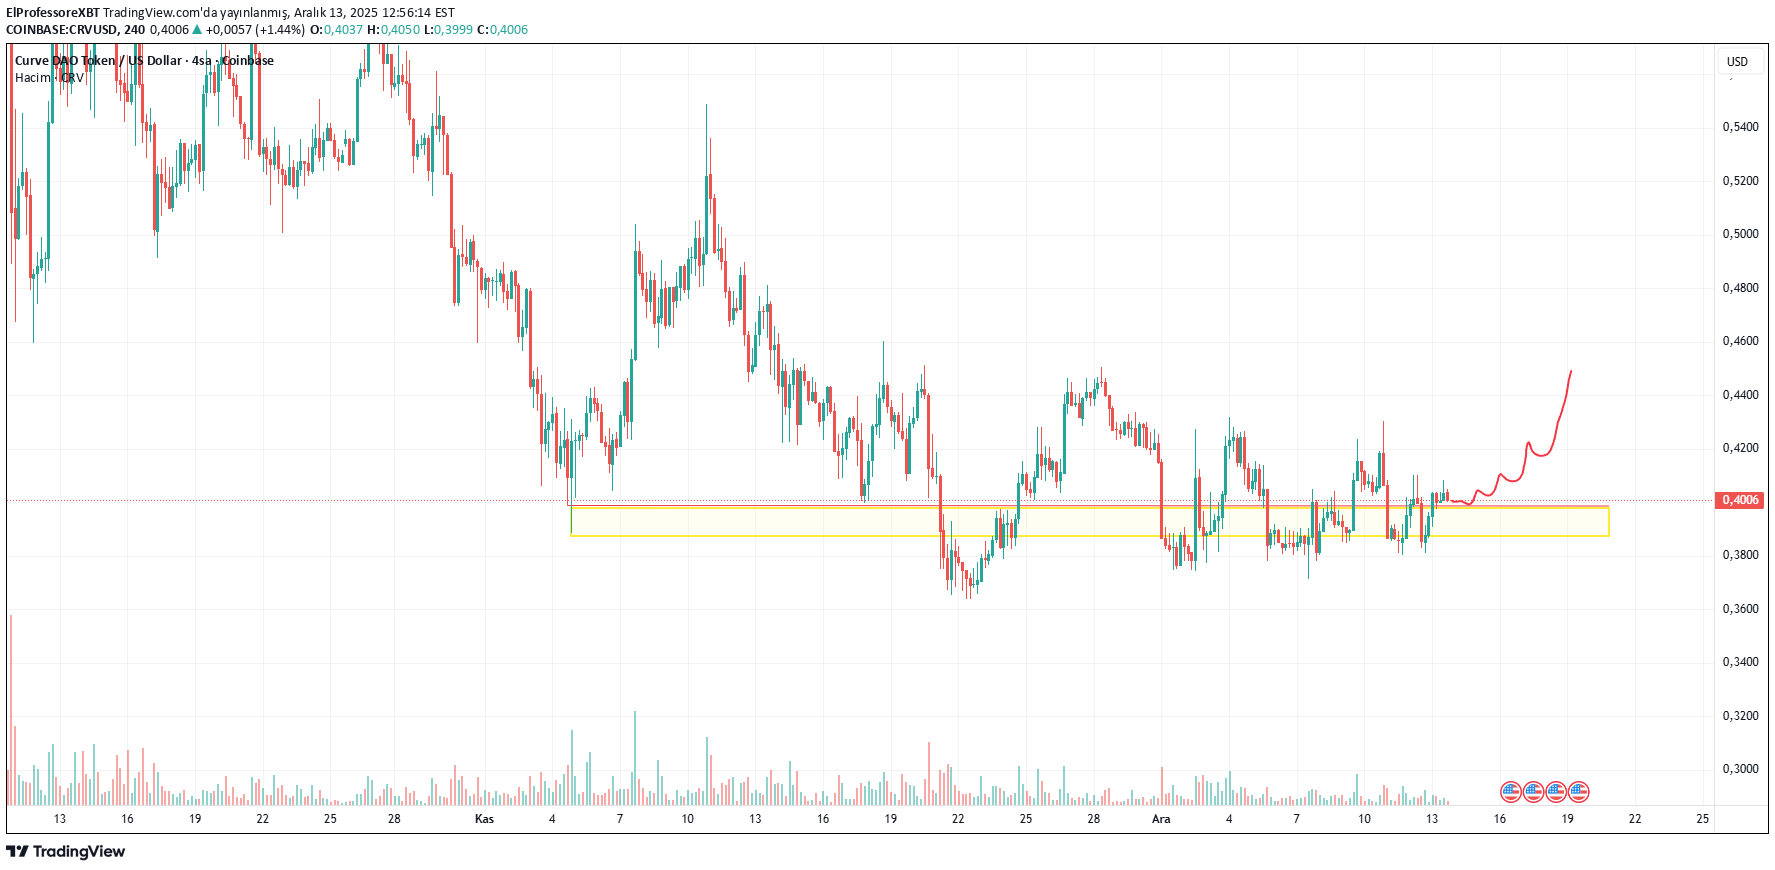
CRV Holding Descending Channel Support, Relief Move Possible
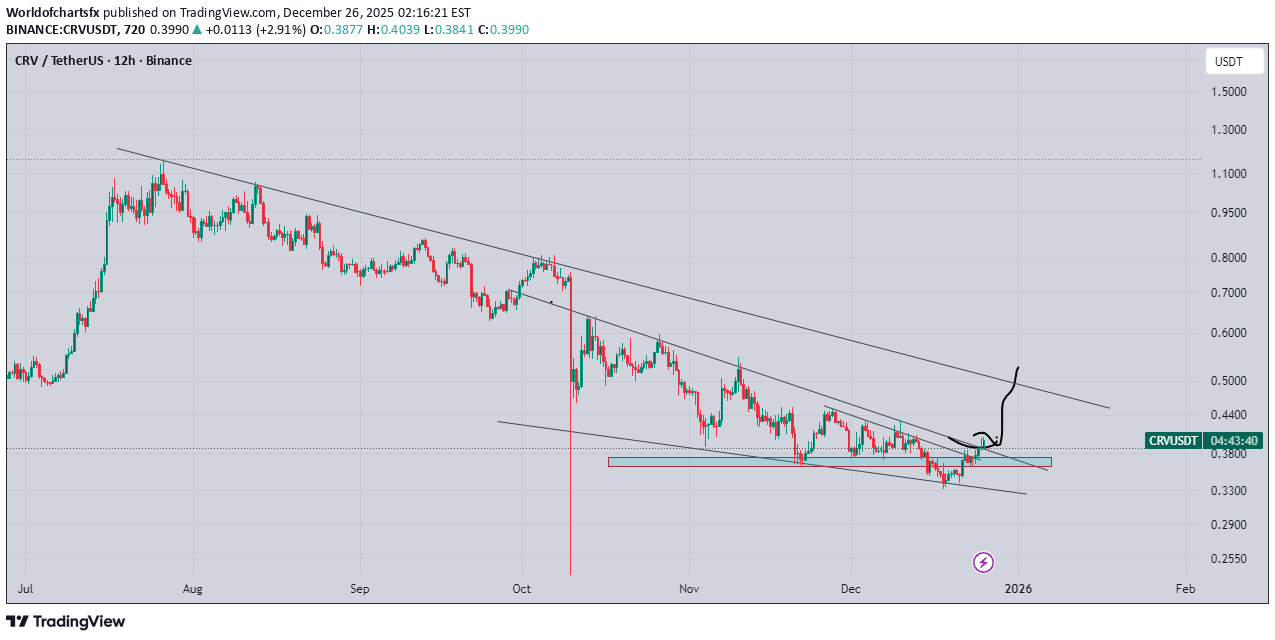
این دارایی برای مدتی طولانی در داخل یک کانال نزولی خوشتعریف معامله شده است که این امر منعکسکننده تسلط مستمر فروشندگان است. قیمت اخیراً به مرز پایینتر این کانال رسید و اکنون نشانههایی از تثبیت را نشان میدهد که حاکی از کند شدن فشار فروش نزدیک حمایت کلیدی است. ساختار فعلی نشان میدهد که قیمت پس از واکنش به کف کانال، در تلاش برای تشکیل کفهای بالاتری است. اگر قیمت به حفظ خود بالای این مرز پایینی ادامه دهد و پذیرش بازار را به دست آورد، یک رالی تسکینی به سمت مقاومت بالایی کانال امکانپذیر میشود. اولین ناحیه کلیدی صعودی در نزدیکی منطقه رد شدن قبلی، حوالی ۰.۳ (صفر ممیز سه دهم) قرار دارد، و پس از آن در صورت تقویت مومنتوم، مقاومت بالاتر در نزدیکی ۰.۵۵ (صفر ممیز پنجاه و پنج صدم) وجود داشت. در سمت نزولی، یک شکست واضح در زیر حمایت کانال، سناریوی صعود اصلاحی را باطل کرده و مسیر ادامه نزول را به سمت مناطق تقاضای پایینتر بازگشایی میکند. این سناریو مبتنی بر دینامیک کانال نزولی، رفتار واکنش به حمایت و تثبیت ساختار کوتاهمدت است. تأیید از طریق حفظ پایدار قیمت بالای حمایت، قبل از انتظار برای ادامه حرکت صعودی، ضروری است.
CRV/USDT: آیا این آلتکوین آماده انفجار است؟ تحلیل تخصصی حرکت نهنگها!
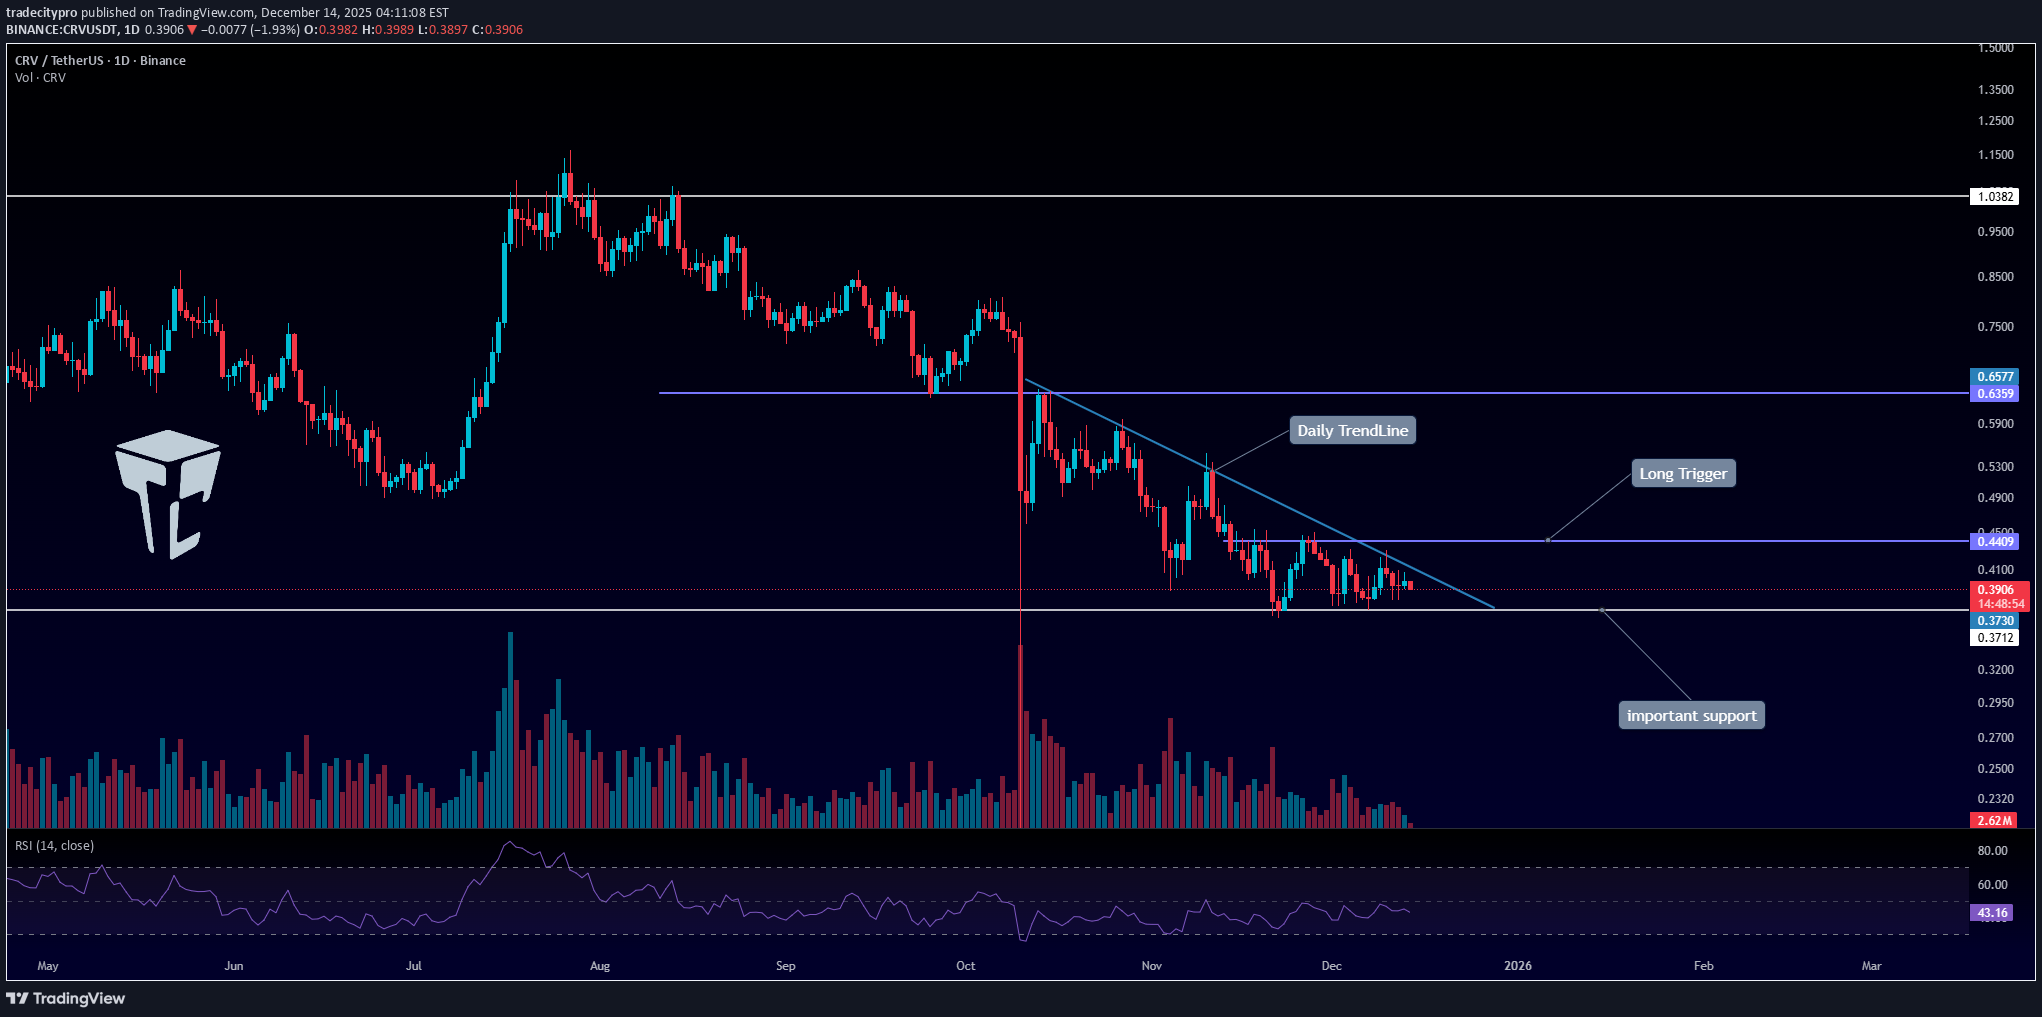
👋 به TradeCityPro خوش آمدید! بیایید تمرکز کنیم روی ارز مورد علاقه نهنگهای امروز، CRV، که به طور گسترده توسط نهنگها برای رأیگیریهای حاکمیتی (Governance voting) و مشارکت در فرآیندهای کلیدی تصمیمگیری استفاده میشود. 🌐 نمای کلی بازار قبل از شروع، اجازه دهید یک بار دیگر یادآوری کنم که بنا به درخواست شما، ما بخش تحلیل کلان بازار را به یک گزارش روزانه اختصاصی منتقل کردهایم — که به ما این امکان را میدهد تا روند بیتکوین، دامیننس (سلطه) و احساسات کلی بازار را هر روز با عمق بیشتری تجزیه و تحلیل کنیم. در تایم فریم روزانه، پس از ریجکت شدن از ۱.۰۳ دلار، شاهد یک حرکت اصلاحی بودیم و قیمت به آرامی روی حمایت ۰.۶۳۵۹ دلار تثبیت شد. پس از شکستن این حمایت، قیمت به سمت حمایت ۰.۳۷۱۲ دلار حرکت کرد و ما در حال حاضر در حال تشکیل سقفهای پایینتر (Lower Highs) هستیم که منجر به تشکیل یک خط روند از نوع بازگشتی شده است. برای موقعیتهای خرید (لانگ)، اگر خط روند روزانه شکسته شود و تریگر ۰.۴۴۰۹ دلار فعال شود، میتوانیم به دنبال باز کردن پوزیشن خرید در شکست این سطح باشیم. برای موقعیتهای فروش (شورت)، تریگرهای ورود ما به وضوح در نمودار مشخص شدهاند. با شکست زیر ۰.۳۷۳۰ دلار، میتوانیم پوزیشن فروش باز کنیم، و یک ریجکت شدن از خط روند نیز میتواند یک تریگر زودهنگام فروش را فراهم کند. 📝 جمعبندی آرام باشید، هوشمندانه ترید کنید و بیایید بهترین فرصتهای بازار را شکار کنیم! این تحلیل صرفاً منعکسکننده نظرات ماست و به منزله مشاوره مالی نیست. نظرات خود را در بخش کامنتها به اشتراک بگذارید و فراموش نکنید این تحلیل را با دوستان خود نیز به اشتراک بگذارید! ❤️
$CRV
CRV پس از یک ادغام طولانی مدت، کاملاً بالای یک منطقه تقاضای کاملاً تعریف شده باقی می ماند. قیمت در حال ایجاد یک پایه با پایین ترین سطح است که نشان دهنده انباشتگی است. شکست تایید شده بالاتر از محدوده می تواند حرکتی move را به سمت سطوح مقاومت بالا ایجاد کند. تا زمانی که حمایت برقرار باشد، سوگیری صعودی باقی می ماند.

#CRV/USDT breakout alert!
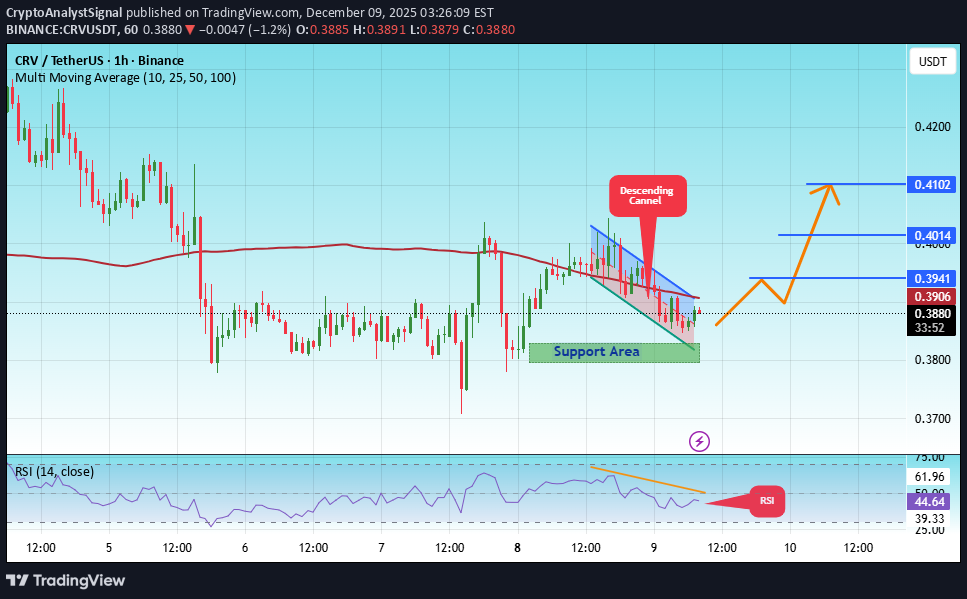
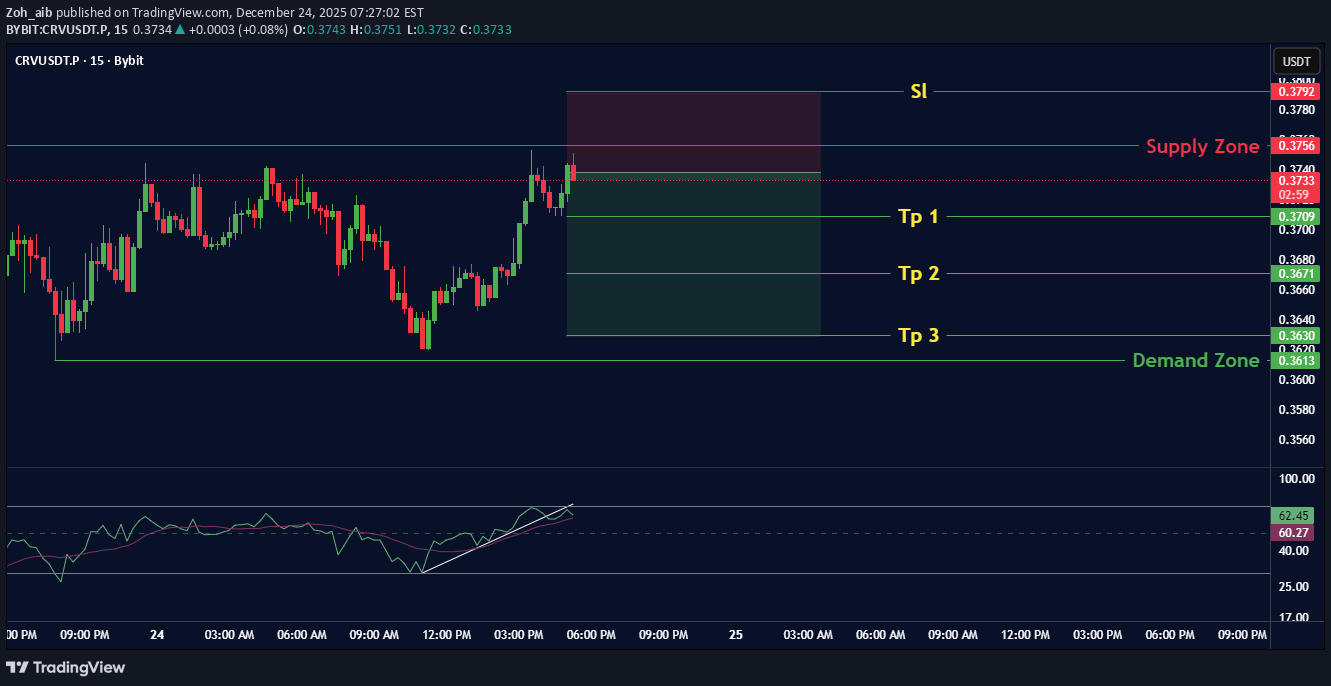
قیمت در تایمفریم ۱ ساعته در حال حرکت در یک کانال نزولی است. این قیمت به مرز پایینی رسیده و در حال حرکت به سمت شکستن آن به سمت بالا میباشد، و انتظار میرود تست مجدد (پولبک) به مرز بالایی انجام شود. در اندیکاتور RSI یک روند نزولی مشاهده میشود که نزدیک به مرز پایینی رسیده است و انتظار یک بازگشت صعودی میرود. یک منطقه حمایتی کلیدی (سبز رنگ) در 0.3800 وجود دارد. قیمت چندین بار از این سطح جهش کرده و انتظار میرود دوباره از آن بازگردد. ما تمایل به تثبیت بالای میانگین متحرک ۱۰۰ دورهای داریم، زیرا در نزدیکی آن حرکت میکنیم، که این موضوع از روند صعودی حمایت میکند. قیمت ورود: 0.3880 هدف اول: 0.3941 هدف دوم: 0.4014 هدف سوم: 0.4100 اصل ساده مدیریت سرمایه را فراموش نکنید. حد ضرر خود را زیر منطقه حمایتی (سبز رنگ) قرار دهید. برای هرگونه سوال، لطفاً یک کامنت بگذارید. متشکرم.
#CRV/USDT breakout alert!
قیمت در تایم فریم ۱ ساعته در یک کانال نزولی در حال حرکت است. این قیمت به مرز پایینی رسیده و در حال حرکت به سمت شکستن آن به بالا میباشد، و انتظار میرود که پولبکی به مرز بالایی صورت گیرد. در اندیکاتور RSI شاهد یک روند نزولی هستیم که اکنون به نزدیکی مرز پایین رسیده و انتظار میرود یک بازگشت صعودی رخ دهد. یک منطقه حمایتی کلیدی (به رنگ سبز) در سطح ۰.۳۸۰۰ قرار دارد. قیمت چندین بار از این سطح بازگشت کرده و انتظار میرود دوباره شاهد بازگشت قیمت از این نقطه باشیم. ما تمایل به تثبیت قیمت بالاتر از میانگین متحرک ۱۰۰ دورهای داریم، زیرا قیمت در نزدیکی آن در حال نوسان است، که این موضوع از حرکت صعودی حمایت میکند. قیمت ورود: ۰.۳۸۸۰ تارگت اول: ۰.۳۹۴۱ تارگت دوم: ۰.۴۰۱۴ تارگت سوم: ۰.۴۱۰۰ یک اصل ساده را فراموش نکنید: مدیریت سرمایه. حد ضرر خود را زیر منطقه حمایتی سبز رنگ قرار دهید. برای هرگونه سؤال، لطفاً کامنت بگذارید. متشکرم.
سلب مسئولیت
هر محتوا و مطالب مندرج در سایت و کانالهای رسمی ارتباطی سهمتو، جمعبندی نظرات و تحلیلهای شخصی و غیر تعهد آور بوده و هیچگونه توصیهای مبنی بر خرید، فروش، ورود و یا خروج از بازارهای مالی نمی باشد. همچنین کلیه اخبار و تحلیلهای مندرج در سایت و کانالها، صرفا بازنشر اطلاعات از منابع رسمی و غیر رسمی داخلی و خارجی است و بدیهی است استفاده کنندگان محتوای مذکور، مسئول پیگیری و حصول اطمینان از اصالت و درستی مطالب هستند. از این رو ضمن سلب مسئولیت اعلام میدارد مسئولیت هرنوع تصمیم گیری و اقدام و سود و زیان احتمالی در بازار سرمایه و ارز دیجیتال، با شخص معامله گر است.