
AVAX
اولانچ
| تریدر | نوع سیگنال | حد سود/ضرر | زمان انتشار | مشاهده پیام |
|---|---|---|---|---|
 SwallowAcademyرتبه: 3533 | خرید | حد سود: تعیین نشده حد ضرر: تعیین نشده | ۱۴۰۴/۸/۲۷ | |
 DAY11رتبه: 33667 | خرید | حد سود: تعیین نشده حد ضرر: تعیین نشده | ۱۴۰۴/۸/۳۰ | |
 BandForBandsرتبه: 34849 | خرید | حد سود: تعیین نشده حد ضرر: تعیین نشده | ۱۴۰۴/۸/۲۳ | |
خرید | حد سود: تعیین نشده حد ضرر: تعیین نشده | ۱۴۰۴/۹/۱ | ||
خرید | حد سود: تعیین نشده حد ضرر: تعیین نشده | ۱۴۰۴/۸/۲۸ |


نمودار قیمت اولانچ
سود ۳ ماهه :
خلاصه سیگنالهای اولانچ
سیگنالهای اولانچ
فیلتر
مرتب سازی پیام براساس
نوع پیام
نوع تریدر
فیلتر زمان

Bilge_Kagan_Bakircioglu
تحلیل هفتگی آوالانچ (AVAX/USDT): سیگنال جذاب فنی اما یک نگرانی بزرگ!
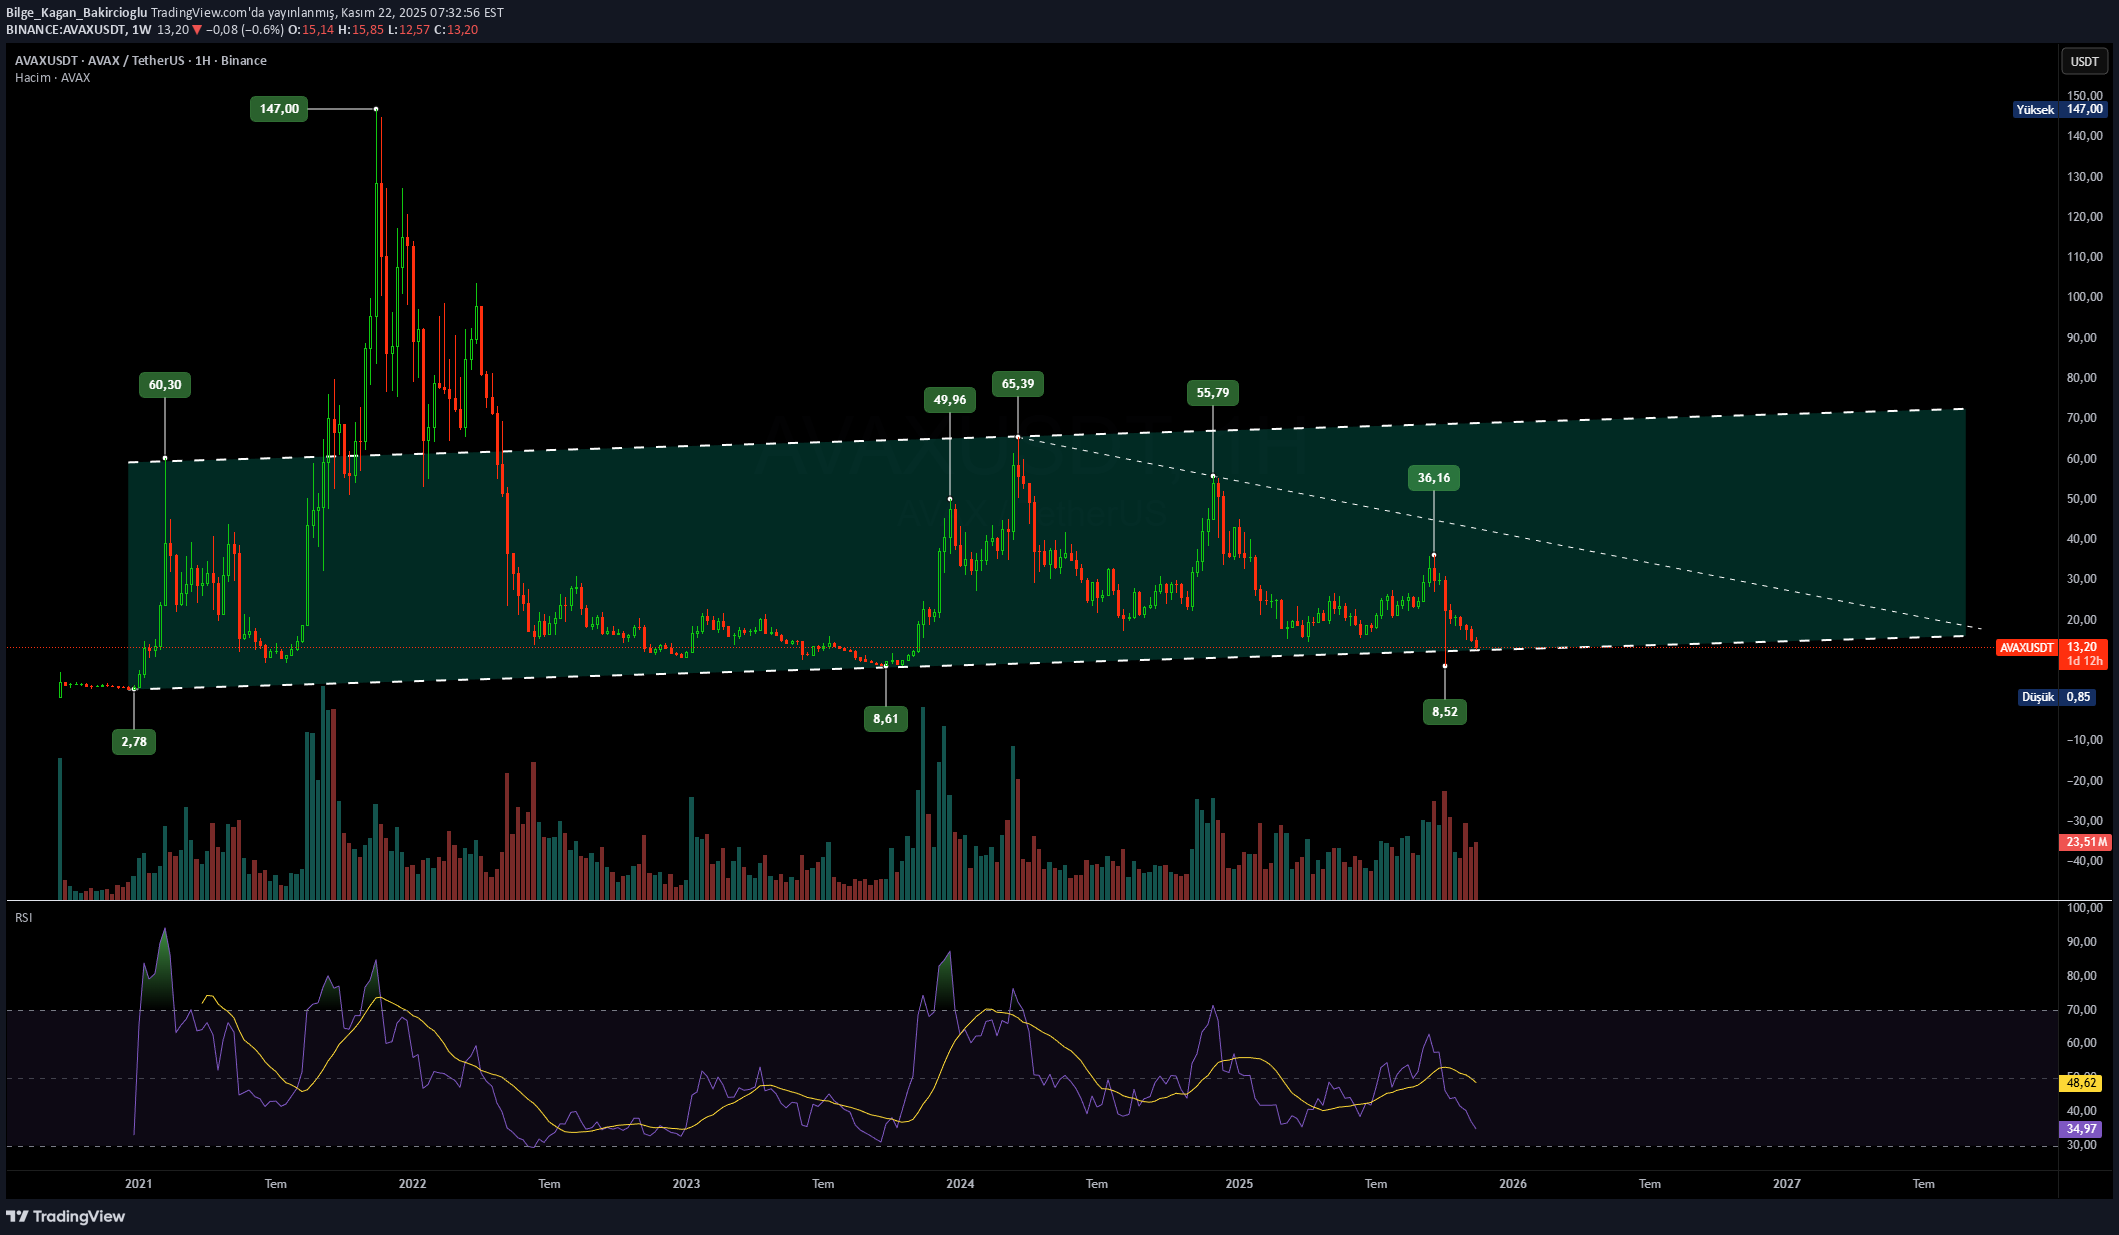
AVAXUSDT، نمودار هفتگی. از لحاظ تکنیکال، به قدری عالی و جذاب به نظر میرسد، اما ای کاش یک کوینِ alt نبود.

persis10t
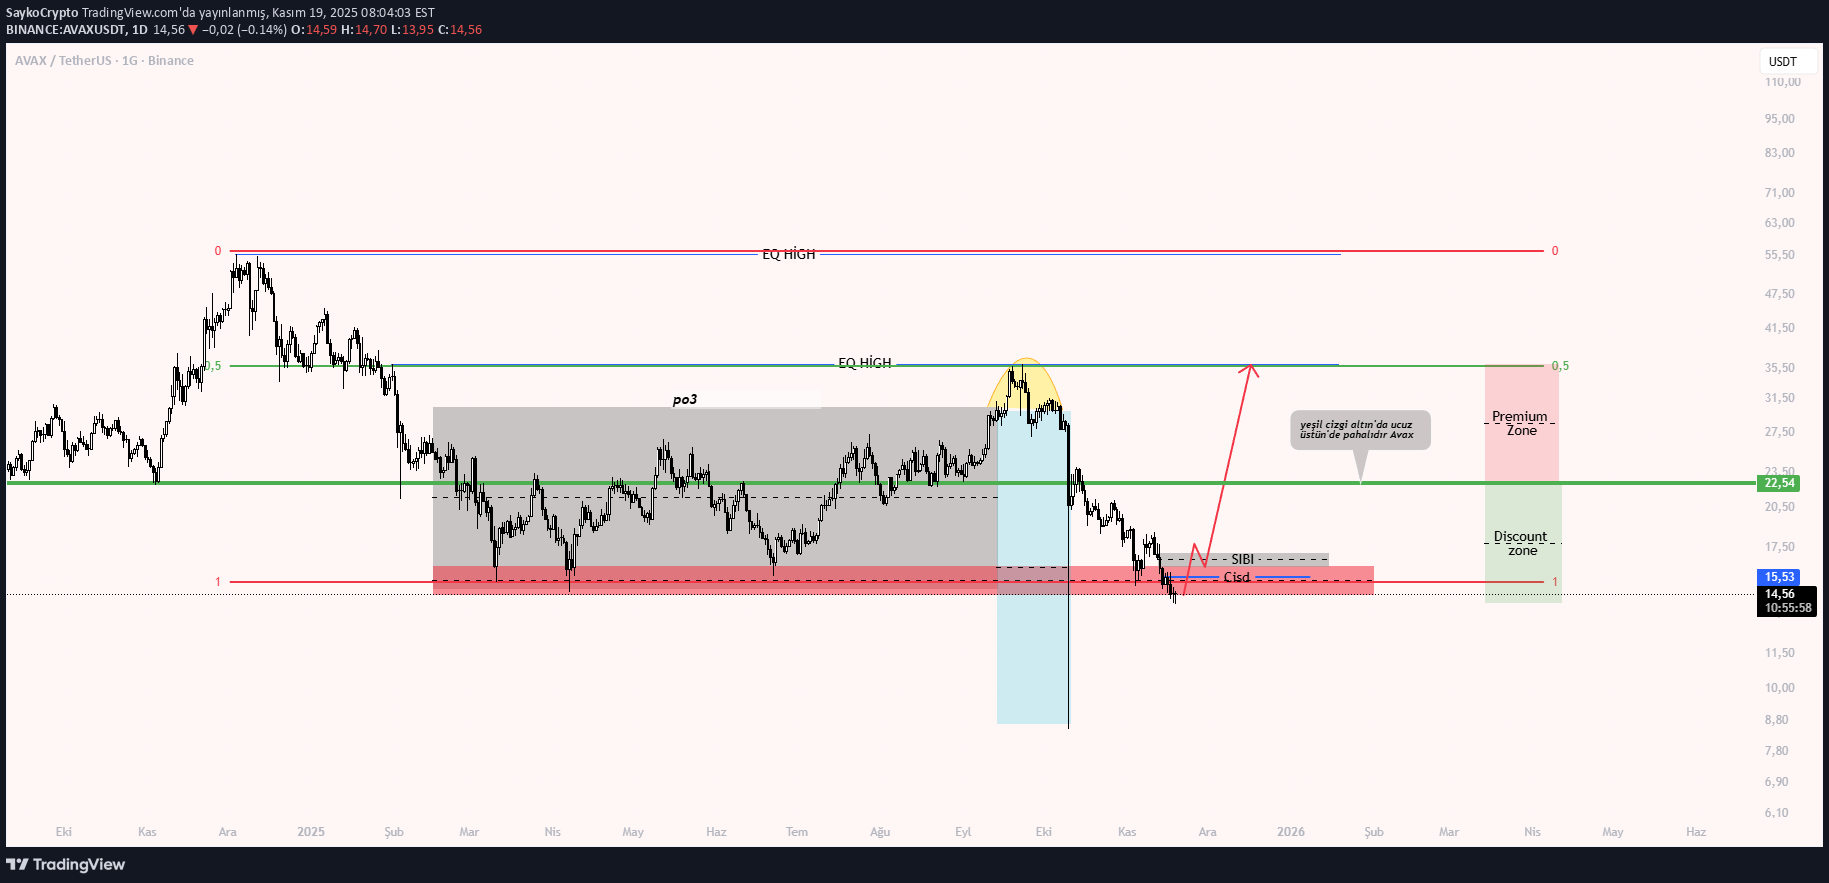
آوالانچ (AVAX) در نقطه حیاتی: آیا این حمایت چندساله نجاتبخش خواهد بود؟
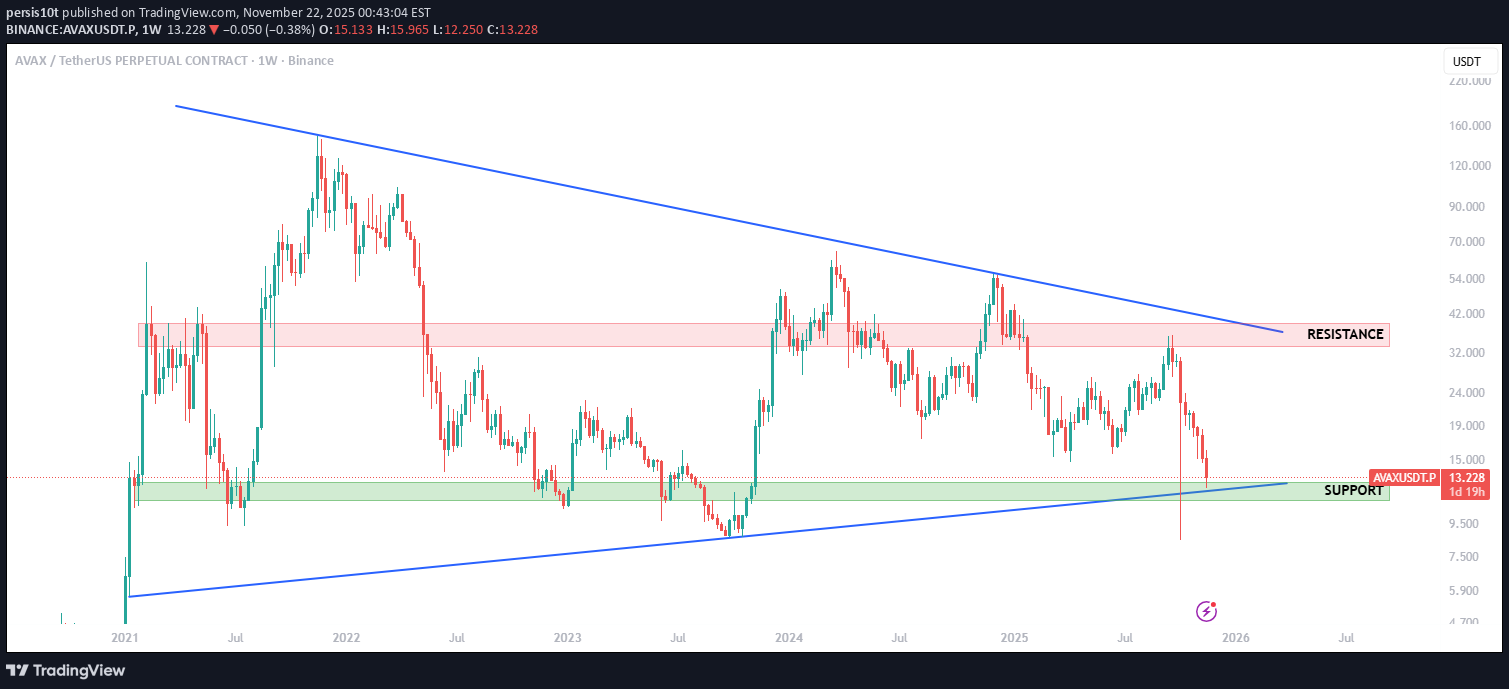
AVAX پس از یک فروش هفتگی شدید، دوباره به منطقه حمایت چندساله major بازگشته است. این سطح از سال ۲۰۲۱ چندین بار محدوده قیمتی را حفظ کرده است و اکنون قیمت در اطراف همین حمایت و خط روند بلندمدت واکنش نشان میدهد. اگر AVAX موفق شود این ناحیه را حفظ کند، بازگشت به سمت سطوح میانی محدوده (۲۱.۴۰ دلار تا ۳۳.۲۲ دلار) امکانپذیر میشود. عدم حفظ حمایت، اهداف پایینتری را در معرض دید قرار داد. این منطقه حیاتی است — AVAX یا در اینجا تثبیت میشود یا ساختار را برای یک اصلاح move عمیقتر میشکند. تحلیل فاندامنتال: AVAXUSDT به عنوان یک بلاکچین لایه اول (Layer-1) پیشرو برجسته است که به دلیل سرعت، مقیاسپذیری و پذیرش فزاینده داراییهای دنیای واقعی (RWA) شناخته میشود. فعالیت زیرشبکهها (Subnet) در حال افزایش است، نقدینگی دیفای (DeFi) رو به بهبود است و اکوسیستم مالی غیرمتمرکز شبکه، شتاب جدیدی میگیرد. ذخایر صرافیها همچنان در حال کاهش است که نشاندهنده فاندامنتالهای درونزنجیرهای سالم و روندهای عرضه نقد است. آخرین بهروزرسانیها: - Avalanche اخیراً یک ارتقای شبکه major را تکمیل کرد و واریز و برداشتهای AVAX C-Chain را بهطور موقت برای افزایش امنیت به حالت تعلیق درآورد. - نقشه راه دیفای آن شامل راهاندازی نسخه V1 در شبکه آزمایشی سپولیا (سهماهه چهارم ۲۰۲۵) است که شامل استخرهای نقدینگی جدید و پشتیبانی از ETH و USDT میشود. - حسابرسیهای اخیر و پاداش ۵۰ هزار دلاری برای کشف باگ، شهرت Avalanche را در زمینه امنیت و قابلیت اطمینان تثبیت میکند.
تحلیل تکنیکال روزانه آواکس (AVAX/USDT): آیا این کف قیمتی برای صعود آماده است؟
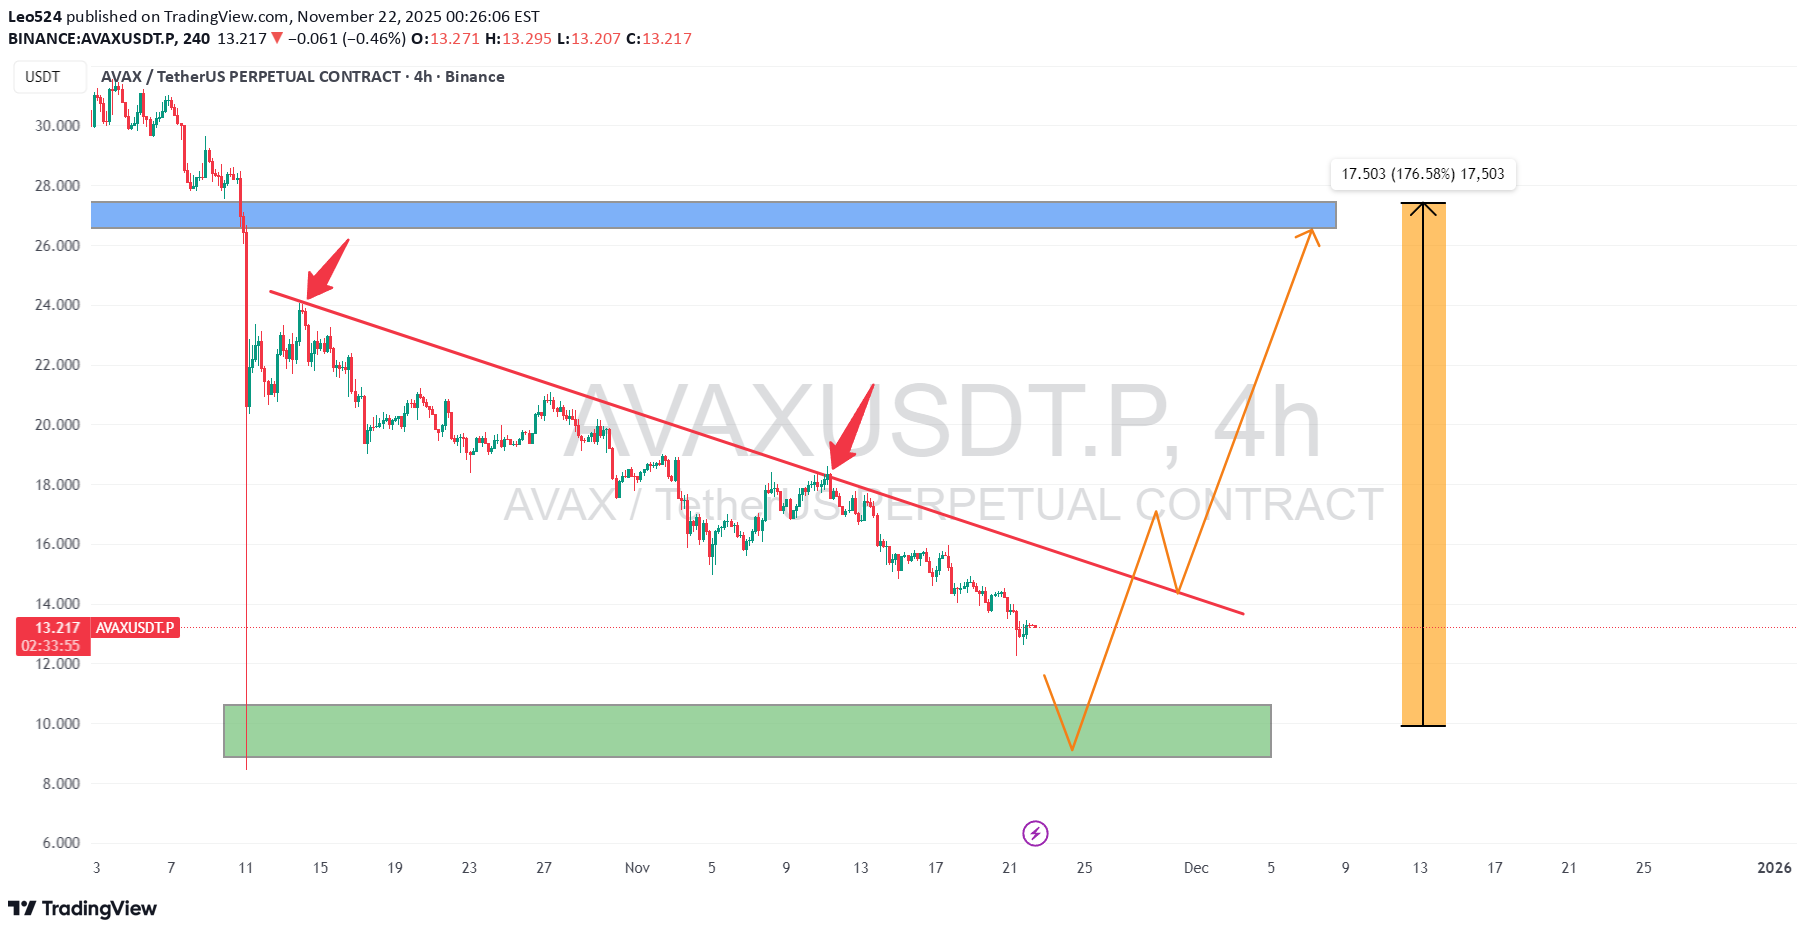
بهروزرسانی نمودار ۴ ساعته USDT ✅ 📌 USDT در حال حاضر در یک روند نزولی (خرسی) قرار دارد ✅ 📌به طور مستمر توسط یک خط روند دفع شده است (و نتوانسته از آن عبور کند) ✅ 📌اگر یک بازگشت صعودی (بولیش) از سطحی که در زیر مشخص کردهام رخ دهد، انتظار افزایش مجدد قیمت را داشت. (۱۰.۶۰ دلار - ۹.۳۰ دلار) 🚀
DAY11
تحلیل تکنیکال آوالانچ (AVAX): فرصت خرید کوتاهمدت با نقاط ورود و خروج دقیق!

من قبلاً جزئیات کامل همراه با نمودار (چارت) را در پست قبلی منتشر کردهام. در اینجا، ما فرصتی برای باز کردن یک پوزیشن خرید (لانگ) داریم. اخیراً، این [دارایی/نماد] به طور مشخص در محدوده یک کانال در حال معامله بوده است. قبل از ورود، تحقیقات شخصی خود را انجام دهید (DYOR). این یک تنظیمات معاملاتی پرخطر برای بازه زمانی کوتاه است. قیمت ورود (لانگ): ۱۳ دلار حد ضرر (استاپ لاس): ۱۲ دلار حد سود ۱: ۱۴ دلار حد سود ۲: ۱۵ دلار حد سود ۳: ۱۶ دلار

wolffxtrader
بهترین زمان خرید آوالانچ (AVAX) فرا رسید؟ تحلیل تکنیکال دقیق!
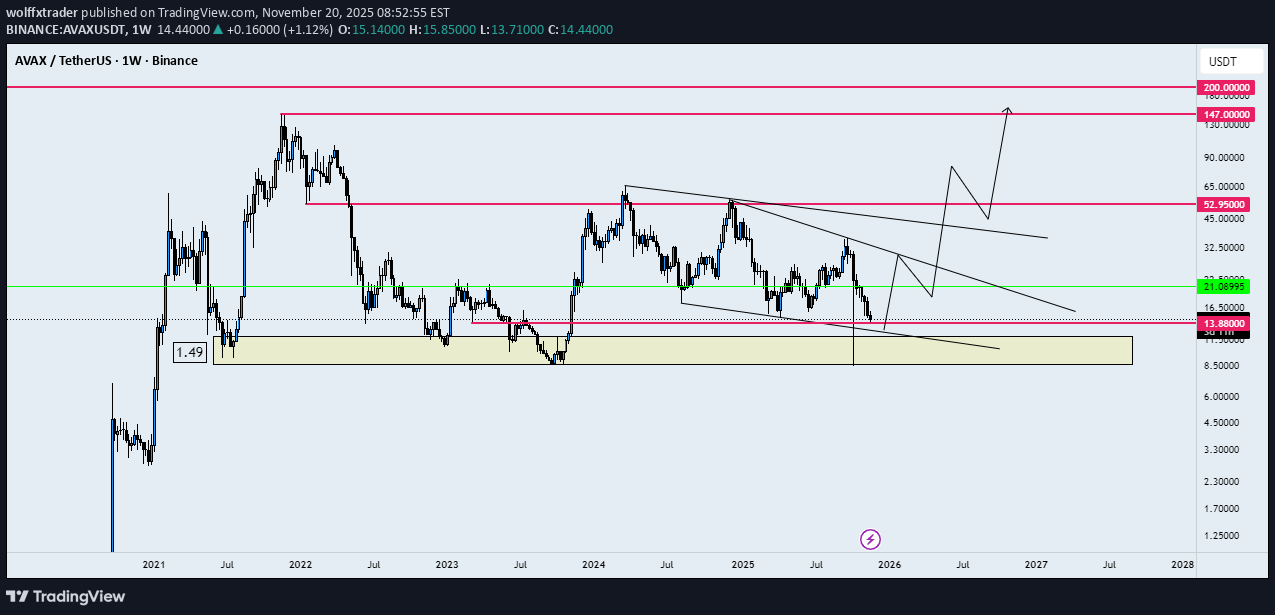
سلام تریدرها، امروز چطورید؟ همانطور که مشاهده میکنید، قیمت یک اصلاح بزرگ را آغاز کرده است و من فکر میکنم که گاوها (نیروهای صعودی) در حال بازگشت هستند و میخواهم در همین اصلاح، وارد پوزیشن خرید شوم. لذت ببرید.
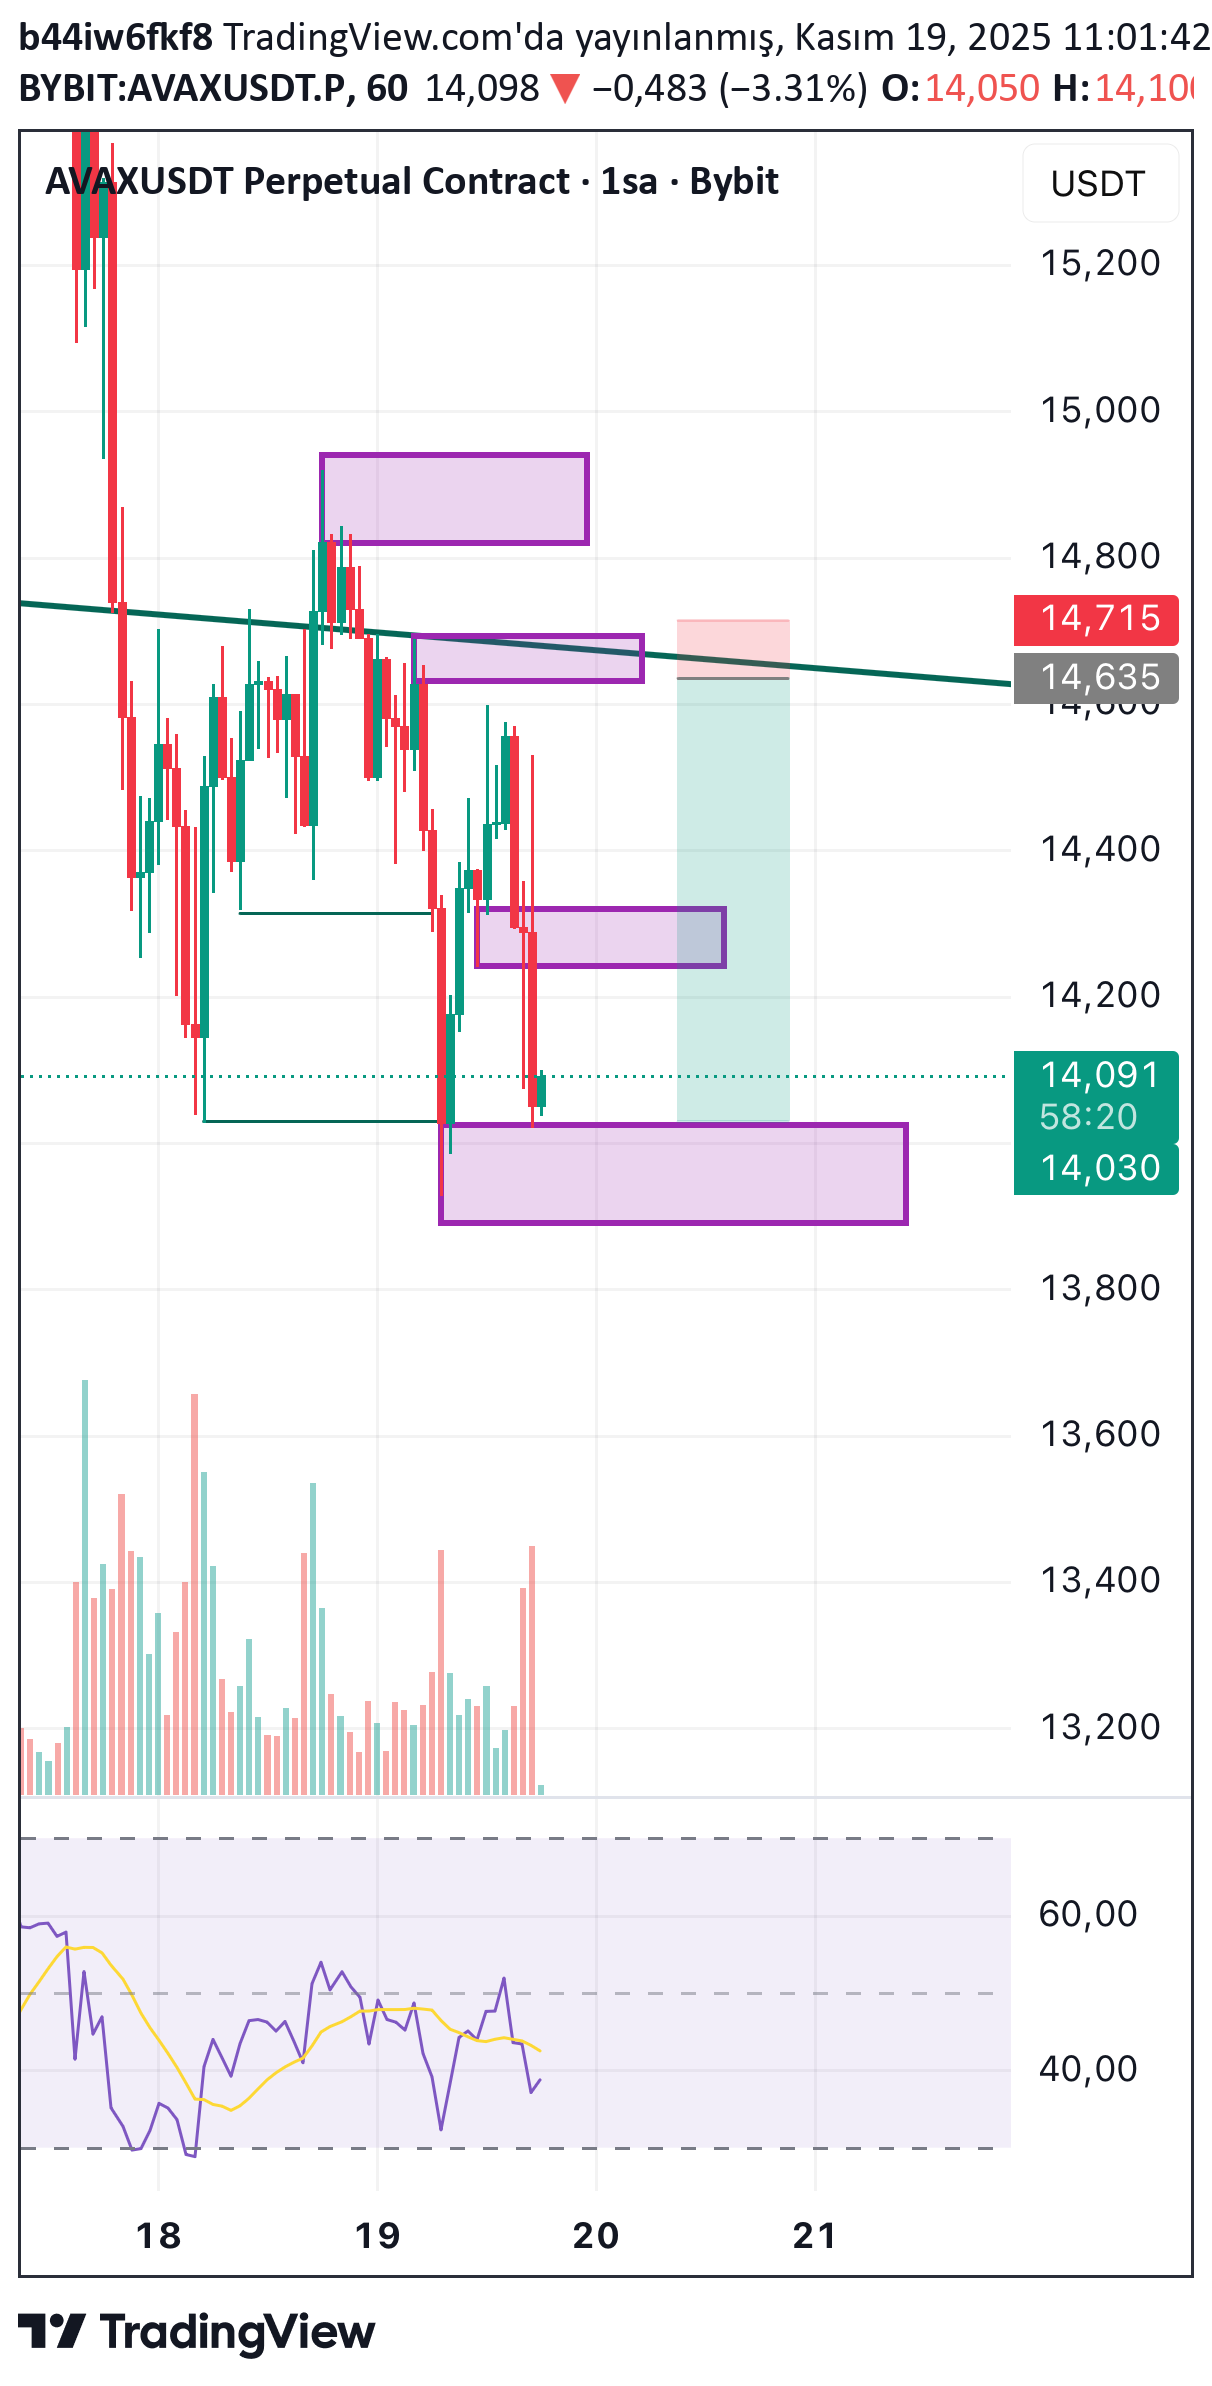
تحلیل فوقالعاده آواکس: استراتژی معامله سوئینگ با موتور جنسیس (ورود، حد ضرر و هدف)
برنامه معاملاتی نوسانی AVAX/USDT برای Genesis Ultra Engine. نقاط ورود، حد ضرر و اهداف در نمودار مشخص شده است.

KooshiCryptoGem
پیشبینی بازگشت قیمت به منطقه سبز: تحلیل موج و روش گن (نظر شخصی)
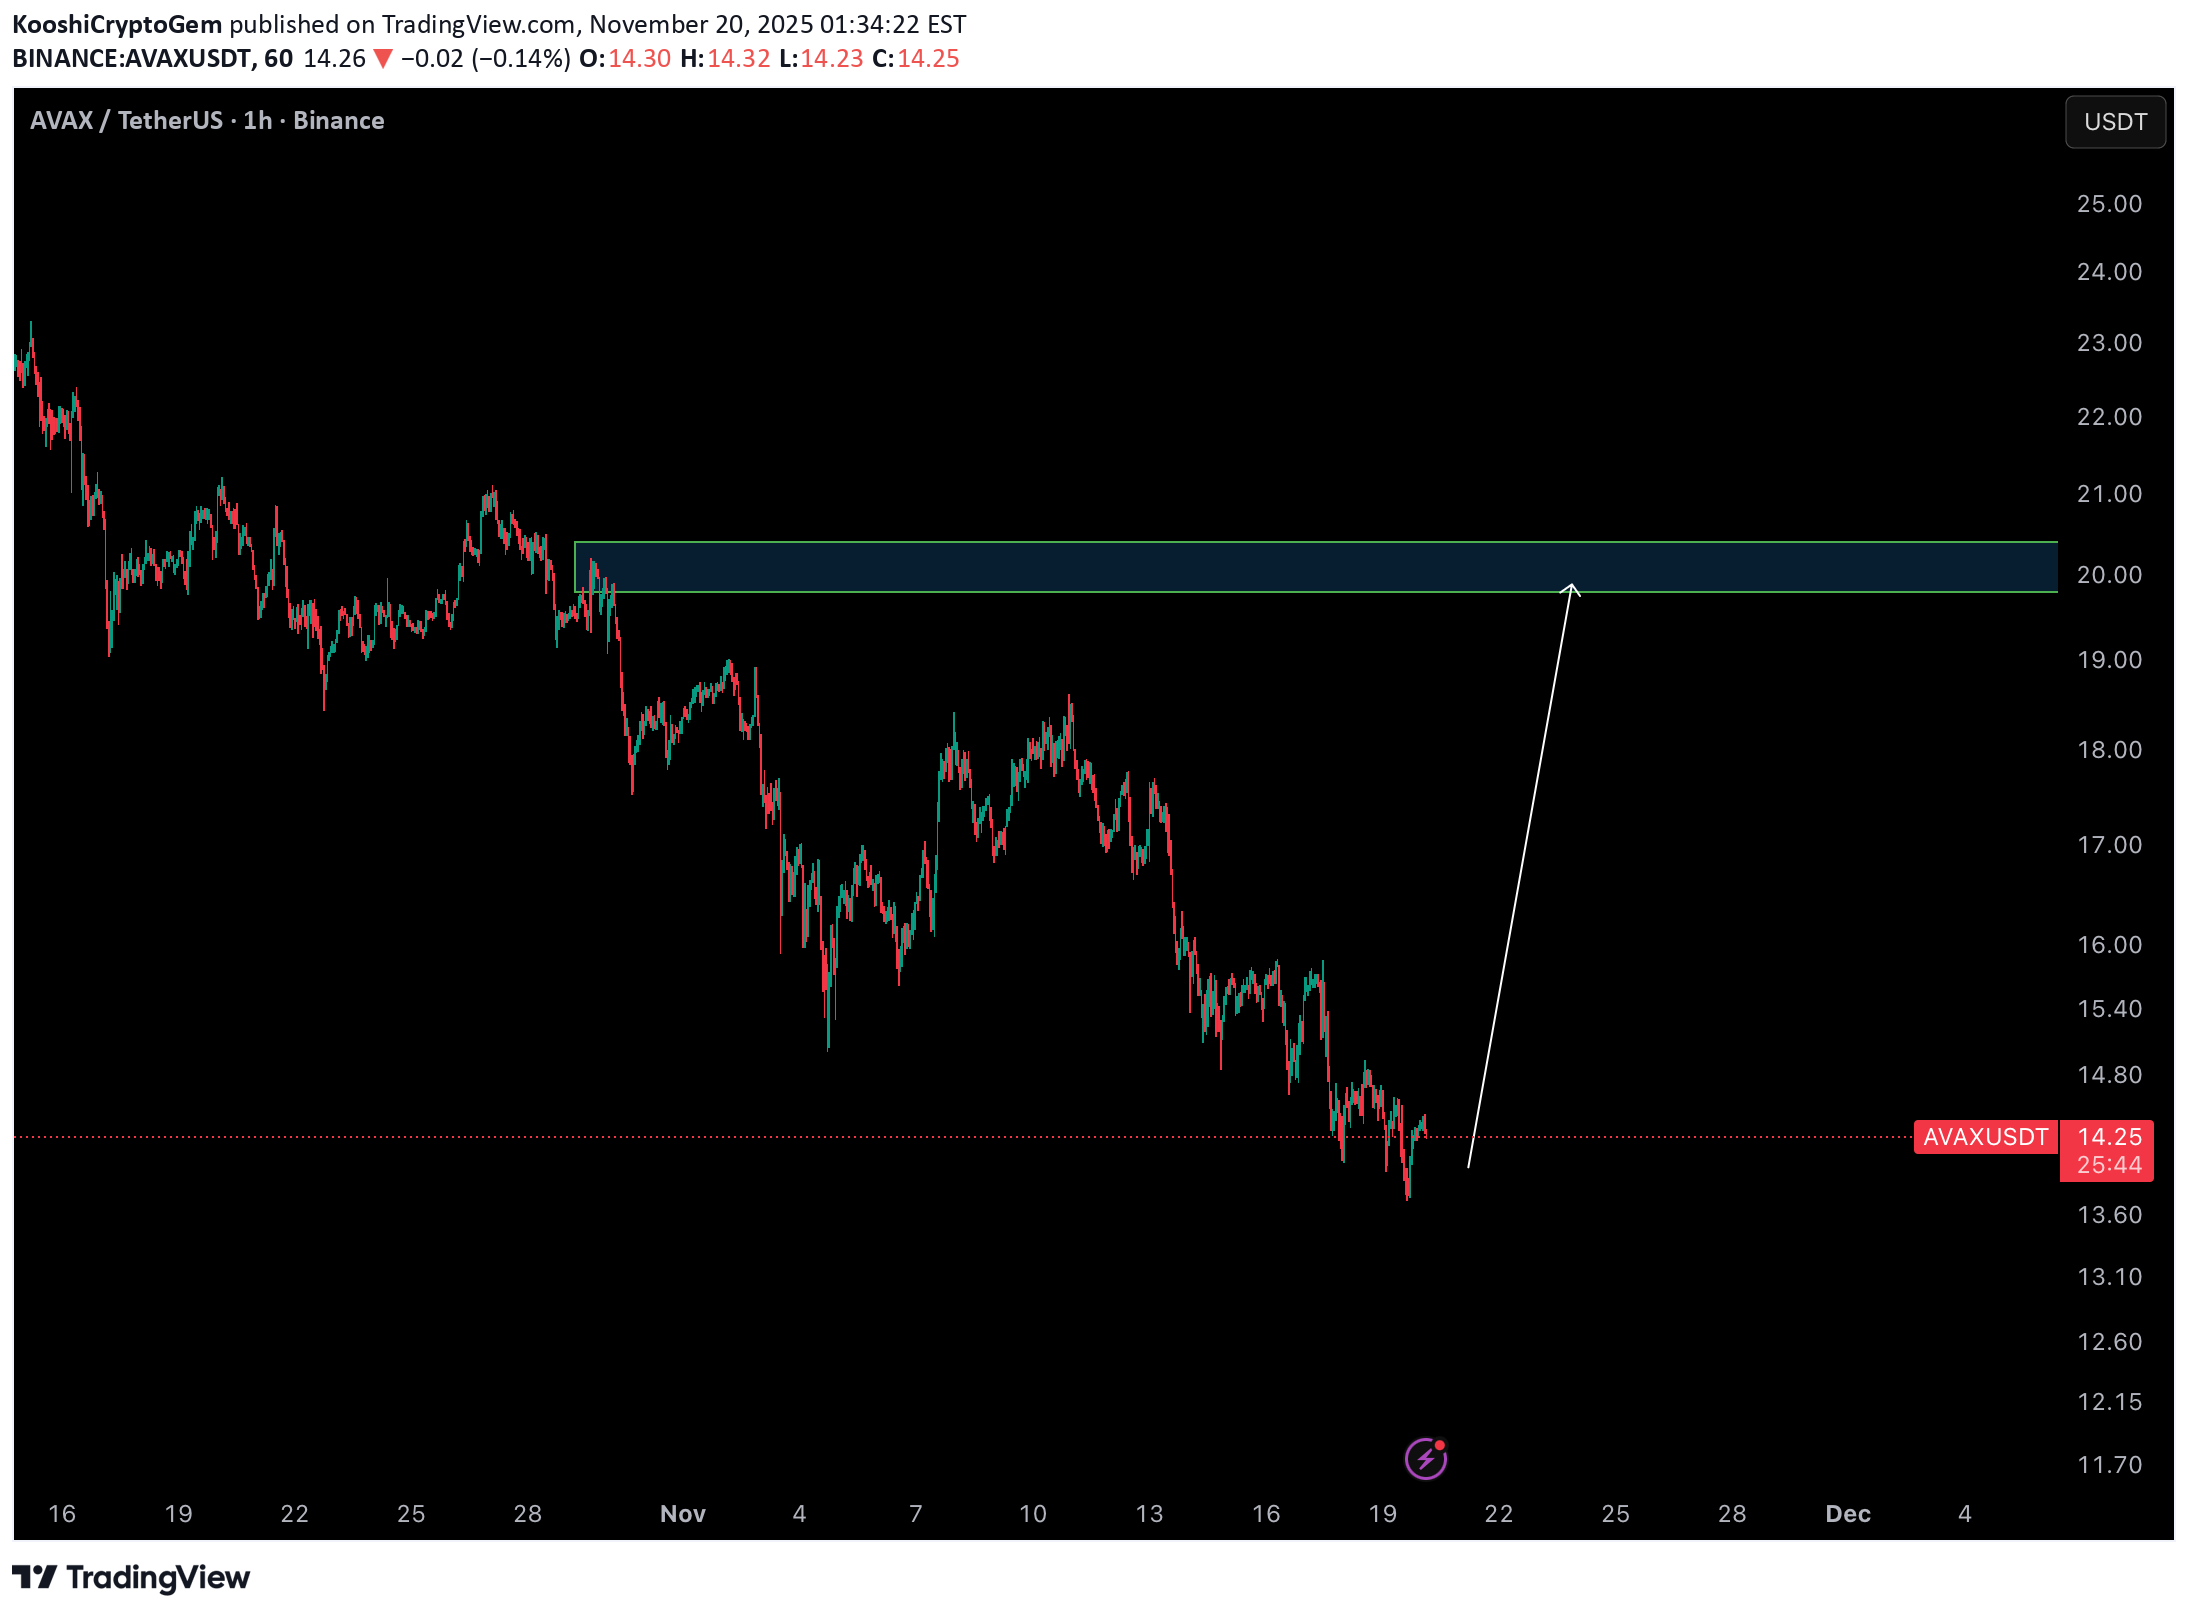
بر اساس تحلیل انجامشده و با کمک متد گن (Gann)، میتوان انتظار داشت که قیمت مجدداً به ناحیه سبز بازگردد. این نظر شخصی من است. لطفاً از آن به عنوان معیار معاملاتی خود استفاده نکنید. موفق باشید.
آوالانچ (AVAX) در مسیر صعودی: آیا این قیمت نقطه پرش جدید است؟
در صورتی که در نمودار ساعتی از سطح فعلی خود حمایت شود، پتانسیل حرکت صعودی وجود دارد.
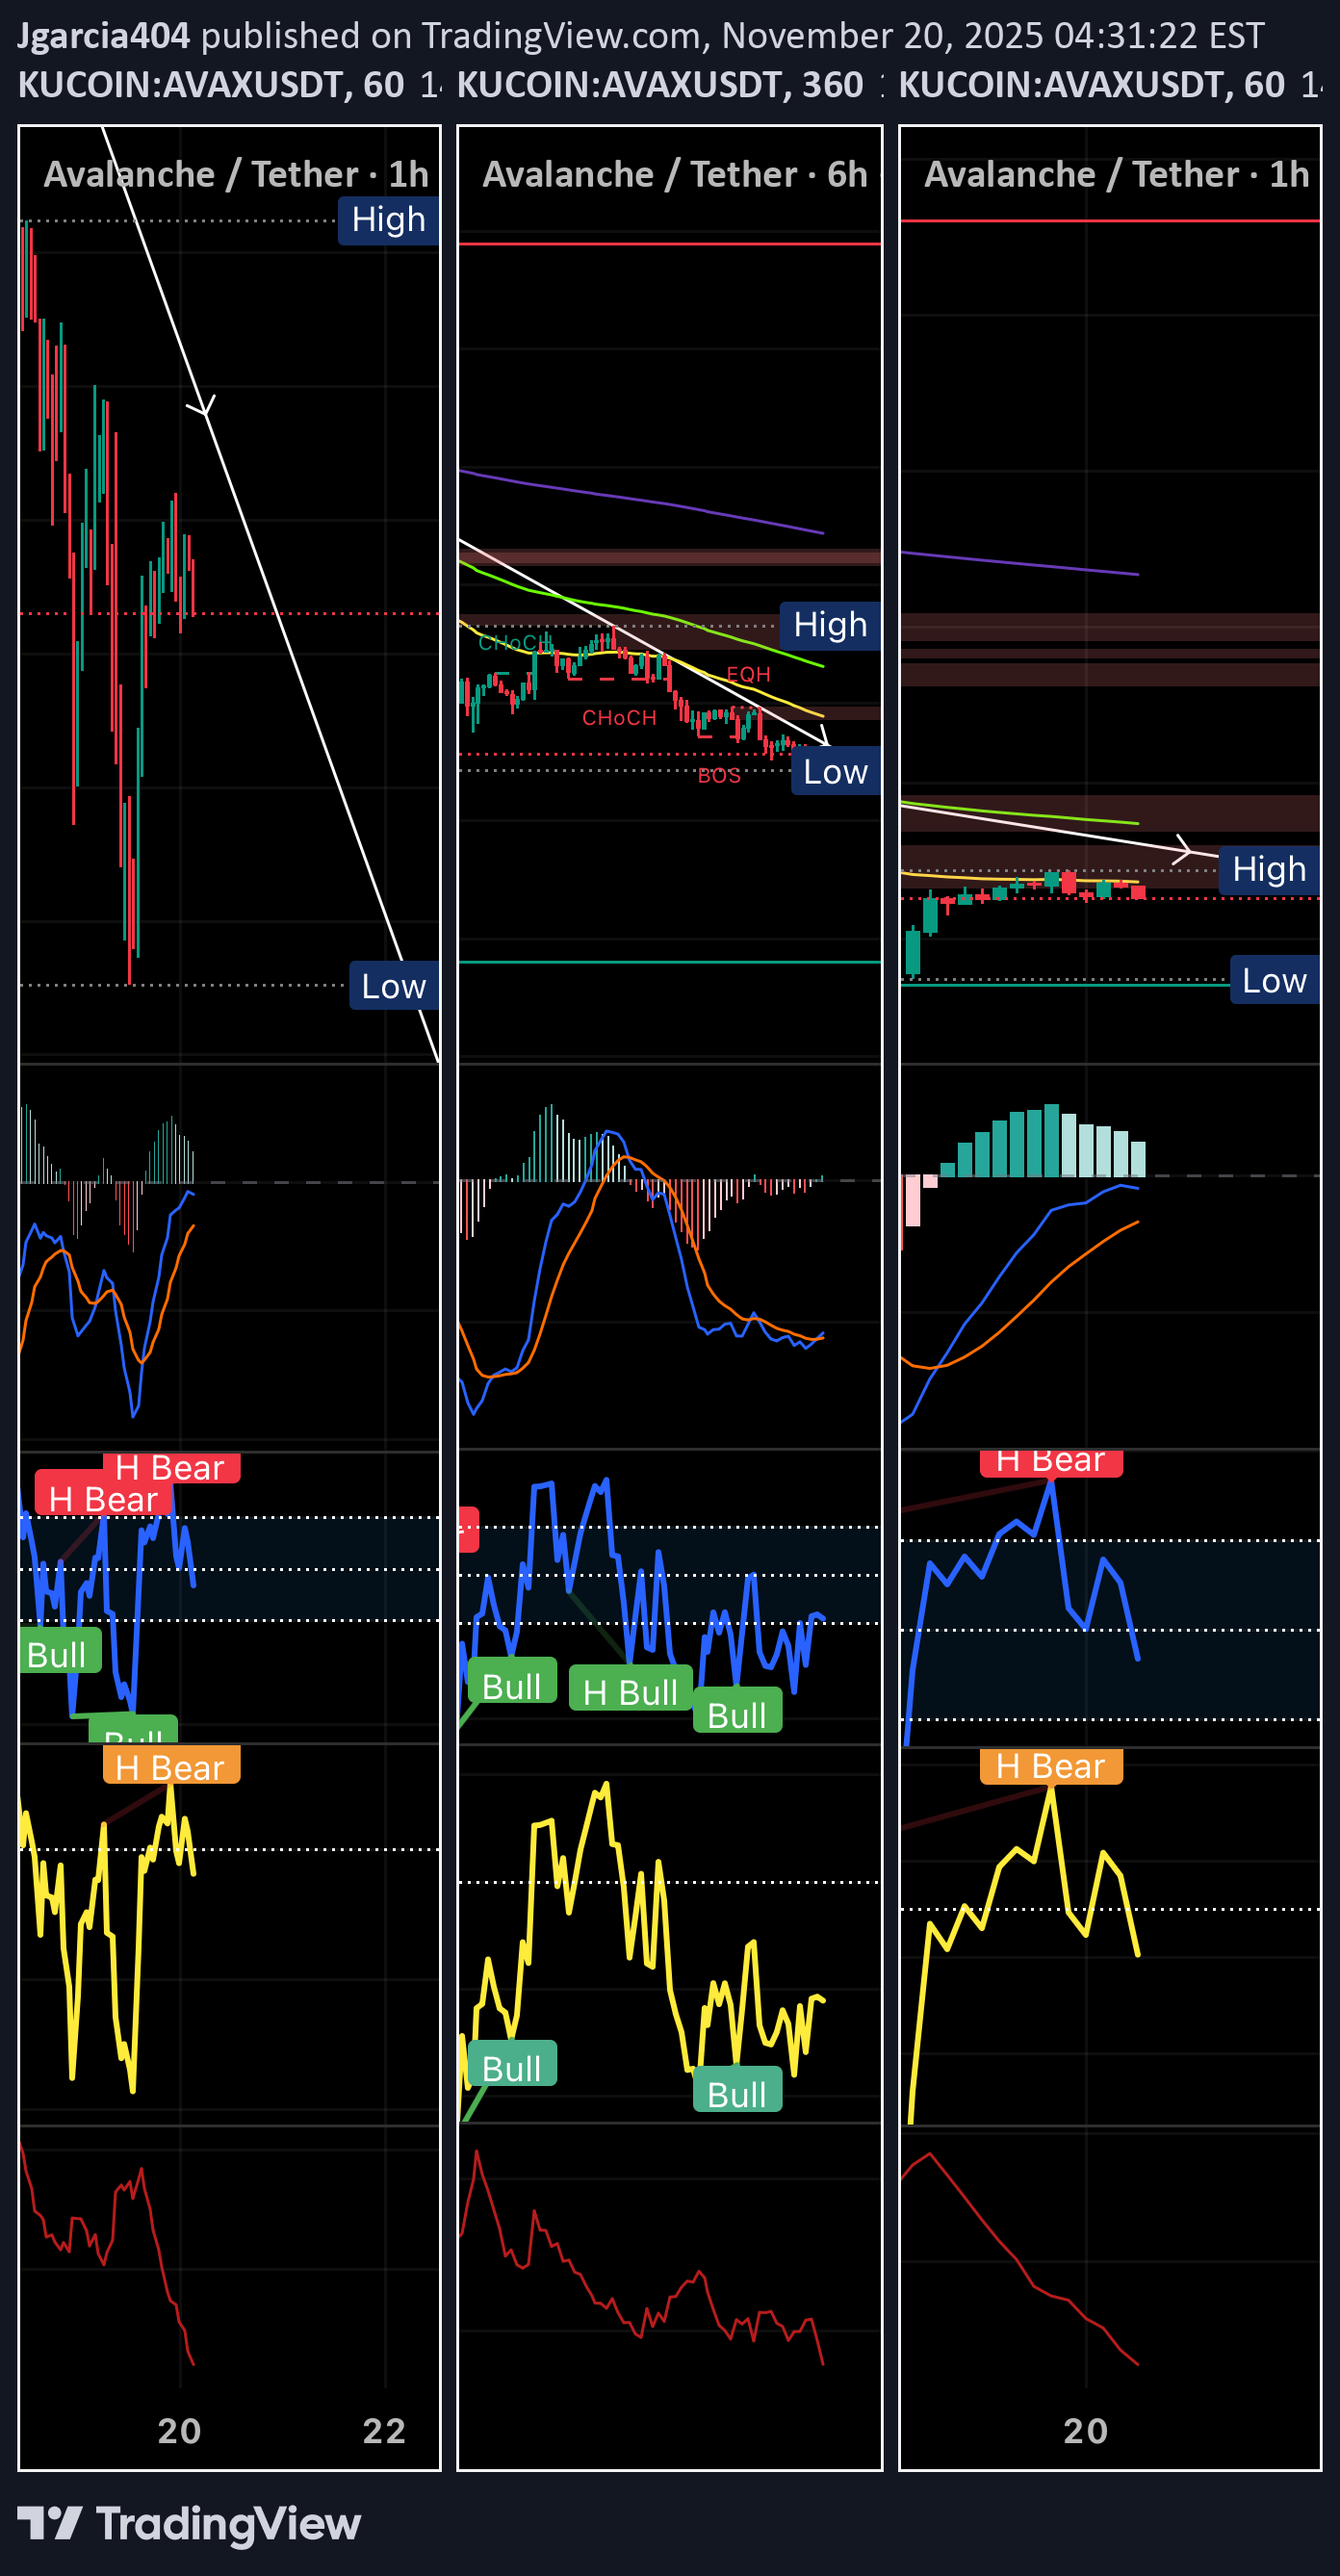
تحلیل روزانه آوالانچ (AVAX/USDT): سطوح کلیدی و اهداف حرکتی قیمت
با ورود مجدد قیمت به داخل محدوده، خط میانی محدوده هدف قرار میگیرد. نمودار صرفاً جهت پیگیری است و توصیه سرمایهگذاری نمیباشد.

BitcoinGalaxy
آوالانچ (AVAX) آماده انفجار؟ پیشبینی صعود تا ۱۰۰ دلار!

AVAX در سطح بسیار پایینی قرار دارد. این میتواند در اینجا حمایت را حفظ کند و طی چند ماه آینده تا حدود ۱۰۰ دلار جهش کند.
سلب مسئولیت
هر محتوا و مطالب مندرج در سایت و کانالهای رسمی ارتباطی سهمتو، جمعبندی نظرات و تحلیلهای شخصی و غیر تعهد آور بوده و هیچگونه توصیهای مبنی بر خرید، فروش، ورود و یا خروج از بازارهای مالی نمی باشد. همچنین کلیه اخبار و تحلیلهای مندرج در سایت و کانالها، صرفا بازنشر اطلاعات از منابع رسمی و غیر رسمی داخلی و خارجی است و بدیهی است استفاده کنندگان محتوای مذکور، مسئول پیگیری و حصول اطمینان از اصالت و درستی مطالب هستند. از این رو ضمن سلب مسئولیت اعلام میدارد مسئولیت هرنوع تصمیم گیری و اقدام و سود و زیان احتمالی در بازار سرمایه و ارز دیجیتال، با شخص معامله گر است.