
ONE
هارمونی
| تریدر | نوع سیگنال | حد سود/ضرر | زمان انتشار | مشاهده پیام |
|---|---|---|---|---|
نتیجه ای یافت نشد. | ||||
نمودار قیمت هارمونی
سود ۳ ماهه :
سیگنالهای هارمونی
فیلتر
مرتب سازی پیام براساس
نوع پیام
نوع تریدر
فیلتر زمان
SIGNOLL
تحلیل جدید Harmony (ONE) با الگو: آیا این ارز به یک دلار میرسد؟
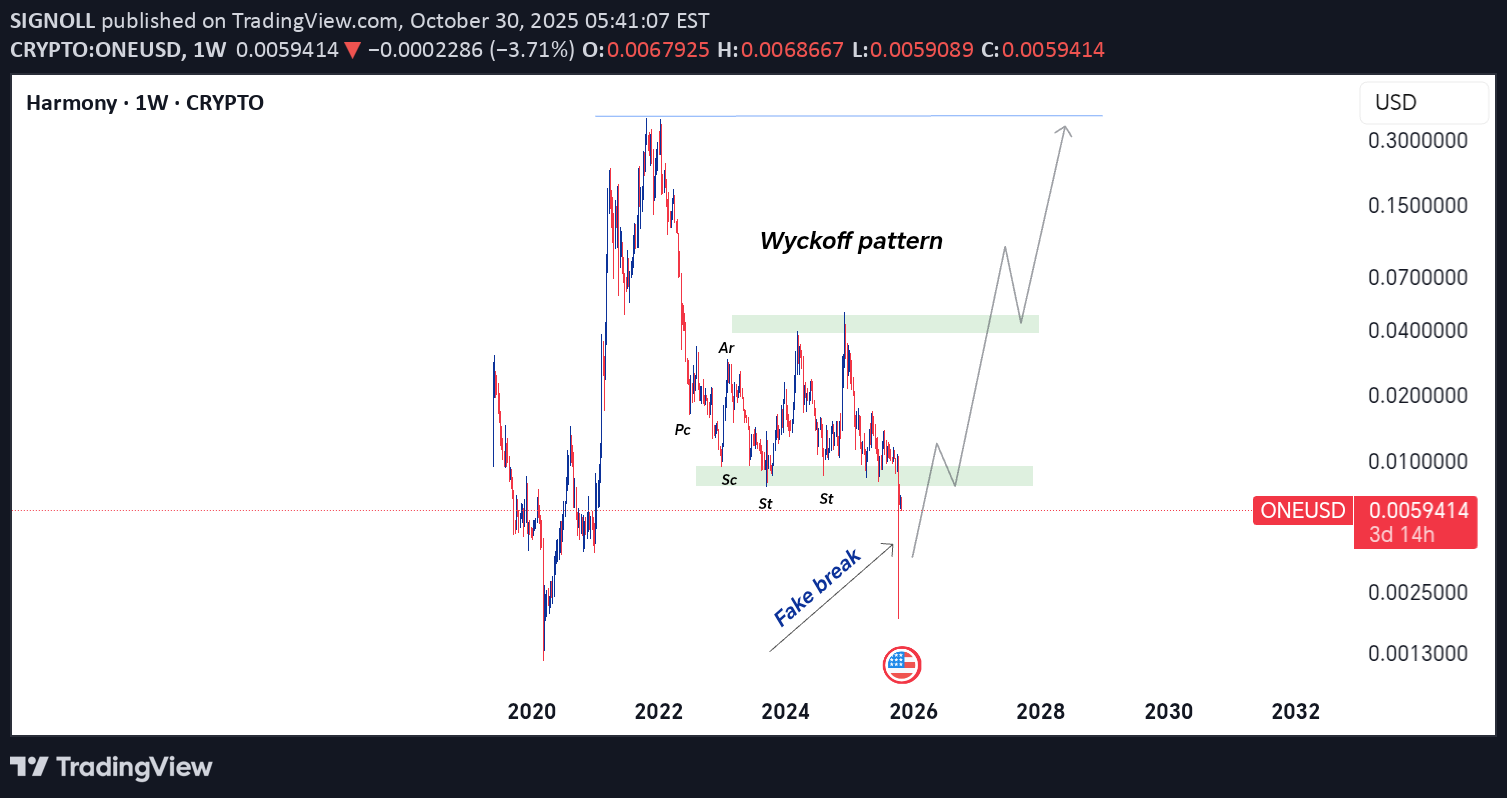
تحلیل دیگری از ارز هارمونی بر اساس الگوی وایکوف
SIGNOLL
هارمونی (ONE) بعد از اصلاح، آماده پرواز به کجا؟ پیشبینی بزرگ با تحلیل امواج الیوت!
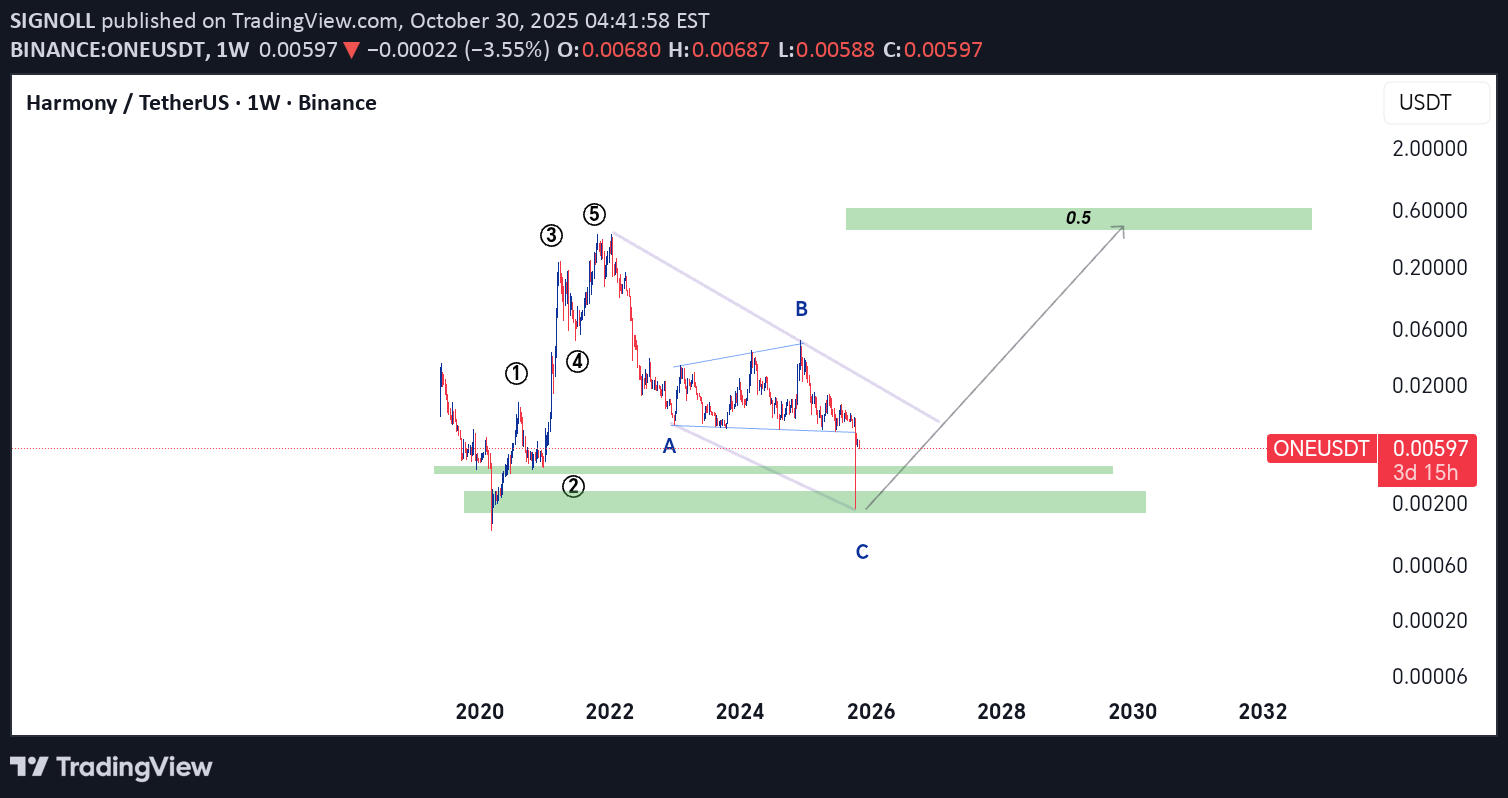
ارز دیجیتال هارمونی اصلاح خود را بر اساس تئوری امواج الیوت تکمیل کرده است و میتواند تا محدوده مشخص شده صعود کند.

Zorroreny
آیا تاریخ تکرار میشود؟ راز پنهان الگوی صعودی $ONE و هدف ۱۰ دلاری!
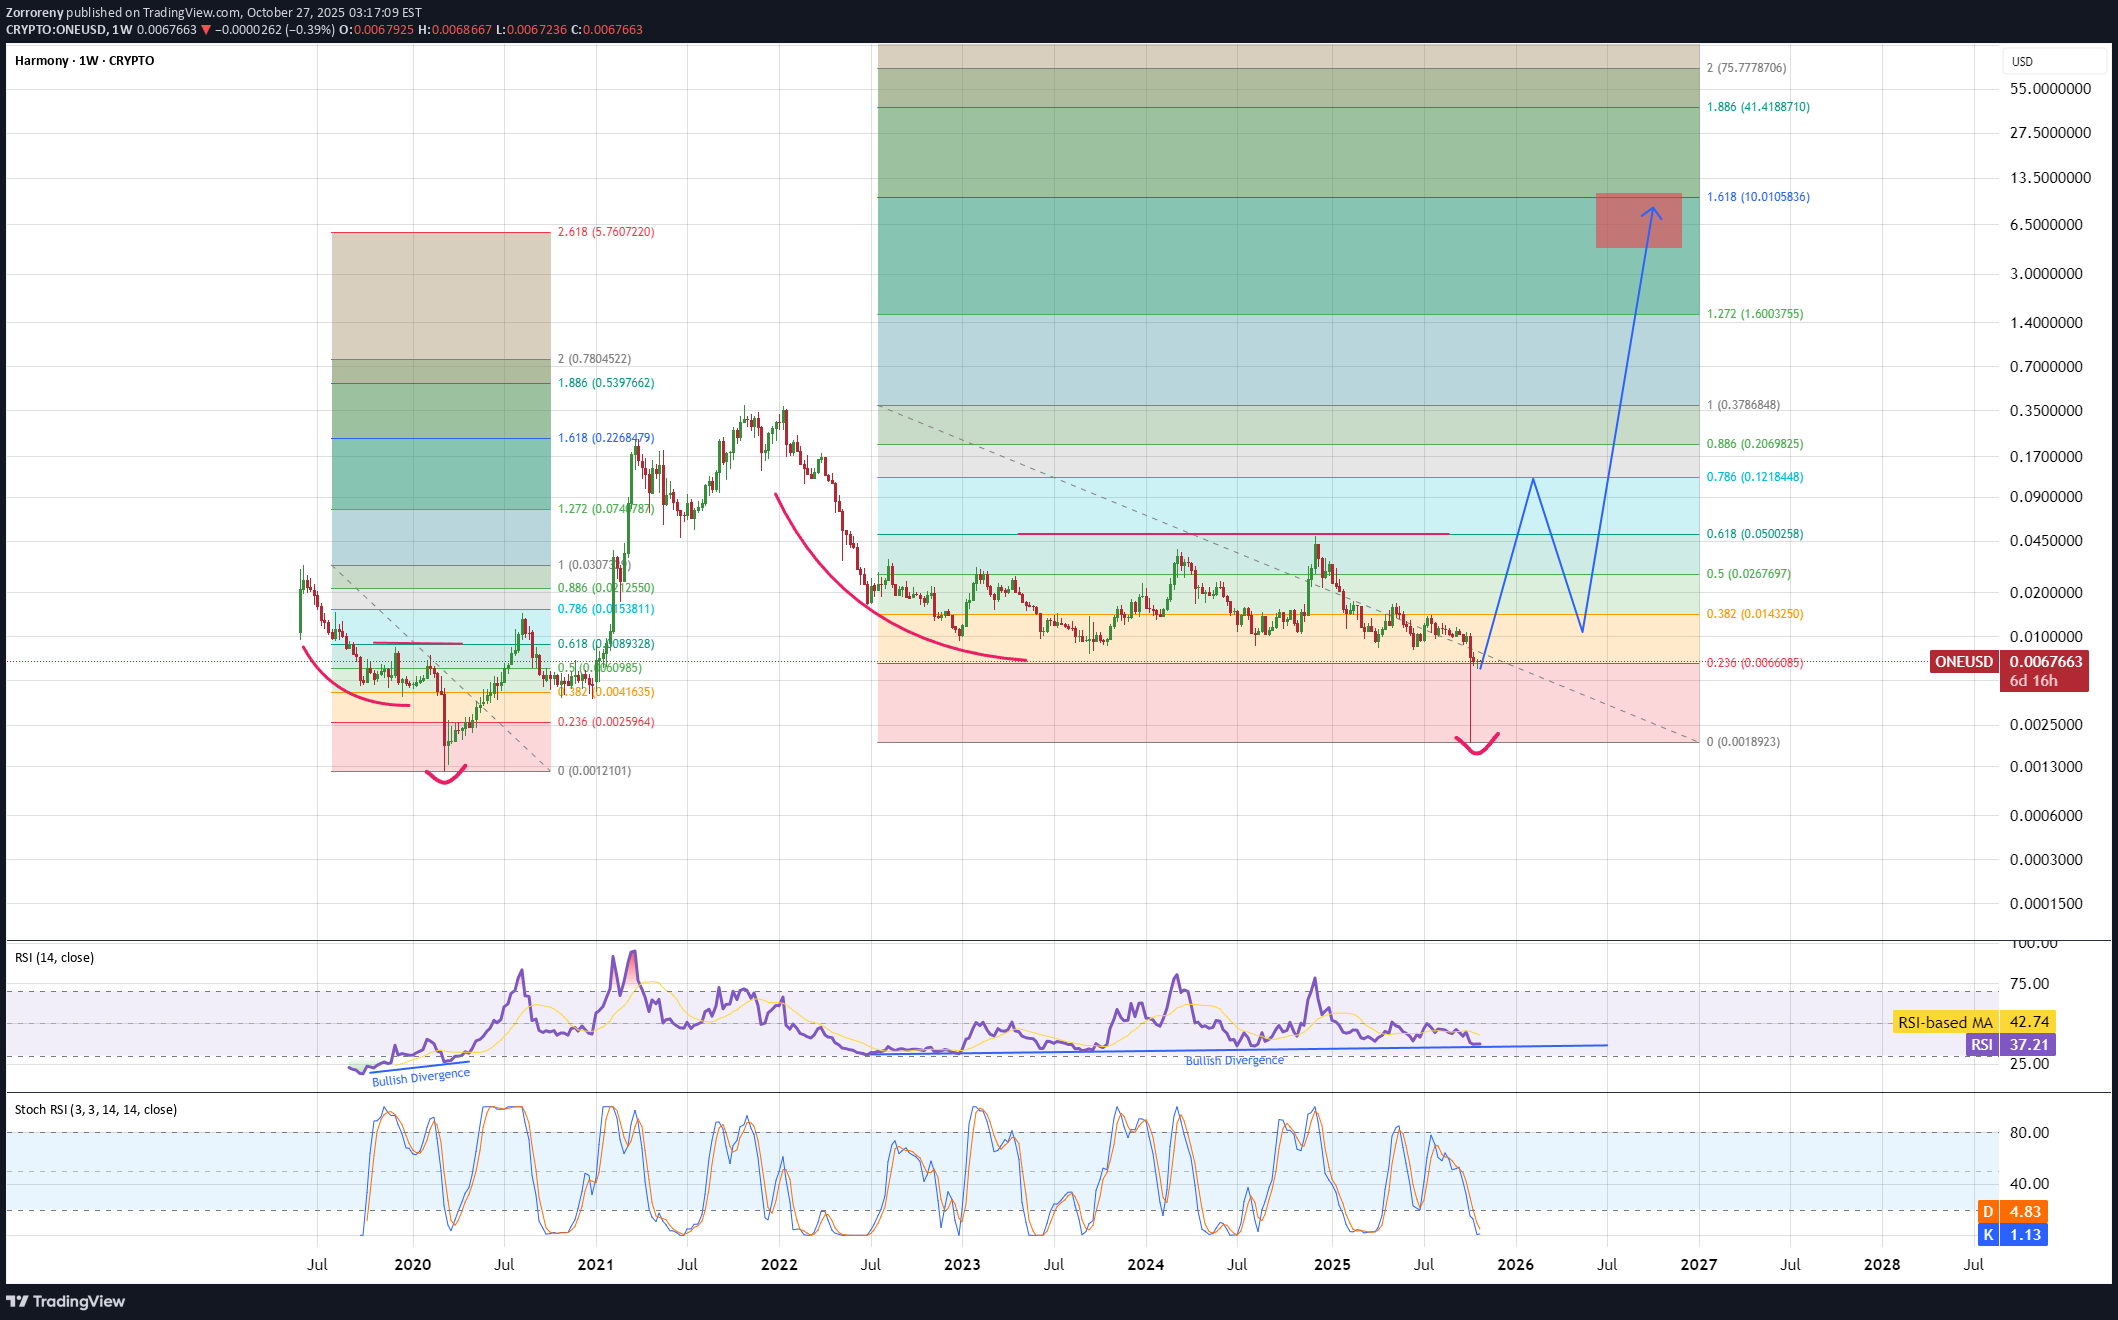
ONE دقیقاً همان الگوی سال ۲۰۲۰ را با همان سطوح فیبوناچی شکل داده است. درست مانند سال ۲۰۲۰، اکنون واگرایی صعودی داریم و اگر تاریخ تکرار شود، میتوانیم انتظار داشته باشیم که قیمت به اوجهای جدیدی افزایش یابد که هدف آن محدوده ۱۰ دلار بود. اولین تأییدیه این طرح، افزایش قیمت تا محدوده فیب ۰.۷۸۶ و سپس اصلاح مجدد تا فیب ۰.۳۸۲ برای تشکیل یک کف بالاتر است.

نمونه فرمولاسیون توبو چیست؟ آیا برای کار شما مناسب است؟
ببینیم آیا این تحلیل الگو (فُرمِیشن) به عنوان یک نمونه عمل کرد یا خیر.

CryptoAnalystSignal
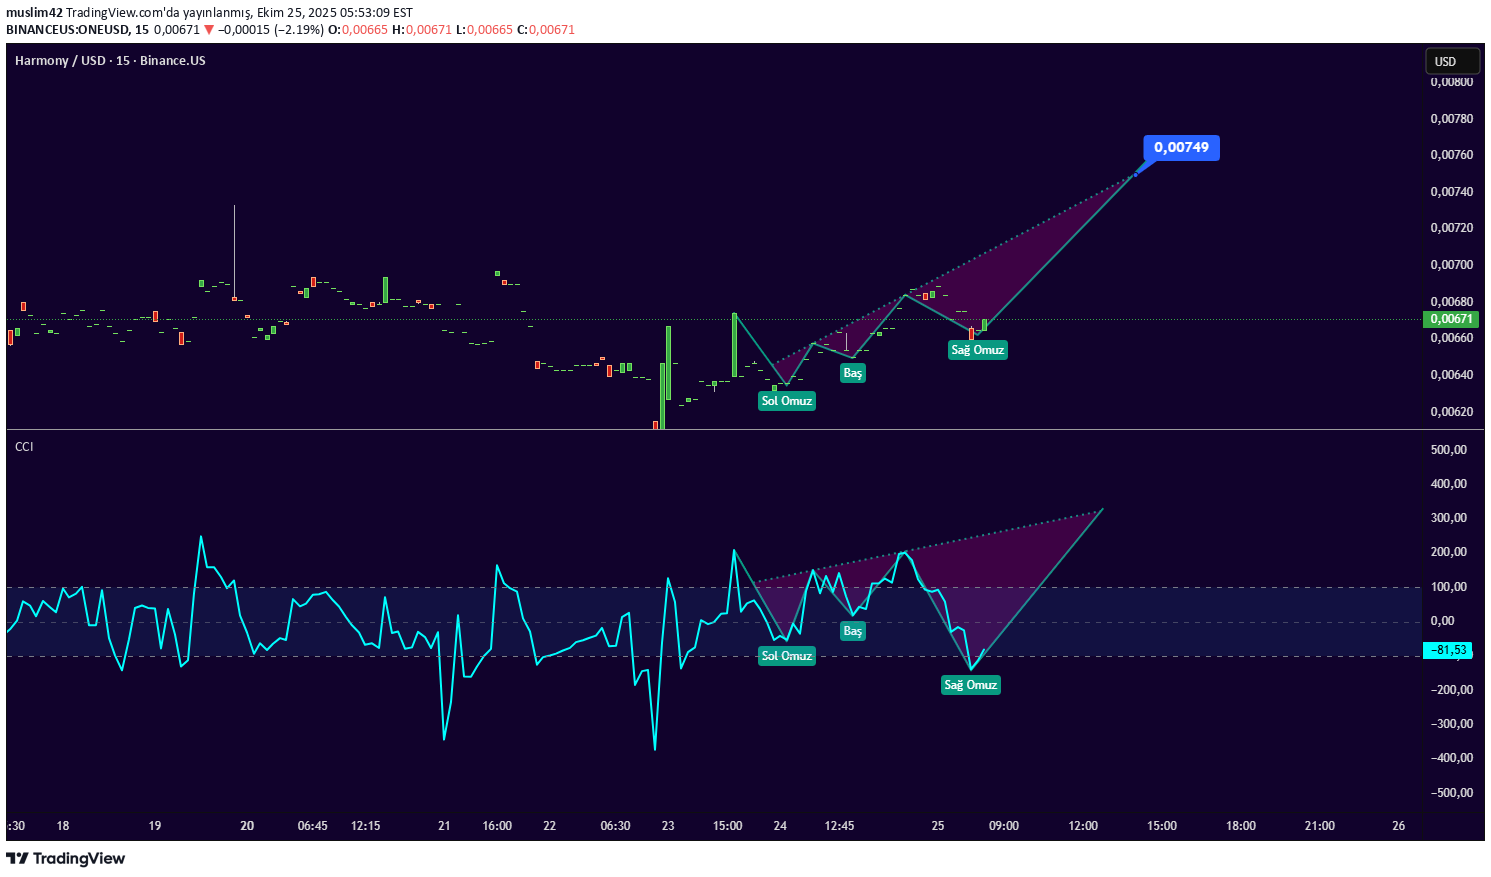
آیا ارز ONE در آستانه بازگشت صعودی است؟ تحلیل دقیق سطوح کلیدی و اهداف قیمتی

قیمت در تایم فریم ۱ ساعته در حال حرکت درون یک کانال نزولی است، به خوبی به آن پایبند بوده و در شرف یک شکست قدرتمند و پولبک (ریتست) قرار دارد. در اندیکاتور RSI یک روند نزولی وجود دارد که در آستانه شکسته شدن و پولبک است و این امر از شکست رو به بالا حمایت میکند. یک منطقه حمایتی سبز رنگ در ۰.۰۰۶۵۲ وجود دارد که نشاندهنده یک نقطه حمایتی قوی است. ما در حال حرکت برای تثبیت بالای میانگین متحرک ۱۰۰ هستیم. قیمت ورود: ۰.۰۰۶۹۱ هدف اول: ۰.۰۰۷۰۶ هدف دوم: ۰.۰۰۷۲۱ هدف سوم: ۰.۰۰۷۳۹ یک نکته ساده را فراموش نکنید: مدیریت سرمایه. هنگام رسیدن به هدف اول، مقداری سود سیو کنید و سپس حد ضرر خود را به قیمت ورود (نقطه سر به سر) تغییر دهید. برای پرسشها، لطفاً یک کامنت بگذارید. سپاسگزارم.

CryptoNuclear
آیا ONE/USDT قبل از بازگشت بزرگ، آخرین کف قیمتی را لمس میکند؟

نمودار هفتگی ONE/USDT story یک چرخه کامل بازار کریپتو را نشان می دهد: از اوج سرخوشی سال 2021 تا یک روند نزولی طولانی که اکنون قیمت را به منطقه انباشت تاریخی بین 0.0055 - 0.0042 بازگردانده است - همان منطقه ای که قبل از روند صعودی قبلی ONE. شکست زیر 0.00915 موجی از فروش وحشتناک را برانگیخت و نقدینگی deep را فرا گرفت و فتیله پایینی عظیمی را تشکیل داد که منطقه تقاضای زرد را سوراخ کرد. چنین حرکاتی اغلب مرحله تسلیم را نشان میدهد، جایی که معاملهگران خردهفروش تسلیم میشوند و پول هوشمند بیصدا در زیر سطح انباشته میشود. --- ساختار و بررسی اجمالی فنی روند کلان: روند نزولی چند ساله قوی با سطوح پایین و پایین ثابت از سال 2021. منطقه تقاضای کلیدی: بلوک زرد (0.0055 - 0.0042) به عنوان آخرین منطقه تقاضای major و پایه بالقوه برای چرخه بازار جدید عمل می کند. رفتار شمع: فتیله بزرگ حاکی از چنگ انداختن نقدینگی است - یک سیگنال رایج مبنی بر اینکه اگر با بسته شدن شدید هفتگی بالای منطقه تأیید شود، فرسودگی نزولی ممکن است نزدیک باشد. Major سطوح مقاومت: 0.0130 → 0.01625 → 0.0200 → 0.0240 → 0.0355 - این سطوح می توانند به عنوان اهداف بالقوه آزمایش مجدد یا شکست در صورت معکوس شدن روند عمل کنند. --- سناریوی صعودی شرط اصلی: بسته شدن هفتگی بالای 0.00915 نشان دهنده یک بازپس گیری کلید و بازگشت ساختاری بالقوه است. سیگنال های تایید: افزایش حجم خرید و تشکیل یک پایین ترین سطح بالاتر از ناحیه زرد. اهداف صعودی: 1. 0.0130 – اولین سطح ریباند فنی 2. 0.01625 – 0.0200 – منطقه عرضه میان رده 3. 0.0355 - هدف کلان در صورت تداوم معکوس روایت صعودی: "پول هوشمند زمانی انباشته می شود که ترس غالب شود. مرحله آرام انباشت ممکن است از قبل در جریان باشد." --- سناریوی نزولی تایید نزولی: بسته شدن هفتگی زیر 0.0042، شکست ساختاری کامل را تایید می کند. هدف بعدی: ادامه پایینتر به سمت ناحیه روانشناختی 0.0023، وارد فاز کمارزشگذاری deep. روایت نزولی: "اگر منطقه زرد شکست بخورد، ONE میتواند وارد آخرین مرحله چرخه سقوط خود شود - مرحلهای که فقط صبورترین سرمایهگذاران آن را تحمل میکنند." --- استراتژی و فرصت معاملهگران کوتاهمدت: قبل از در نظر گرفتن ورودیهای طولانی، منتظر بازپسگیری تایید شده بالای 0.00915 باشید. سرمایه گذاران بلندمدت: محدوده 0.0055 – 0.0042 یک منطقه انباشت بالقوه باقی می ماند - اما فقط با مدیریت ریسک منضبط زیر حمایت. اصل Core: واژگونی های واقعی از خوش بینی زاده نمی شوند، بلکه از ناامیدی به وجود می آیند. --- نتیجه گیری ONE در یک نقطه عطف بحرانی چند ساله قرار دارد. محدوده 0.0055 - 0.0042 نشان دهنده میدان نبرد نهایی بین تسلیم شدن و تولد دوباره است. اگر منطقه حفظ شود و قیمت 0.00915 بازگردد، یک چرخه جدید می تواند آغاز شود. اگر کاهش یابد، قبل از تشکیل مرحله انباشت بعدی، انتظار کاهش ارزش گذاری عمیق تری را داشته باشید. بازار در حال آزمایش صبر است - معتقدان را از پیروان روند جدا می کند. --- #ONEUSDT #HarmonyONE #CryptoAnalysis #Altcoin Reversal #PriceAction #CryptoCapitulation #MarketCycle #تحلیل فنی #CryptoMarket #Support Resistance

satooshi1242
روند انفجاری در راه است: رسیدن به 350٪ تنها با کمی صبر!

همانطور که در نمودار مشاهده میکنید، دو خط روند مهم شکسته شدهاند و آمادهاند تا به راحتی به ۳۵۰٪ برسند، اما کمی صبر لازم است.

CryptoWithJames
خیز 50 درصدی ONE: سیگنال شکست الگوی گوه نزولی برای سود انفجاری!

بهروزرسانی #وان تحلیل تکنیکال ONE الگو: الگوی وِج نزولی صعودی (Bullish falling wedge) قیمت فعلی: ۰.۰۱۲۶۵ دلار قیمت هدف: ۰.۰۱۹۰۷ دلار درصد سود مورد انتظار: ۵۰.۸۲٪ ONE در حال خروج از الگوی وِج نزولی در تایمفریم یک روزه (1D) است. قیمت فعلی ۰.۰۱۲۶۵ دلار است و با هدفی نزدیک به ۰.۰۱۹۰۷ دلار، حدود ۵۰ درصد پتانسیل رشد صعودی را نشان میدهد. این شکست الگو، شتاب صعودی (مومنتوم بولیش) را تأیید میکند و ساختار قیمت به نفع ادامه حرکت است. بازه زمانی: ۱D نکته مدیریت ریسک: همیشه از مدیریت ریسک صحیح استفاده کنید.

هارمونی وان: چرا این پروژه undervalued است و پتانسیل صعودی عظیمی دارد؟

بنیانهای (فاندامنتال) بسیار قوی، پروژهای با ارزشگذاری شدیداً کمتر از حد واقعی، خودتان تحقیق کنید.

morningishappy
Really want to go to the moon
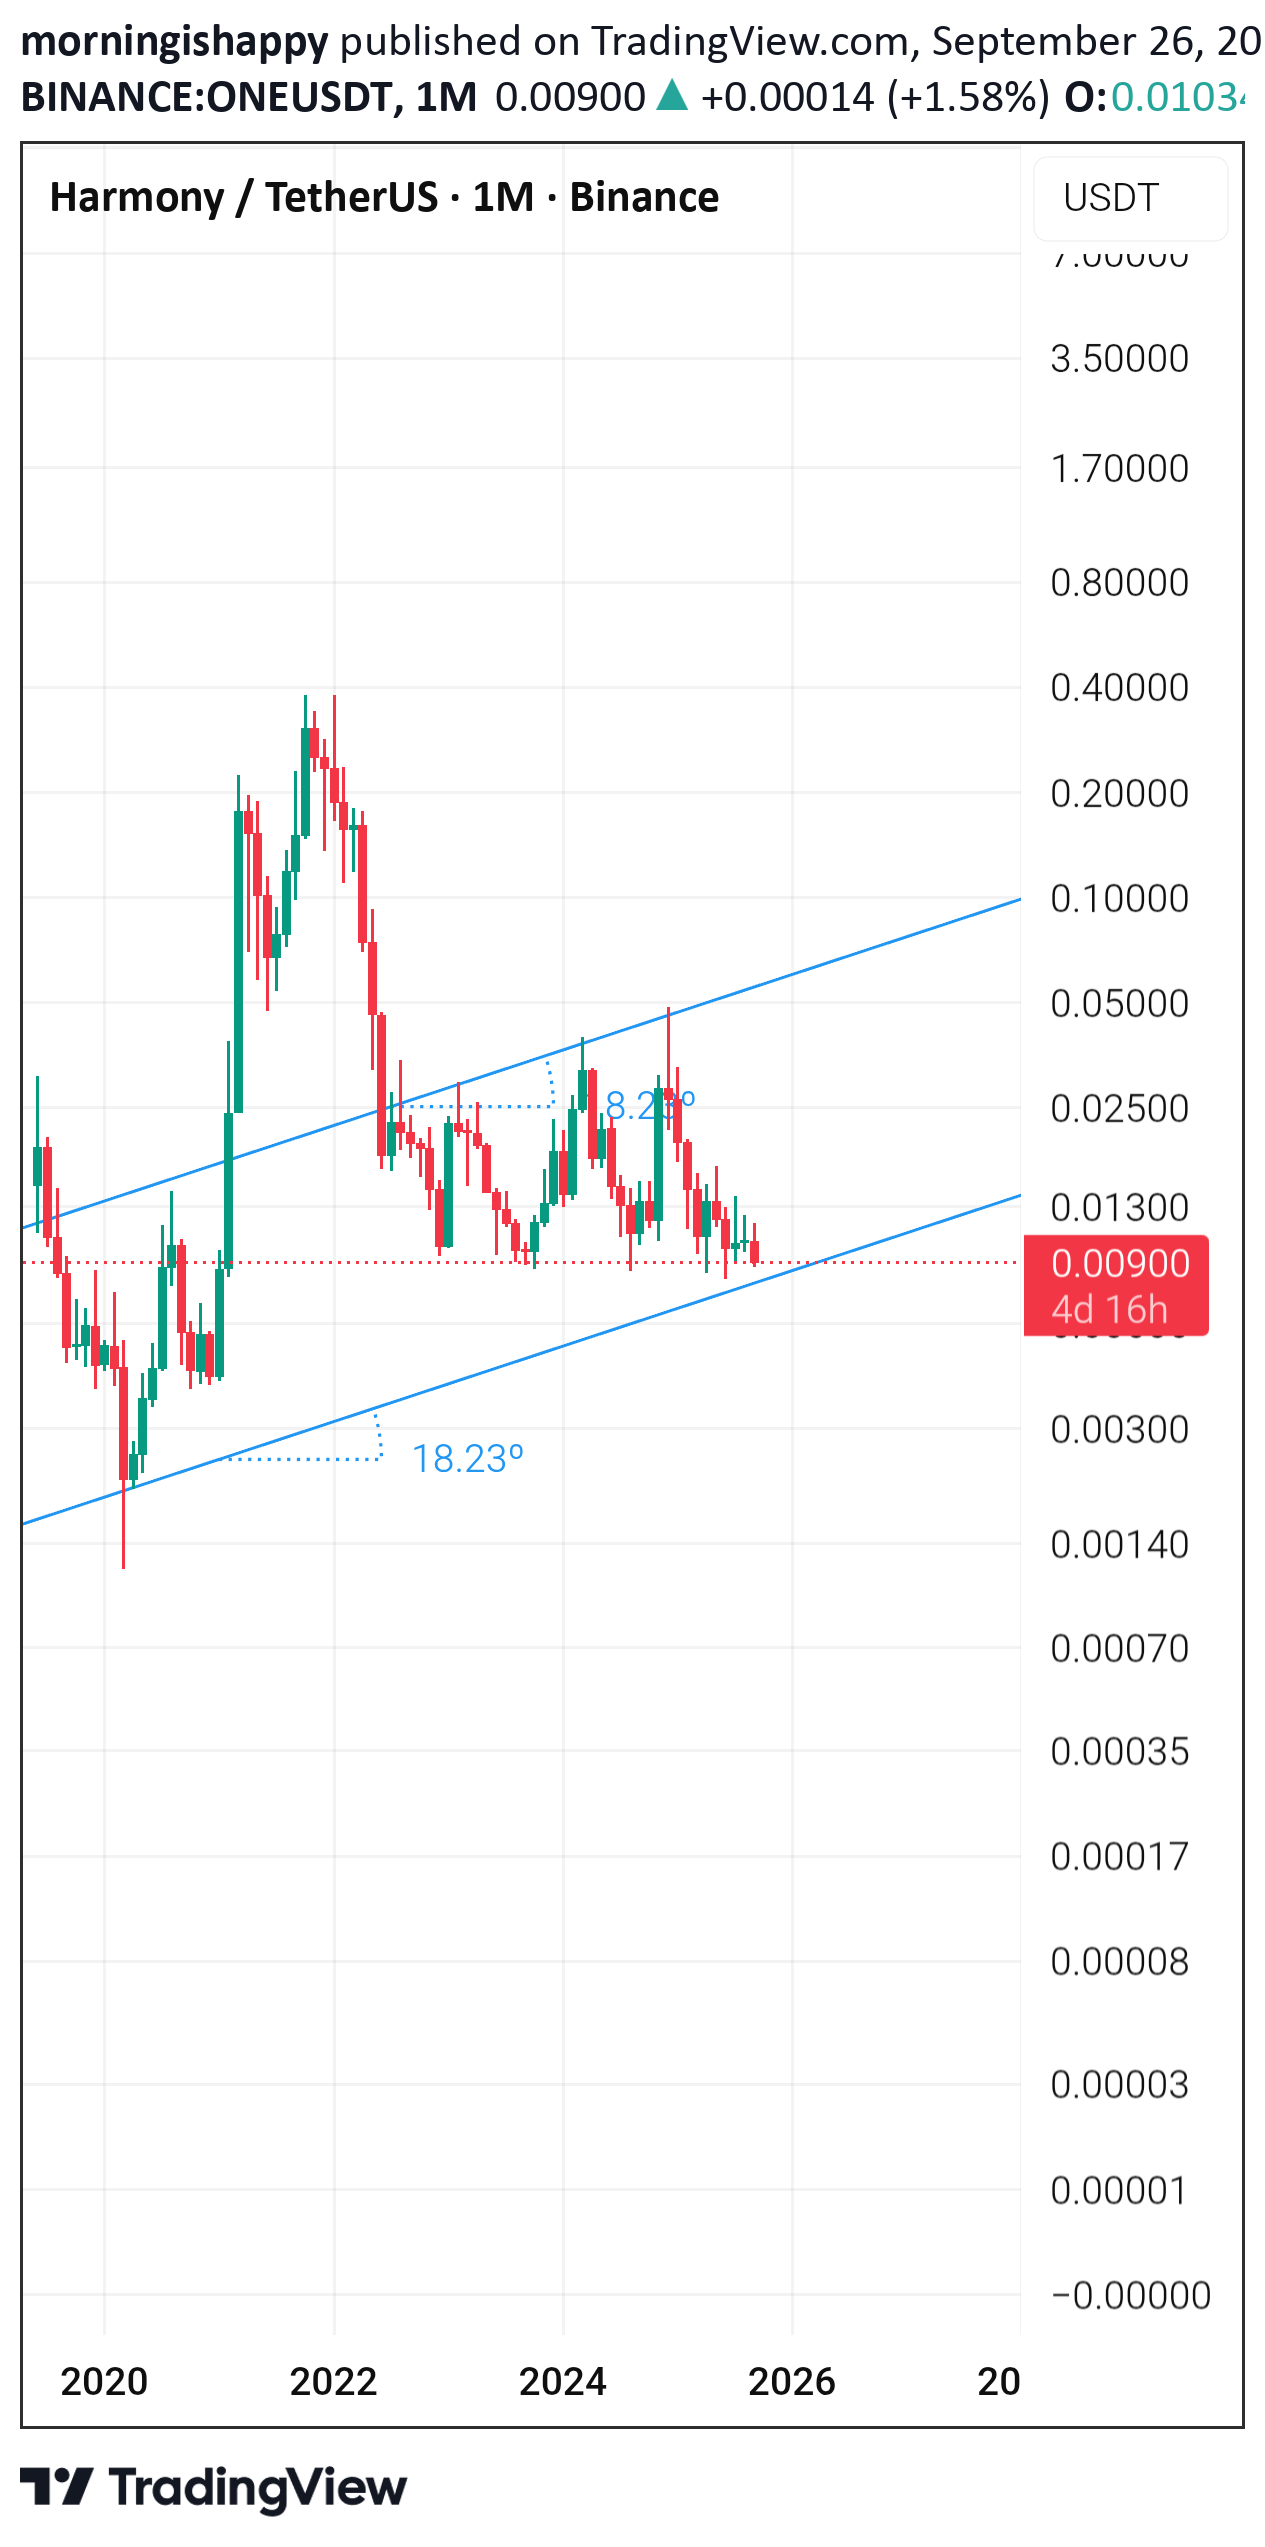
این نمودار در بازه زمانی ماهانه است. بنابراین شما باید برای پریدن بسیار صبور باشید.
سلب مسئولیت
هر محتوا و مطالب مندرج در سایت و کانالهای رسمی ارتباطی سهمتو، جمعبندی نظرات و تحلیلهای شخصی و غیر تعهد آور بوده و هیچگونه توصیهای مبنی بر خرید، فروش، ورود و یا خروج از بازارهای مالی نمی باشد. همچنین کلیه اخبار و تحلیلهای مندرج در سایت و کانالها، صرفا بازنشر اطلاعات از منابع رسمی و غیر رسمی داخلی و خارجی است و بدیهی است استفاده کنندگان محتوای مذکور، مسئول پیگیری و حصول اطمینان از اصالت و درستی مطالب هستند. از این رو ضمن سلب مسئولیت اعلام میدارد مسئولیت هرنوع تصمیم گیری و اقدام و سود و زیان احتمالی در بازار سرمایه و ارز دیجیتال، با شخص معامله گر است.