
DYDX
دی وای دی ایکس
| تریدر | نوع سیگنال | حد سود/ضرر | زمان انتشار | مشاهده پیام |
|---|---|---|---|---|
 CryptoWithJamesرتبه: 32143 | خرید | حد سود: تعیین نشده حد ضرر: تعیین نشده | ۱۴۰۴/۱۰/۱۳ |
نمودار قیمت دی وای دی ایکس
سود ۳ ماهه :
خلاصه سیگنالهای دی وای دی ایکس
سیگنالهای دی وای دی ایکس
فیلتر
مرتب سازی پیام براساس
نوع پیام
نوع تریدر
فیلتر زمان
CryptoWithJames
DYDXUSDT UPDATE

#DYDX به روز رسانی DYDX راه اندازی فنی الگو: الگوی گوه سقوط قیمت فعلی: 0.1915 دلار قیمت هدف: 0.3428 دلار درصد سود: 79.16 درصد تجزیه و تحلیل فنی: DYDX از یک الگوی گوه در حال سقوط در نمودار 1 بعدی خارج می شود و پتانسیل صعودی را نشان می دهد. قیمت پس از یک روند نزولی طولانی مدت شروع به بازیابی مقاومت گوه ای کرده است و ساختار نشان دهنده تغییر حرکت به سمت بالا است. move پیش بینی شده با هدف اندازه گیری شده نشان داده شده در نمودار مطابقت دارد. بازه زمانی: 1 بعدی نکته مدیریت ریسک: همیشه از مدیریت ریسک مناسب استفاده کنید.

Leo524
Is $DYDX Finally Waking Up After 3 Years ??

است DYDX بالاخره بعد از 3 سال بیدار شدی ?? 📌 DYDX تقریباً 3 سال است که در یک روند نزولی قوی بوده است، قیمت از 7 دلار به 0.16 دلار کاهش یافته است. 📌 در حال حاضر، قیمت در یک منطقه حمایت بلند مدت major قرار دارد، جایی که فشار فروش ضعیف به نظر می رسد. 📌 در نمودار، قیمت در حال شکل گیری یک الگوی گوه نزولی است که معمولا نزدیک به انتهای یک روند نزولی ظاهر می شود. 📌 طرف بنیادی نیز مثبت می شود 🔥 • dYdX رای تخفیف ضرر (تخفیف انحلال). • dYdX Solana گسترش معاملات نقطه ای ✅ اینها نشانه های صعودی برای اعتماد بلند مدت هستند 📌 برای اینکه بازار صعودی شود، این منطقه حمایتی باید حفظ شود و قیمت خط روند نزولی بلندمدت را بشکند. 📌 نتیجه گیری نهایی: پشتیبانی + خبر مثبت = شانس بهبودی خوب 🧠چرا این دو DYDX موضوع خبر؟؟؟ 🔥💸 1.dYdX تخفیف ضرر (تخفیف انحلال) رای 📌چه اتفاقی افتاد: انجمن dYdX یک برنامه تخفیف موقت ضرر را تأیید کرد. اگر معاملهگران منحل شوند، بخشی از زیان آنها بازپرداخت میشود. این به معاملهگران کمک میکند در بازارهای پر نوسان احساس امنیت بیشتری داشته باشند. 🔗 منبع blockchain.news/flashnews/dydx-dydx-on-chain-governance-vote-1-month-liquidation-rebate-pilot-to-1m-targeted-for-dec-1-2025?utm_source=chatgpt.com چرا این می تواند به قیمت کمک کند: • معامله گران احساس امنیت بیشتری می کنند ← تجارت بیشتری انجام دهند • فعالیت معاملاتی بیشتر → حجم بیشتر • حجم بیشتر → تقاضای بیشتر برای DYDX اعتماد به نفس فعالیت می آورد – و فعالیت از قیمت پشتیبانی می کند 2. dYdX Solana گسترش معاملات نقطه ای 📌چه اتفاقی افتاد: dYdX تجارت نقطهای را در Solana راهاندازی کرد. اکنون کاربران میتوانند توکنهای رمزنگاری معمولی را معامله کنند – نه تنها دائمی. این پلتفرم را به روی انواع بیشتری از معاملهگران باز میکند. 🔗 منبع (کپی پیست): dydx.xyz/blog/solana-spot-trading-is-now-live-on-dydx?utm_source=chatgpt.com چرا این می تواند به قیمت کمک کند: • معاملات نقطه ای کاربران جدید را جذب می کند • ویژگی های بیشتر → اکوسیستم بزرگتر • کاربران بیشتر → تقاضای بیشتر برای DYDX

MyCryptoParadise
DYDX About to Explode or Collapse?

بله، آیا دیده اید که #DYDX در حال حاضر چه کاری انجام می دهد؟ جای این کتاب درسی که در حال سقوط است رو به اتمام است، و move بعدی یا دیر فروشندگان را به دام میاندازد یا گاوهای نر در حاشیه را در تعقیب رها میکند. 💎#DYDXUSDT از الگوی گوه سقوط خود خارج شده است، و ما اکنون منتظر یک آزمایش مجدد تمیز از منطقه شکست هستیم. پس از تایید مجدد آن، احتمال ادامه صعودی بسیار زیاد است move. 💎پیش از این شاهد افت قیمت به زیر سطح حمایت نزولی بودیم، اما این شکست به سرعت توسط خریداران جذب شد و فیلمنامه را تغییر داد و نشانههای اولیه فرسودگی فروشنده را آشکار کرد. این نوع شکست ناموفق یک سیگنال کلاسیک از قدرت تقاضا است. 💎 آنچه حتی بیشتر از آن گویا است، واکنش در منطقه تقاضا است. بهجای وحشت یا انحلالهای آبشاری، شاهد رد چندگانه از یک منطقه پشتیبانی هستیم - سیگنال واضحی مبنی بر اینکه انباشت در جریان است. 💎 اگر قیمت از اینجا به بالا ادامه دهد و گوه را دوباره با موفقیت آزمایش کند، تغییر در کنترل بازار را تایید می کند. اولین هدف منطقه مقاومت جزئی است، و از آنجا، هر شکستی که با افزایش حجم پشتیبانی میشود، میتواند باعث گسترش شدید move به سمت ناحیه مقاومت major بعدی شود. اینجاست که حرکت می تواند به سرعت شتاب بگیرد. این تز صعودی تا زمانی که منطقه تقاضای فعلی ثابت بماند، معتبر باقی می ماند. با این حال، شکستن تمیز و بسته شدن در زیر این ناحیه، تنظیمات را باطل میکند و در را برای اصلاح عمیقتر باز میکند. MyCryptoParadise موفقیت را احساس کنید🌴

CobraVanguard


Bithereum_io
تحلیل تکنیکال DYDX: فرصت انفجار قیمت با شکستن الگوی گوه نزولی!
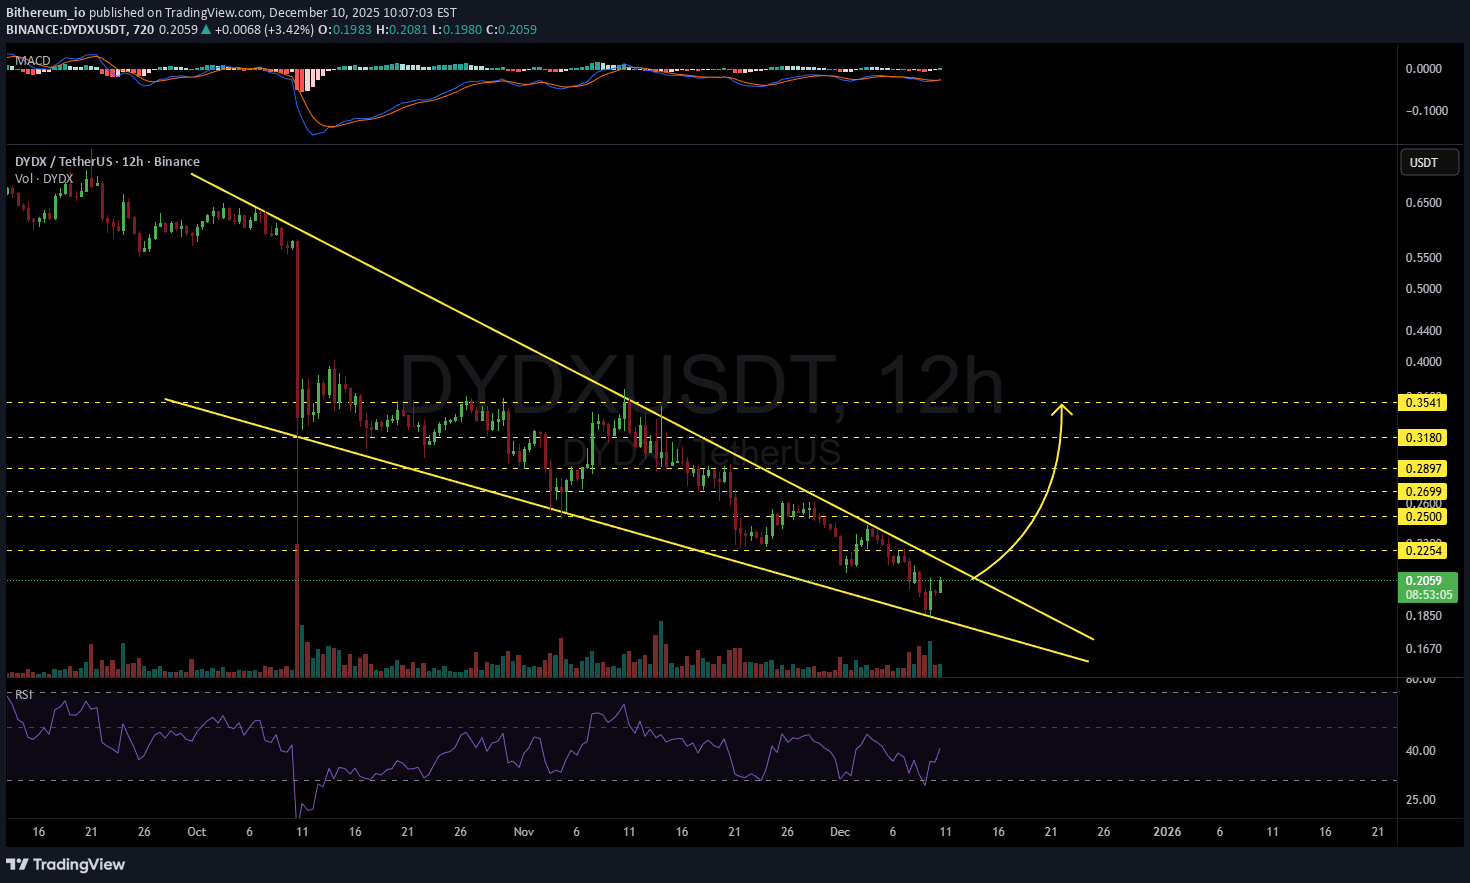
#DYDX درون یک الگوی گوه در حال سقوط در بازه زمانی 12H حرکت می کند. در صورت شکست بالای مقاومت گوه، اهداف صعودی بالقوه عبارتند از: 🎯 0.2254 دلار 🎯 0.2500 دلار 🎯 0.2699 دلار 🎯 0.2897 دلار 🎯 0.3180 دلار 🎯 0.3541 دلار ⚠️ همیشه به یاد داشته باشید که از استاپ ضرر محکم استفاده کنید و مدیریت ریسک مناسب را حفظ کنید.

BandForBands
پیشبینی انفجاری DYDX: منتظر جهش ۱۰۰۰ درصدی باشید!

در حال تشکیل یک الگوی گوه نزولی (Descending Wedge) دقیق است و فشار لازم برای یک جهش صعودی را جمع میکند. به محض شکستن مقاومت، این تنظیمات (سِتاپ) پتانسیل ۱۰۰۰ درصد سود را نسبت به قیمت فعلی نشان میدهد. تکانه (مومنتوم) در حال فشردهسازی است و این نمودار آمادهی یک بریکاوت بزرگ به نظر میرسد.

CHOWTRADE
تصمیم بزرگ dYdX: افزایش ۷۵ درصدی بازخرید توکن، اما آیا قیمت بالا میرود؟
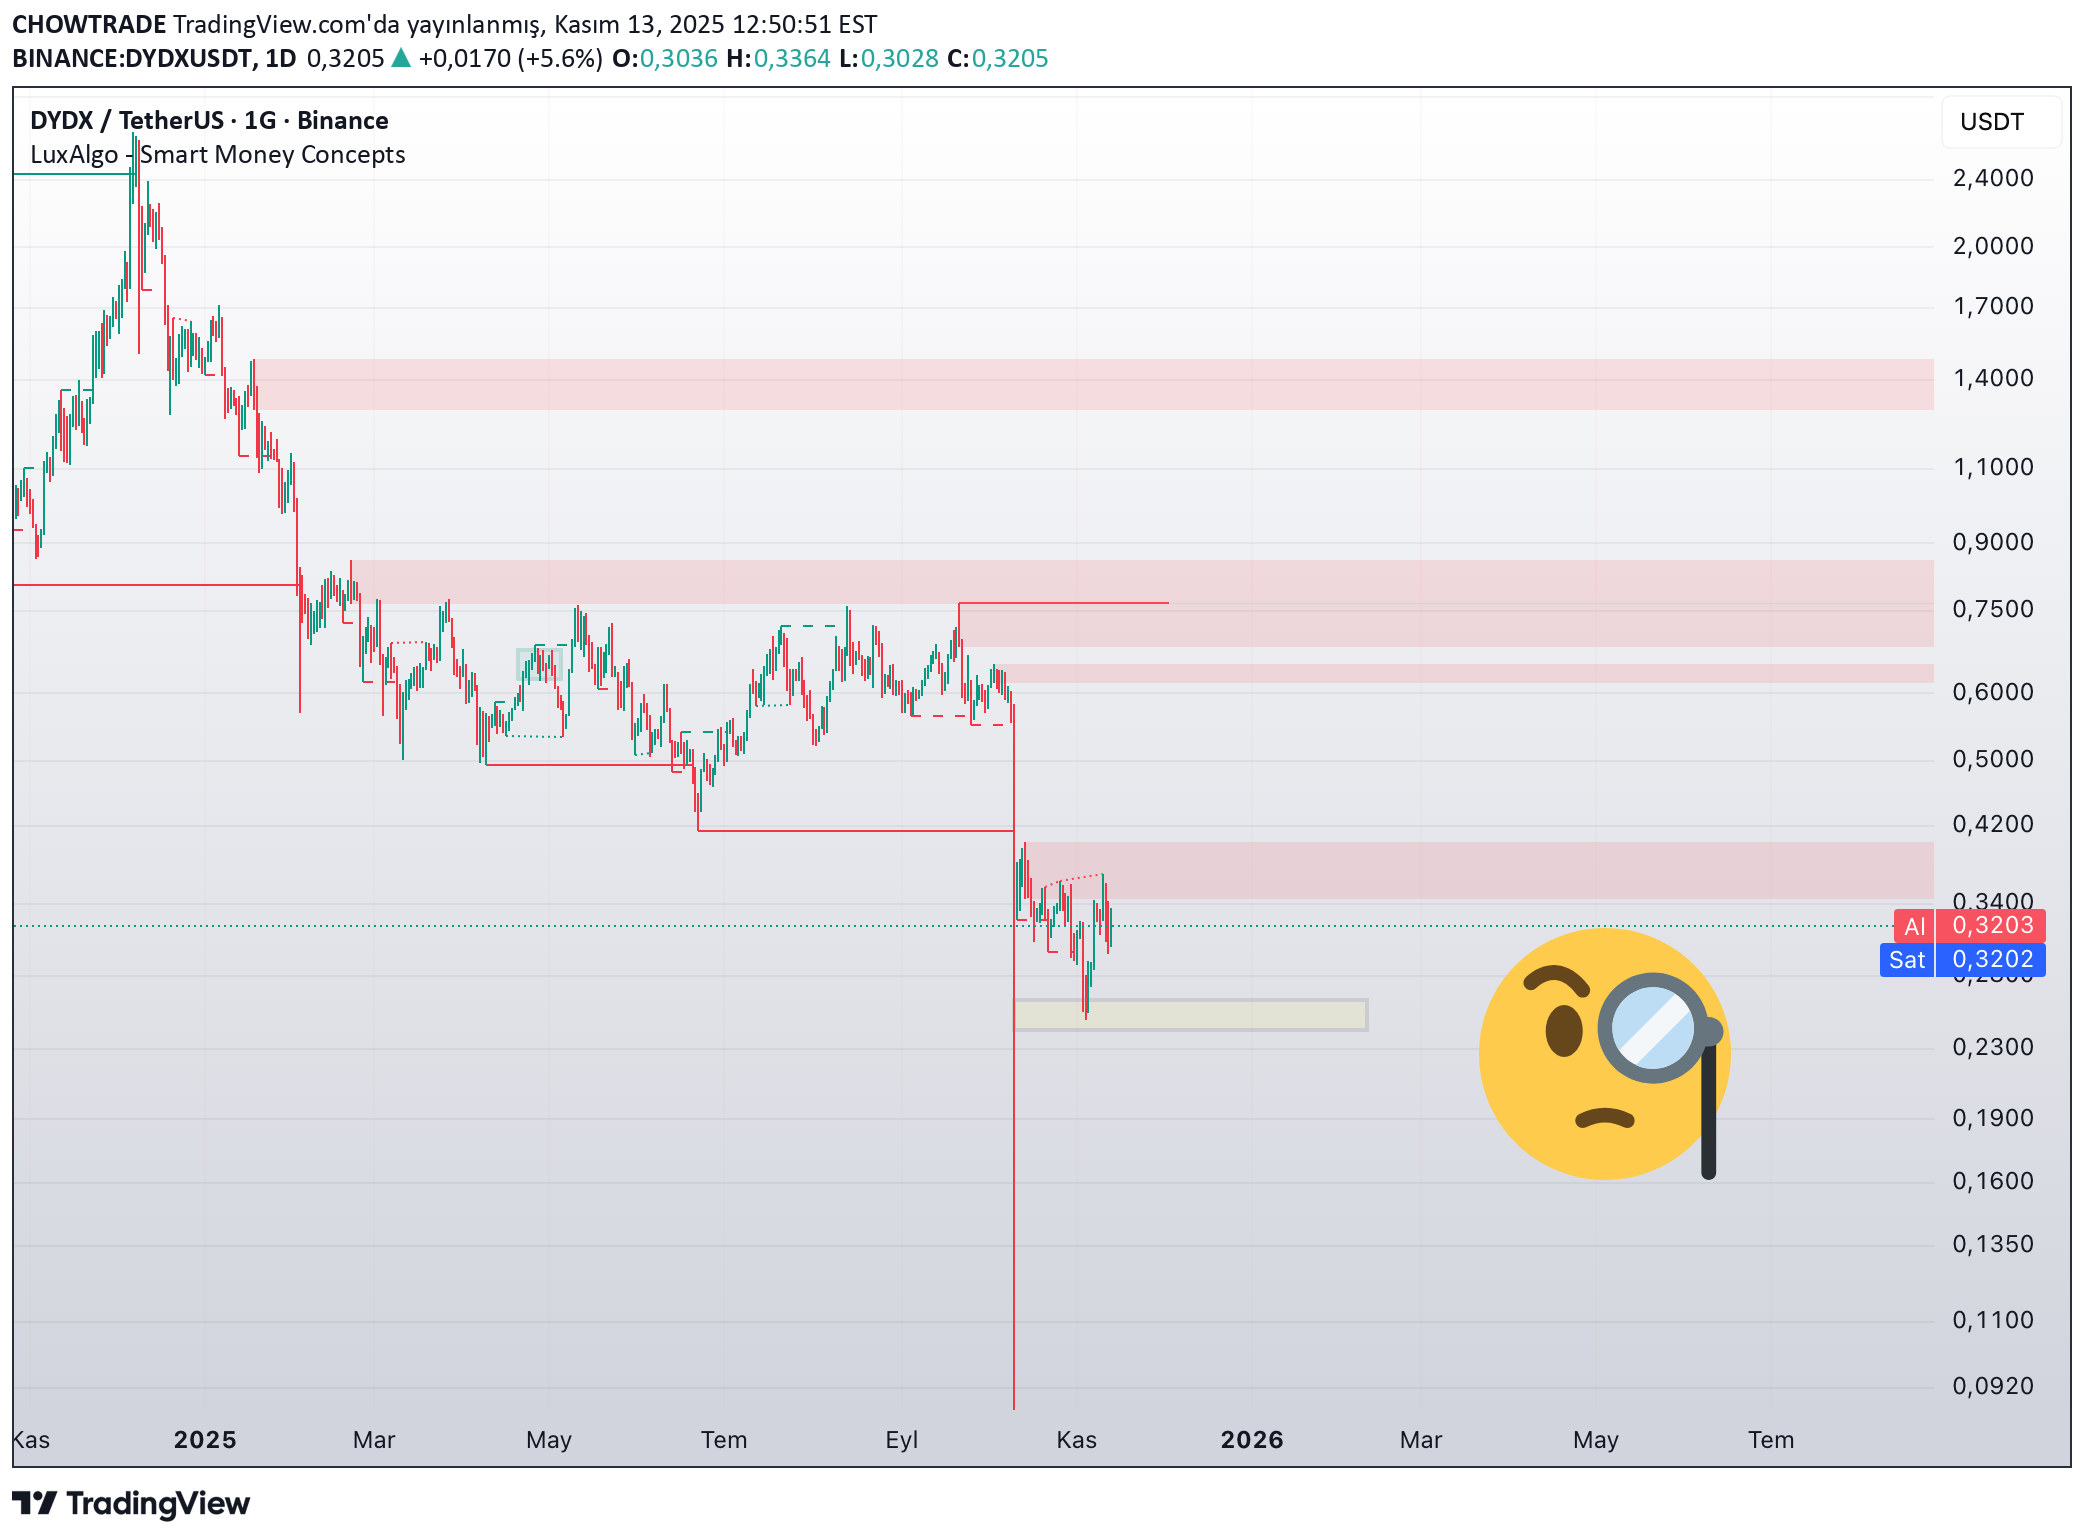
جامعهی dYdX برای افزایش بازخرید توکن از ۲۵٪ به ۷۵٪ از کارمزدهای پروتکل رأی داد — این تصمیم فوراً عملیاتی شد. این خبر گاوی به نظر میرسد، اما نمودار چیز دیگری میگوید: پس از ریزش از ۱.۳ دلار، DYDX همچنان نمیتواند در بالای ناحیهی عرضهی ۰.۳۵ تا ۰.۳۸ دلاری تثبیت شود. تا زمانی که زیر این ناحیه قرار داریم، هیچ "To the Moon"ی در کار نیست، فقط نویز است. 🧠 سناریوی محتمل: جذب (سوئیپ) نقدینگی در ۰.۲۵ تا ۰.۲۷ دلار. ورود کاملاً احساسی در ۰.۳۳ دلار و بالاتر. 📊 نظر من: سناریوی اصلی: محدودهی ۰.۲۵ تا ۰.۳۸ دلار. گاوی: شکست بالای ۰.۴۰ دلار → هدف ۰.۶ دلار. خرسی: زیر ۰.۲۵ دلار → تست ۰.۱۸ دلار. مانند همیشه: اخبار صرفاً نویز هستند و سطوح (قیمتی) برای حرکت طراحی شدهاند.
CHOWTRADE
تصمیم بزرگ dYdX: افزایش 3 برابری بازخرید توکن! (آیا قیمت بالا میرود؟)
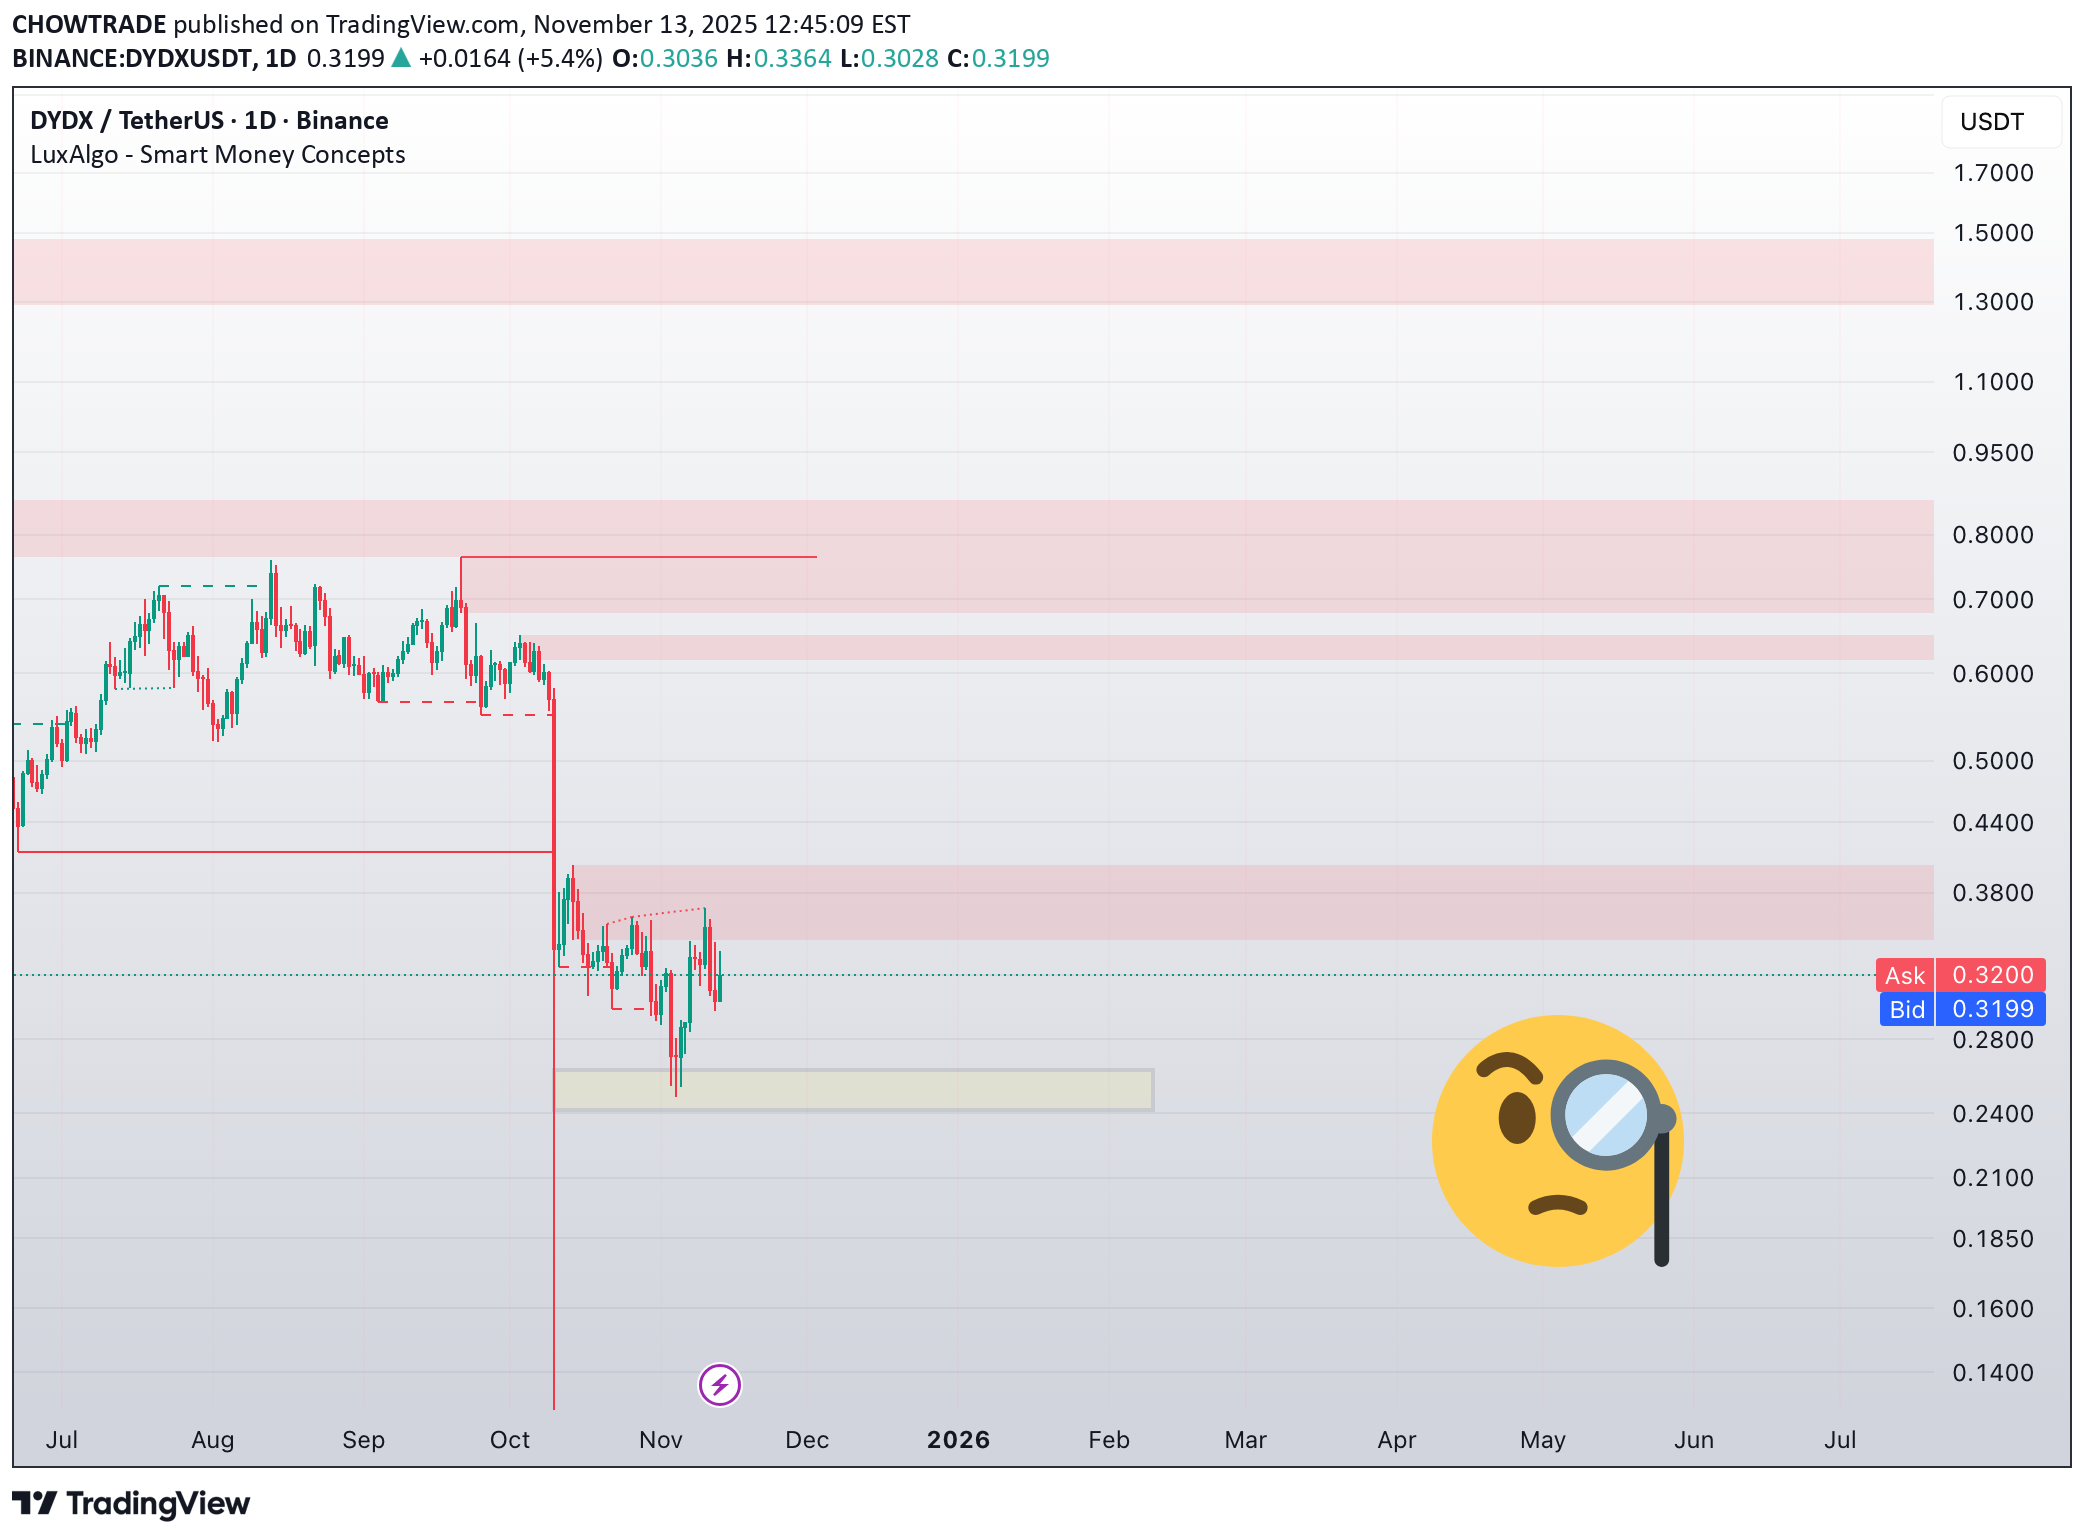
🧩 DYDX / USDT کامیونیتی dYdX رأی داد تا بازخرید توکنها از ۲۵٪ به ۷۵٪ از کارمزدهای پروتکل افزایش یابد، و این بلافاصله اجرایی میشود. به نظر صعودی (بولیش) میرسد، اما چارت مخالف آن است؛ پس از افت شدید (دامپ) از ۱.۳ دلار، DYDX همچنان نمیتواند بالای منطقه عرضه ۰.۳۵ تا ۰.۳۸ دلار تثبیت شود. تا زمانی که زیر این سطح هستیم، خبری از "تا ماه" (صعود انفجاری) نیست، و این صرفاً یک نویز است. 🧠 سناریوی احتمالی: ۰.۲۵ تا ۰.۲۷ دلار، جایی که میتوان نقدینگی را جذب کرد. ۰.۳۳ دلار و بالاتر، احساسات محض است و نقطه ورود مناسبی نیست. 📊 تحلیل من: پایه: محدوده ۰.۲۵ تا ۰.۳۸ دلار صعودی (بولیش): شکست بالای ۰.۴۰ دلار → حرکت به سمت ۰.۶ دلار نزولی (برایش): افت به زیر ۰.۲۵ دلار → تست سطح ۰.۱۸ دلار مثل همیشه: اخبار برای هیجانسازی، و سطوح برای تعیین حرکت.

weslad
جمع شدن غول ارز دیجیتال DYDX: آیا شاهد رالی سه رقمی خواهیم بود؟

DYDXUSDT پس از جهش از ناحیه تقاضای شدید، تابآوری قابل توجهی از خود نشان داده است؛ جایی که خریداران قوی وارد عمل شدند تا فاز نهایی کاهش را جذب کنند. از آن زمان، قیمت در حال شکلدهی یک الگوی «کف گرد» (Rounding Bottom) مشخص بوده است، ساختاری کلاسیک که اغلب سیگنالدهنده آغاز یک تغییر روند بلندمدت است. برنامه ما همچنان انباشت در محدوده انباشت تعریفشده باقی میماند، که از نظر فنی یک پایه محکم برای موج صعودی آتی را تشکیل میدهد. هدف فوری، ناحیه عرضه کلیدی است که در نمودار برجسته شده و سطحی است که احتمالاً اولین واکنش را برمیانگیزد. از دیدگاه ساختاری، این واکنش میتواند منجر به یک پولبک (عقبنشینی) کنترلشده شود و به طور بالقوه الگوی «سر و شانه معکوس» (ISHS) را شکل دهد. چنین ترکیبی به عنوان یک ساختار قدرتمند ادامهدهنده صعودی عمل کرد؛ ساختاری که میتواند [این دارایی را] در چرخه گستردهتر، به قلمرو سهرقمی سوق دهد. صبر و موقعیتگیری این فاز را تعریف کرد. پول هوشمند قبل از آنکه عموم متوجه شوند، به آرامی انباشت میکند.

Literaryflavus
آیا DYDX سرطان است؟ آیندهی ارز دیجیتال در هالهای از ابهام!

نمودار فاجعه است، اما به نظرم اگر قرار به بازگشت باشد، از همین حوالی باز گشت. این توصیه سرمایهگذاری نیست؛ خودتان تحقیق کنید.
سلب مسئولیت
هر محتوا و مطالب مندرج در سایت و کانالهای رسمی ارتباطی سهمتو، جمعبندی نظرات و تحلیلهای شخصی و غیر تعهد آور بوده و هیچگونه توصیهای مبنی بر خرید، فروش، ورود و یا خروج از بازارهای مالی نمی باشد. همچنین کلیه اخبار و تحلیلهای مندرج در سایت و کانالها، صرفا بازنشر اطلاعات از منابع رسمی و غیر رسمی داخلی و خارجی است و بدیهی است استفاده کنندگان محتوای مذکور، مسئول پیگیری و حصول اطمینان از اصالت و درستی مطالب هستند. از این رو ضمن سلب مسئولیت اعلام میدارد مسئولیت هرنوع تصمیم گیری و اقدام و سود و زیان احتمالی در بازار سرمایه و ارز دیجیتال، با شخص معامله گر است.