
ZIL
زیلیکا
| تریدر | نوع سیگنال | حد سود/ضرر | زمان انتشار | مشاهده پیام |
|---|---|---|---|---|
 CryptoCoinsCoachرتبه: 14705 | خرید | حد سود: تعیین نشده حد ضرر: تعیین نشده | ۱۴۰۴/۹/۹ |
نمودار قیمت زیلیکا
سود ۳ ماهه :
سیگنالهای زیلیکا
فیلتر
مرتب سازی پیام براساس
نوع پیام
نوع تریدر
فیلتر زمان

CryptoAnalystSignal
#ZIL/USDT Descending channel ?

#ZIL قیمت در یک کانال نزولی در بازه زمانی 1 ساعته در حال حرکت است. به مرز پایینی رسیده است و در حال حرکت به سمت شکستن بالای آن است و انتظار میرود که مرز بالایی آزمایش مجدد شود. ما یک روند نزولی در اندیکاتور RSI داریم که نزدیک به مرز پایینی رسیده است و انتظار می رود یک بازگشت صعودی داشته باشد. یک منطقه حمایت کلیدی به رنگ سبز در 0.00470 وجود دارد. قیمت چندین بار از این منطقه جهش کرده است و انتظار می رود که دوباره افزایش یابد. ما یک روند به سمت تثبیت بالاتر از میانگین متحرک 100 دوره ای داریم، زیرا به آن نزدیک می شویم، که از movement صعودی پشتیبانی می کند. قیمت ورودی: 0.00486 هدف اول: 0.00494 هدف دوم: 0.00504 هدف سوم: 0.00515 توقف ضرر: زیر ناحیه حمایت به رنگ سبز. یک چیز ساده را فراموش نکنید: مدیریت سرمایه. برای سوالات لطفا نظر بدهید ممنون.#ZIL هدف اول: 0.00494 رسیده است هدف دوم: 0.00504 رسیده است هدف سوم: 0.00515 رسیده است
CryptoAnalystSignal
#ZIL/USDT Descending channel ?
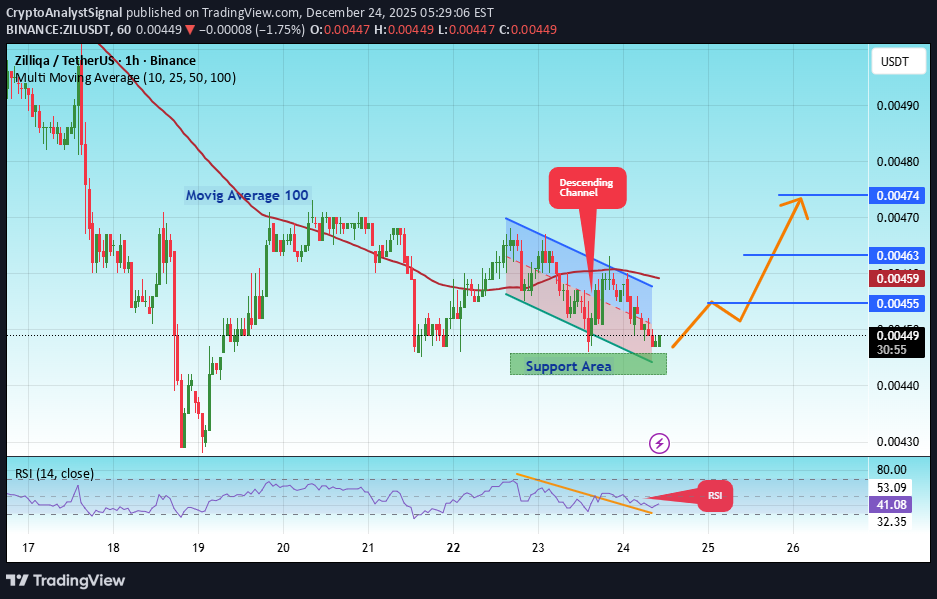
#ZIL قیمت در یک کانال نزولی در بازه زمانی 1 ساعته در حال حرکت است. به مرز پایینی رسیده است و در حال حرکت به سمت شکستن بالای آن است و انتظار میرود که مرز بالایی آزمایش مجدد شود. ما یک روند نزولی در اندیکاتور RSI داریم که نزدیک به مرز پایینی رسیده است و انتظار می رود یک بازگشت صعودی داشته باشد. یک منطقه حمایت کلیدی به رنگ سبز در 0.00444 وجود دارد. قیمت چندین بار از این منطقه جهش کرده است و انتظار می رود که دوباره افزایش یابد. ما یک روند به سمت تثبیت بالاتر از میانگین متحرک 100 دوره ای داریم، زیرا به آن نزدیک می شویم، که از movement صعودی پشتیبانی می کند. قیمت ورودی: 0.00449 هدف اول: 0.00455 هدف دوم: 0.00463 هدف سوم: 0.00474 یک اصل ساده را فراموش نکنید: مدیریت پول. سفارش توقف ضرر خود را در زیر ناحیه حمایت سبز قرار دهید. برای هر گونه سوال لطفا نظر بدهید. ممنون.#ZIL هدف اول: 0.00455 رسیده است هدف دوم: 0.00463 رسیده است هدف سوم: 0.00474 رسیده است
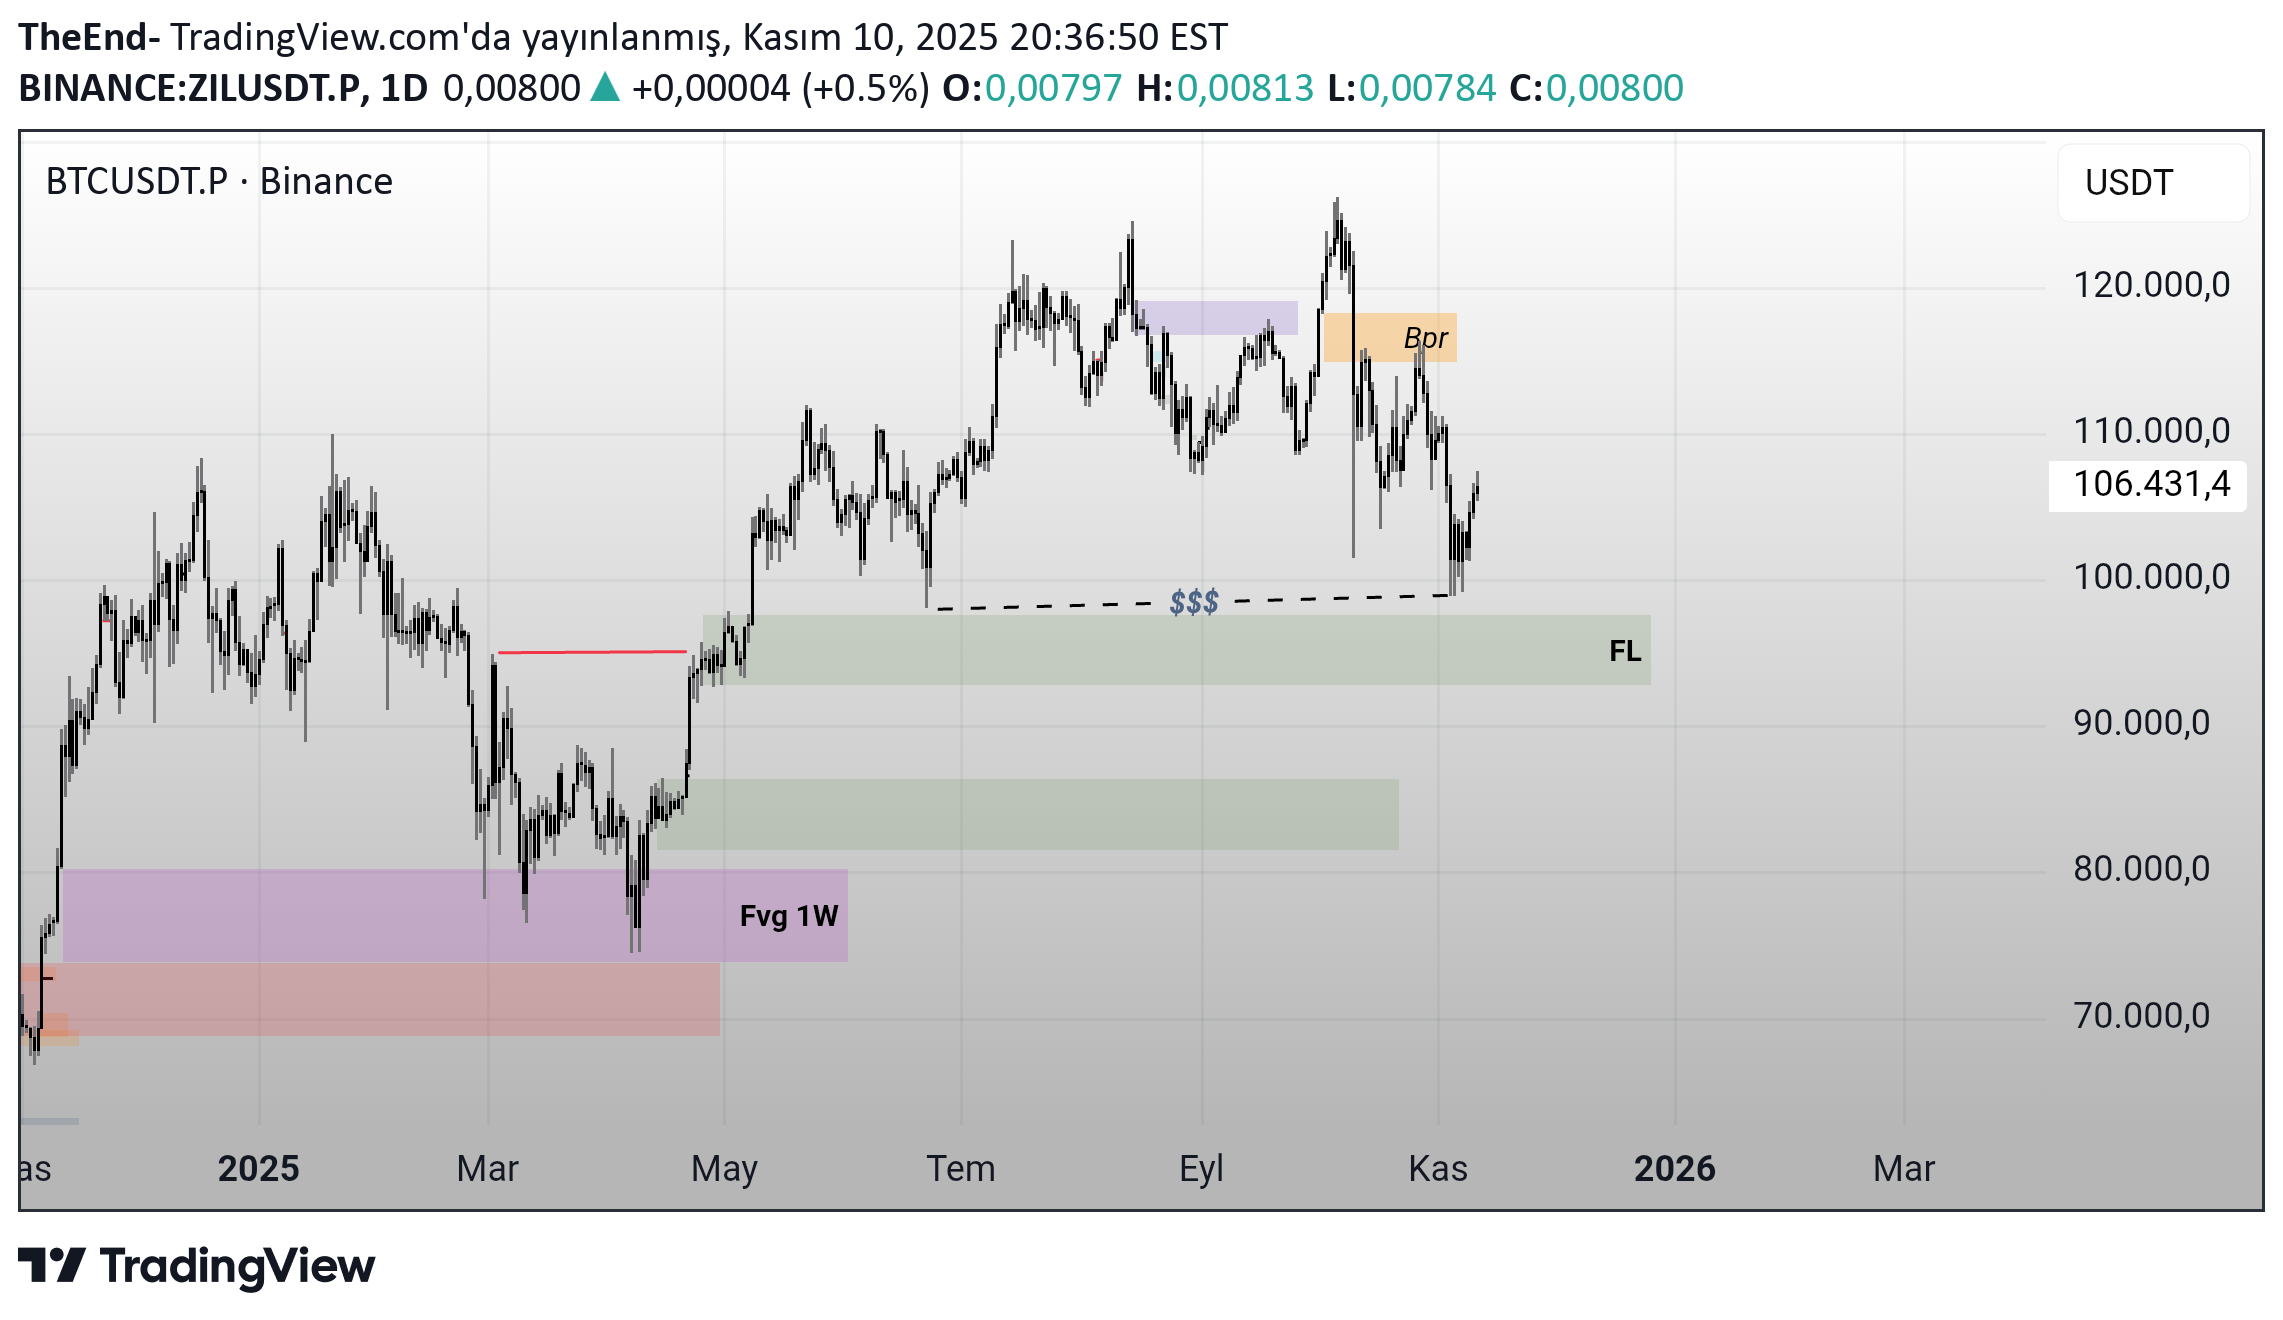
CryptoCoinsCoach
سقوط ZIL تمام شد؟ یک شکست همه چیز را عوض میکند!
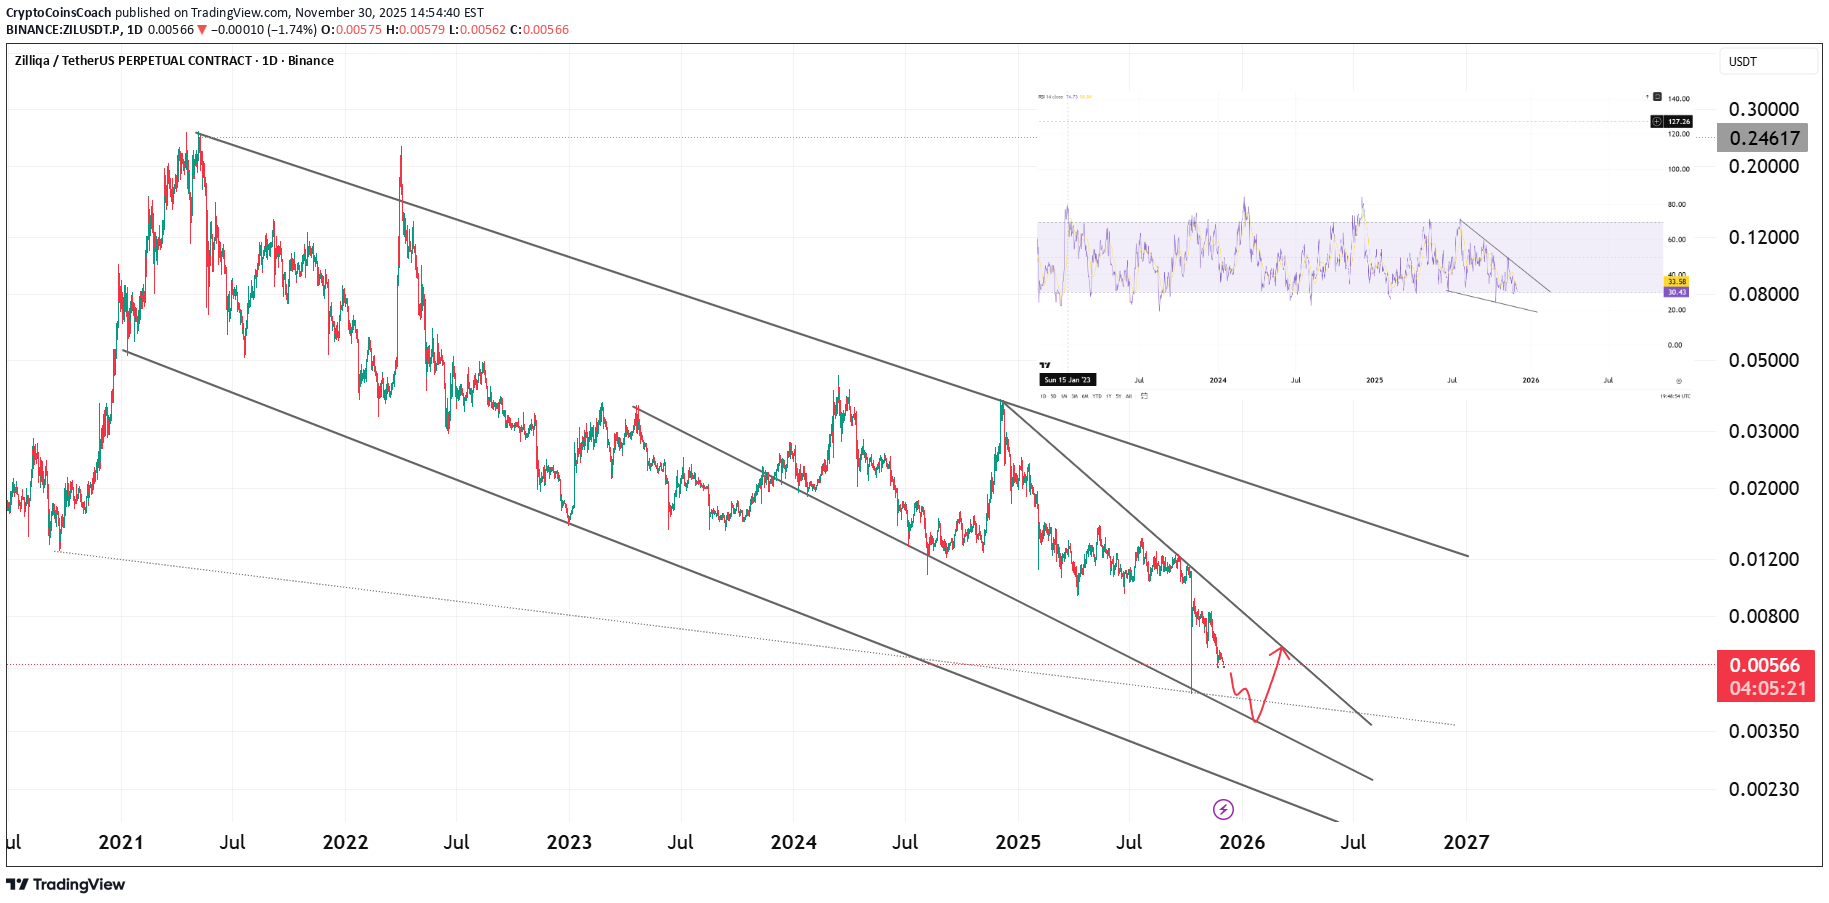
در حال حاضر [دارایی مورد نظر] درون یک کانال نزولی بزرگ چند ساله در حال معامله است و قیمت به مرز پایینی این ساختار فشار میآورد. این ناحیه از نظر تاریخی به عنوان کف چرخهای برای ZIL عمل کرده است، و واکنش فعلی با الگوی گستردهتر کاهش نوسانات و خستگی روند هماهنگ است. قیمت اخیراً خط حمایت پایینی کانال ماکرو را لمس کرده است، در حالی که RSI یک ساختار نزولی فشرده شونده را نشان میدهد. این ترکیب اغلب نشاندهنده تضعیف مومنتوم نزولی و تغییر روند قریبالوقوع پس از وقوع شکست است. تا زمانی که [دارایی مورد نظر] درون کانال نزولی باقی بماند، بازار تحت فشار بود. با این حال، این ساختار نشانههای اولیه انباشت را نشان میدهد، به ویژه زمانی که قیمت در کفهای شدید کانال معامله میشود و شروع به ایجاد لگهای نزولی کوتاهتری میکند. نکات فنی کلیدی: • قیمت در حال رسیدن به ناحیه تقاضای کانال ماکرو است. • RSI یک کنج نزولی فشرده شده را نشان میدهد که به بازگشت بالقوه اشاره دارد. • احساسات بازار همچنان خرسی است، اما ساختار از فرسودگی روند حمایت میکند. • بازیابی مجدد خط میانی کانال، تغییر صعودی را تقویت میکند. • سوئیپهای نقدینگی سمت نزولی قبل از شکست همچنان محتمل است. سناریوی اصلی: [دارایی مورد نظر] ممکن است قبل از تشکیل ساختار بازگشتی، یک شیرجه نقدینگی نهایی به سمت کف کانال داشته باشد. اگر قیمت پس از آن خط میانی را پس بگیرد و خط روند نزولی را بشکند، لگ صعودی بعدی میتواند با پتانسیل صعودی قابل توجهی آغاز شود. ابطال سناریو: یک شکست واضح به زیر کف کانال همراه با ادامه حرکت، سناریوی بازگشتی را باطل میکند و چرخه نزولی را گسترش میدهد. به زبان ساده: [دارایی مورد نظر] در کف شدید یک کانال نزولی چند ساله قرار دارد. RSI در حال فشرده شدن است. اگر از ساختار نزولی خارج شود، وارونگی روند کلان محتمل شد. تا آن زمان، انتظار نوسانات و سوئیپهای نقدینگی را داشته باشید.
CryptoAnalystSignal
پیشبینی انفجار زل (ZIL): شکست کانال نزولی و اهداف صعودی جدید!
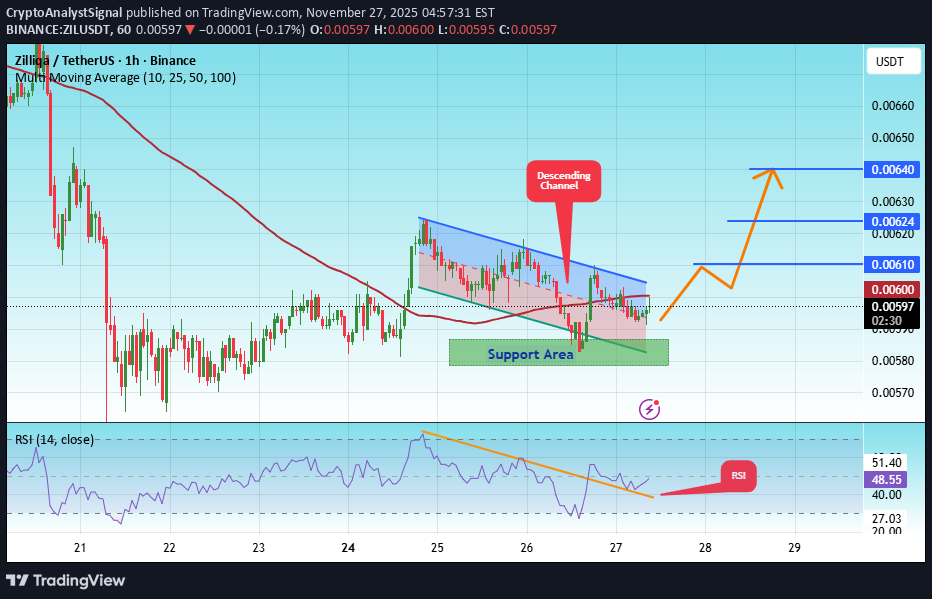
قیمت در حال حرکت در یک کانال نزولی در تایم فریم ۱ ساعته است. قیمت به مرز پایینی رسیده است و در حال حرکت به سمت شکستن آن به سمت بالاست، با انتظار آزمودن مجدد (پولبک) مرز بالایی. ما در شاخص RSI یک روند نزولی داریم که به نزدیکی حد پایینی رسیده و انتظار یک بازگشت صعودی وجود دارد. یک ناحیه حمایتی کلیدی به رنگ سبز در ۰.۰۰۵۸۰ وجود دارد. قیمت چندین بار از این ناحیه برگشت داشته است و انتظار میرود دوباره جهش کند. ما شاهد تمایل به تثبیت بالای میانگین متحرک ۱۰۰ دورهای هستیم، چرا که قیمت نزدیک به آن در حرکت است، که این امر از حرکت صعودی حمایت مینماید. قیمت ورود: ۰.۰۰۶۰۰ | هدف اول: ۰.۰۰۶۱۰ | هدف دوم: ۰.۰۰۶۲۴ | هدف سوم: ۰.۰۰۶۴۰ | یک اصل ساده را فراموش نکنید: مدیریت سرمایه. حد ضرر خود را زیر ناحیه حمایتی سبز رنگ قرار دهید. برای هرگونه سؤال، لطفاً کامنت بگذارید. سپاسگزارم.

SnipingRabbit
خرید فوری ZIL: فرصتی کوچک با پتانسیل حجم بالا!

معاملات شاد و موفقی داشته باشید!
CryptoAnalystSignal
تحلیل تکنیکال ZIL/USDT: آیا کانال صعودی ادامه مییابد؟ (اهداف و استراتژی ورود)
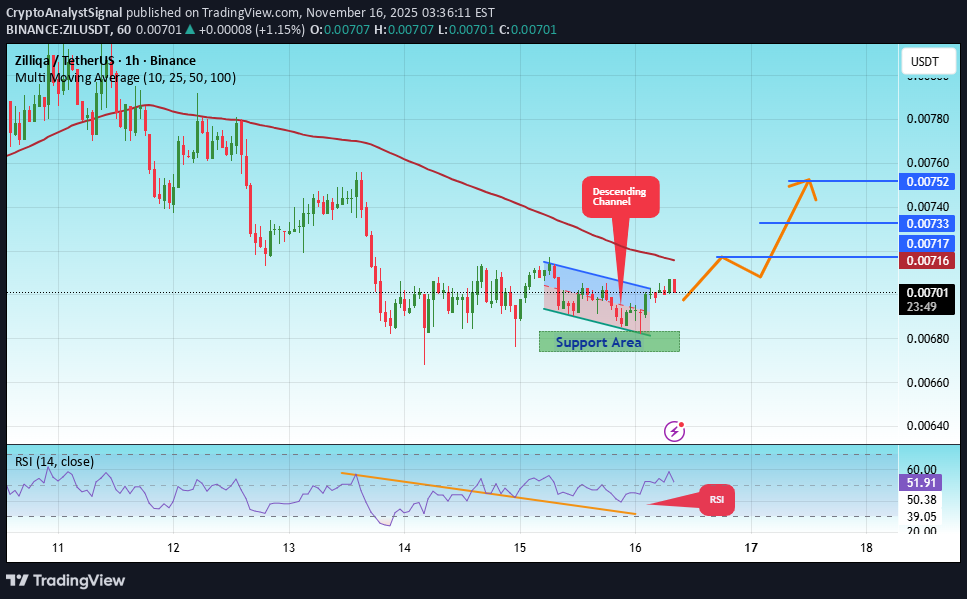
قیمت در تایم فریم ۱ ساعته در داخل یک کانال صعودی حرکت میکند و به خوبی از آن پیروی میکند. آماده است که به شدت از کانال خارج شده و آن را مجدداً تست کند (پولبک بزند). ما یک خط روند نزولی در اندیکاتور RSI داریم که در آستانه شکستن و پولبک زدن است، که این امر حرکت صعودی را تقویت میکند. یک ناحیه حمایتی کلیدی (به رنگ سبز) در 0.00680 وجود دارد که نشاندهنده یک نقطه حمایت قوی است. ما روند تثبیت قیمت بالاتر از میانگین متحرک ۱۰۰ دورهای را داریم. قیمت ورود: 0.00703 هدف اول: 0.00717 هدف دوم: 0.00733 هدف سوم: 0.00752 یک قانون ساده مدیریت سرمایه را فراموش نکنید: دستور حد ضرر (استاپ لاس) خود را زیر ناحیه حمایتی سبز قرار دهید. به محض رسیدن به هدف اول، مقداری سود سیو کنید (نقد کنید) و سپس حد ضرر خود را به قیمت ورود (نقطه سربه سر) تغییر دهید. در صورت داشتن هرگونه سوال، لطفاً کامنت بگذارید. متشکرم.

بیت کوین 1G: جهش قیمتی خیرهکننده در سال 2024! (یادآوری: سرمایهگذاری ریسک دارد)
توصیهی سرمایهگذاری نیست.

DragonCaoB
خرید پرقدرت ZIL: سیگنال صعودی قوی پس از شکست مثلث!
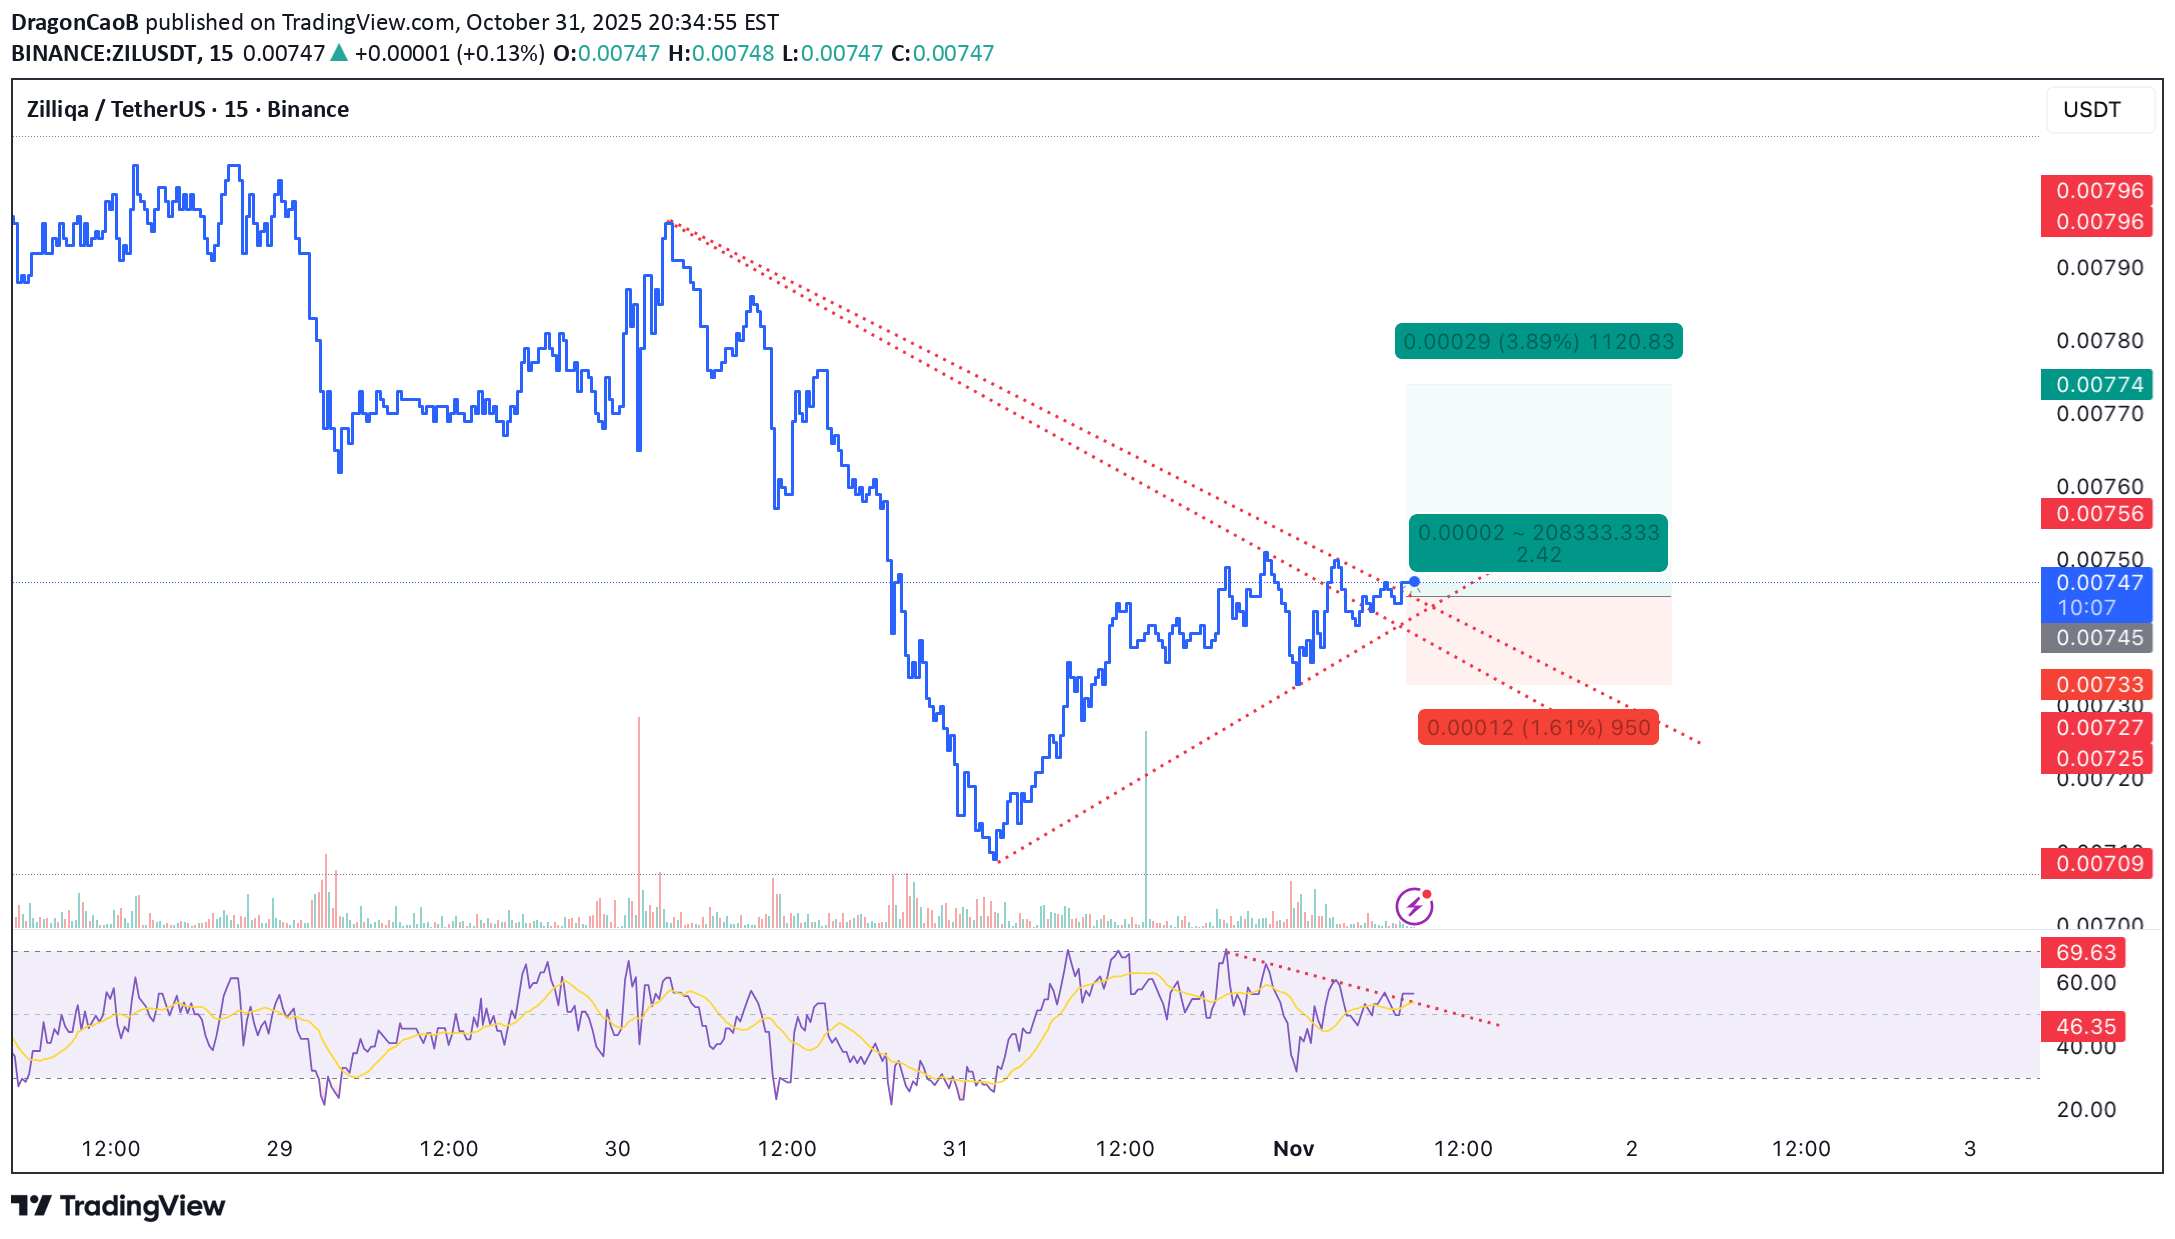
💎 معامله اسکالپ خرید (لانگ) – ZIL شاخص RSI از روند نزولی خود خارج شده و قیمت نیز الگوی مثلث را به سمت بالا شکسته است، که نشاندهنده یک تغییر صعودی واضح است. حجم خرید به شدت در حال افزایش است، که تأییدکننده شتاب قوی پشت move میباشد. 🎯 برنامه: ← ورود پس از تأیید تست مجدد شکست (سطح). ← حد سود (TP): 0.00774 | حد ضرر (SL): 0.00733 | نسبت ریسک به ریوارد (RR): 1 : 2.42 شتاب بازار از این موقعیت خرید پشتیبانی میکند. ورودیهای خود را دقیق حفظ کنید و با پیشرفت قیمت، حد ضرر (SL) را متحرک سازید (ریل کنید). صبور باشید — act تنها در صورت تأیید قدرت شکست (بریکآوت) انجام شود.
SnipingRabbit
فرصت خرید زنده پول (ZIL) با پتانسیل انفجاری؛ آیا قیمت دوباره اوج میگیرد؟
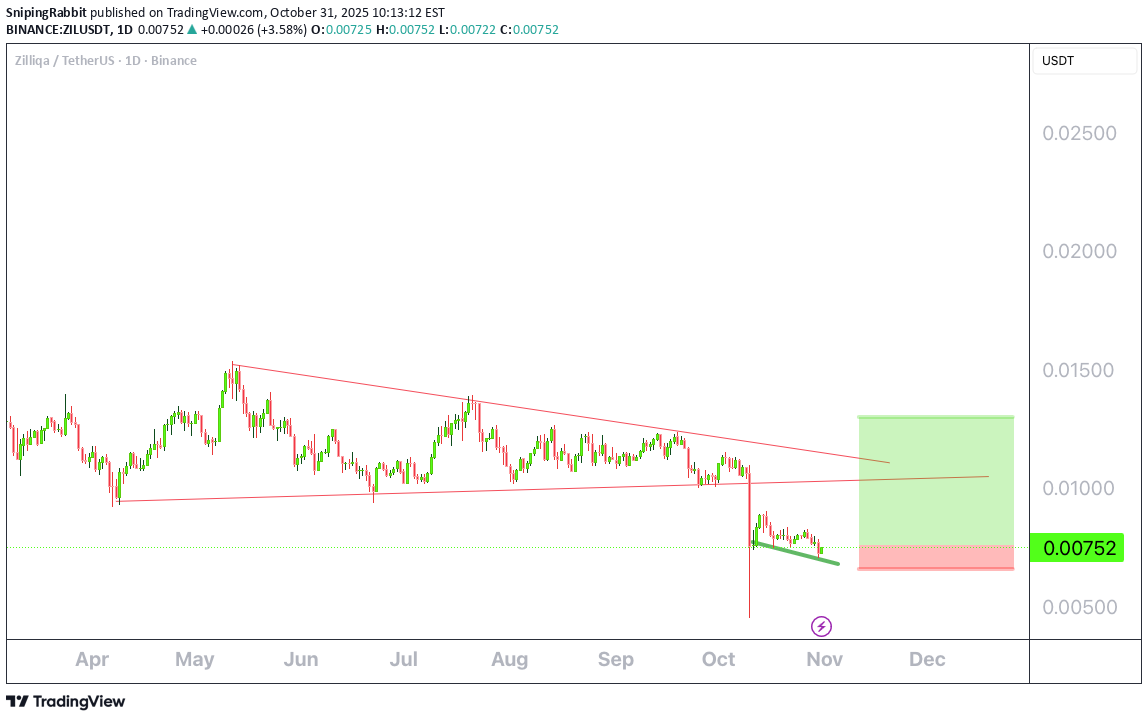
اسنایپینگربیت چند سال پیش، در یک معاملهی ۱.۵ میلیون دلاری حسابش صفر شد (لیکوئید شد)، اما اکنون به دنبال بازگشت و صعود مجدد بازار کریپتو است! معاملات پر سودی داشته باشید! معاملات پر سودی داشته باشید! معاملات پر سودی داشته باشید!
cryptosignalpnl
انفجار صعودی قریبالوقوع ZIL/USDT: منتظر شکست بزرگ در فیوچرز باشید!
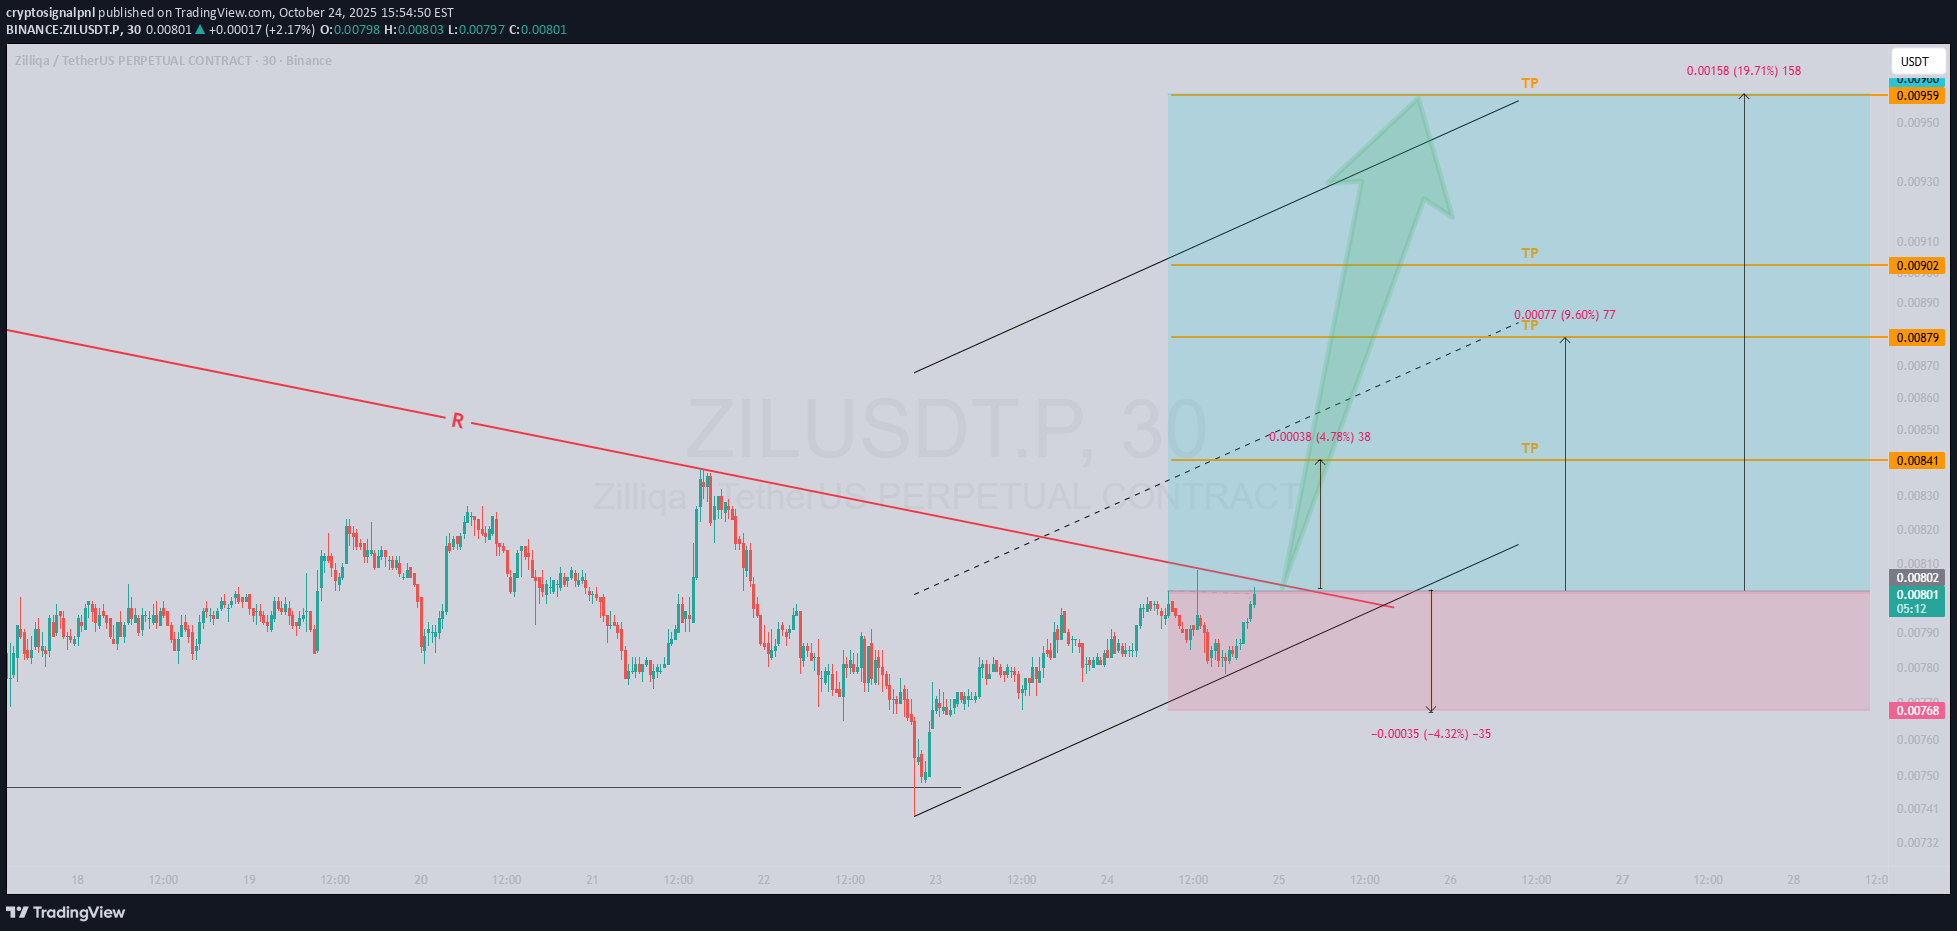
🚀 آتی ZIL/USDT: برای یک انفجار صعودی آماده شده است! 🚀 معامله گران، هیپ شوید! 🔥 این قاتل راه اندازی شده است ز ZIL/USDT Perpetual Futures در بازه زمانی 30 دقیقه ای قفل شده است، جایی که قیمت در برابر خط روند نزولی پیچیده می شود و فشار زیادی را برای شکست صعودی ایجاد می کند. ما در لبه صندلیهایمان هستیم و منتظر آن ضربهای تمیز بالای خط روند هستیم - و وقتی این اتفاق بیفتد (همانطور که شرط میبندیم این اتفاق بیفتد)، برای برخی از دستاوردهای جدی ادامه دارد! 📈 📊 Scoop راه اندازی: بازه زمانی: 30 دقیقه - مناسب برای مشاهده این بازی فشرده سازی. اقدام کلیدی: قیمت که خط روند نزولی را در آغوش میگیرد، آماده است تا به سمت بالا منفجر شود. تایید شکست = چراغ سبز برای ورود! پتانسیل سود: بدون اهرم، ما حداقل 4 درصد صعودی را دنبال می کنیم، با فضایی برای موشک تا 19 درصد. اهرم را به کار بیندازید، و این بازده ممکن است سر به فلک بکشد - در مورد چند برابر کردن برد خود صحبت کنید! 💥 این راهاندازی فرصتی را در دنیای بی ثبات ZIL فریاد میزند - پلک نزنید، یا ممکن است راهاندازی را از دست بدهید! ⚠️ سلب مسئولیت: توصیه مالی نیست - همیشه DYOR و هوشمندانه تجارت کنید. Crypto یک سواری wild است، بنابراین ریسک خود را مانند pro مدیریت کنید! 🚀 تجزیه و تحلیل حماسی + سیگنال ها؟ دنبال کن! ✅ 📊 هوس یک نمودار طلایی؟ Smash BOOST! ✅ 💬 ایده هایی دارید؟ نظر بدهید - ما به بهترین ها پاسخ می دهیم! ✅ دنبال = سود | Boost = نمودار طلا | نظر = دسترسی VIP! 😎توقف رسید
سلب مسئولیت
هر محتوا و مطالب مندرج در سایت و کانالهای رسمی ارتباطی سهمتو، جمعبندی نظرات و تحلیلهای شخصی و غیر تعهد آور بوده و هیچگونه توصیهای مبنی بر خرید، فروش، ورود و یا خروج از بازارهای مالی نمی باشد. همچنین کلیه اخبار و تحلیلهای مندرج در سایت و کانالها، صرفا بازنشر اطلاعات از منابع رسمی و غیر رسمی داخلی و خارجی است و بدیهی است استفاده کنندگان محتوای مذکور، مسئول پیگیری و حصول اطمینان از اصالت و درستی مطالب هستند. از این رو ضمن سلب مسئولیت اعلام میدارد مسئولیت هرنوع تصمیم گیری و اقدام و سود و زیان احتمالی در بازار سرمایه و ارز دیجیتال، با شخص معامله گر است.