
WavePoint_FX
@t_WavePoint_FX

What symbols does the trader recommend buying?
Purchase History
پیام های تریدر
Filter
WavePoint_FX
تحليل موجات إليوت – XAUUSD الأسبوع الرابع من شهر ديسمبر
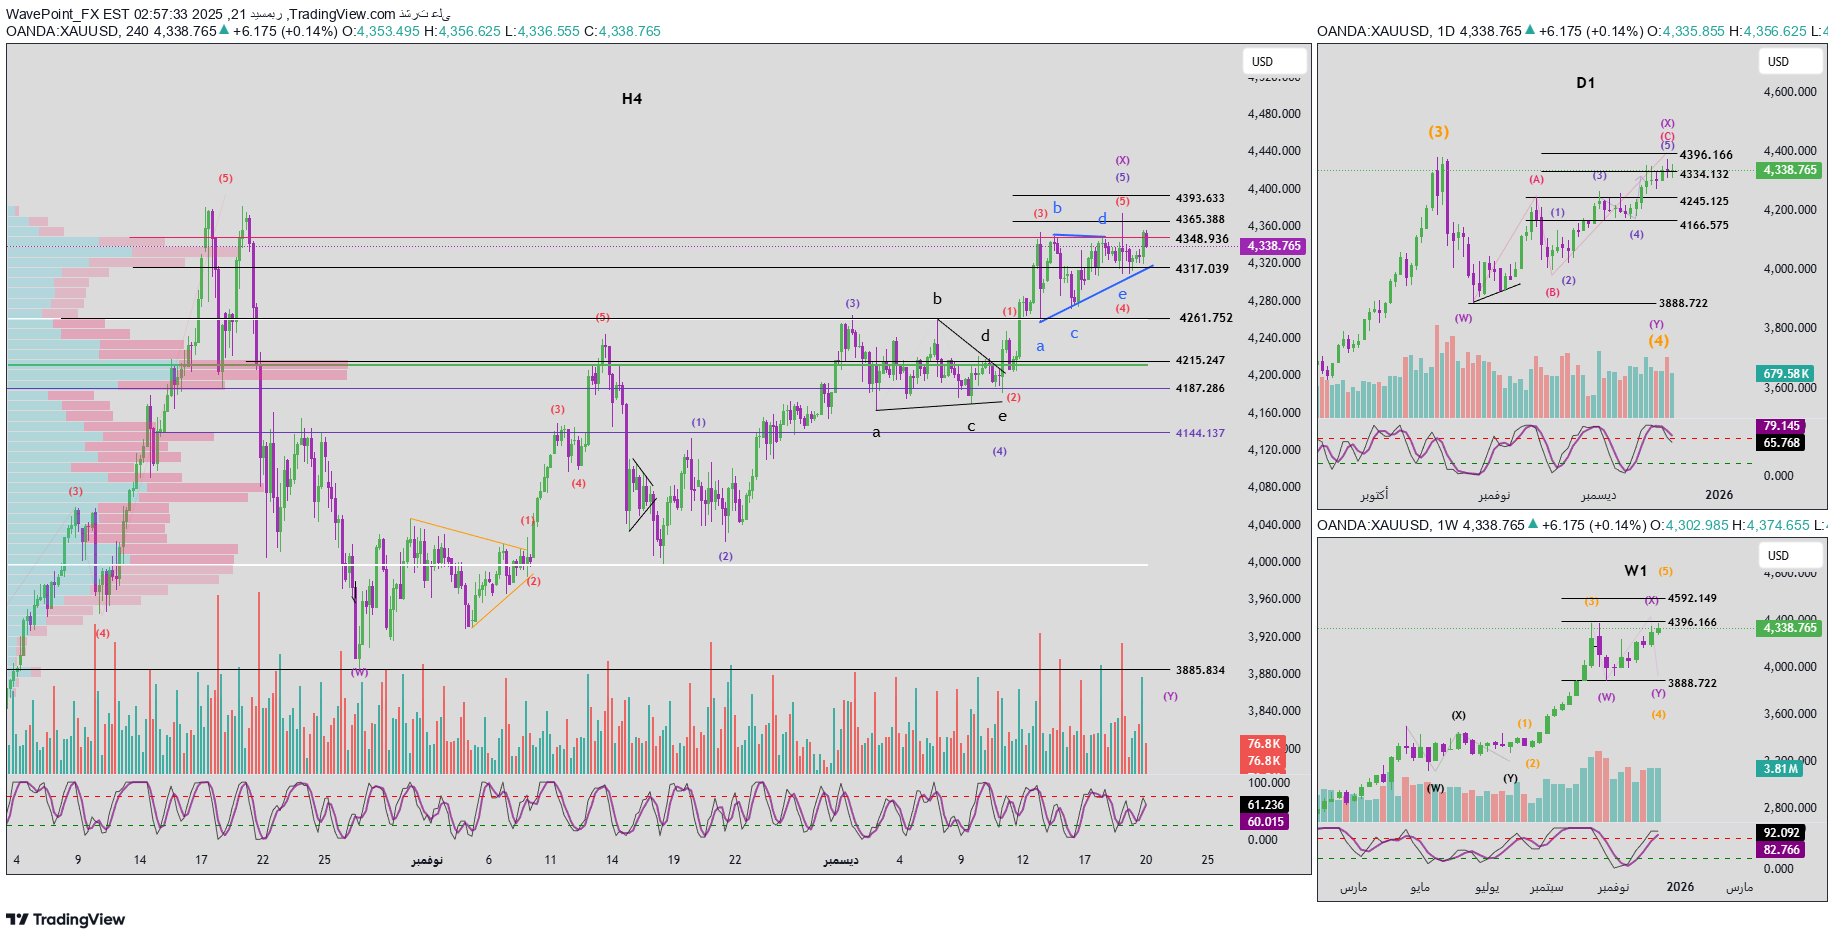
1. Momentum Weekly frame (W1) The weekly frame's momentum is preparing to reverse to the downside. If a confirmation candle appears during the next week, a downward trend is likely to form on the weekly frame, which indicates the beginning of a correction phase that may extend for several weeks. Daily frame (D1) The daily momentum has already confirmed the bearish reversal, and therefore the bearish trend is expected to be dominant during the coming week. Frame H4 H4 momentum is close to confirming a bearish reversal, indicating the possibility of the beginning of selling pressure since the opening of the Asian session at the beginning of the week. 2. Elliott wave structure Weekly frame (W1) The price structure on the weekly frame shows that the market is at the top of the third wave (in yellow). Combined with the weekly momentum preparing for a reversal, the price is likely to continue into the fourth wave (in yellow) in the form of a flat correction. After wave X is completed, the price is expected to continue falling in line with the weekly momentum to complete wave Y. Wave Y may take several weeks for the weekly momentum to enter the oversold zone. Daily frame (D1) Within the X wave structure in violet, an ABC corrective pattern in red is forming. Inside the red wave C, we notice an impulsive structure consisting of five waves (1–2–3–4–5) in blue. Currently, the price is trading in the fifth blue wave. With the daily momentum reversing to the downside, I expect the fifth blue wave to have completed, which means: The red C wave is completed Wave X violet is completed After that, the market is likely to enter a bearish phase to form wave Y. In terms of timing: The previous W wave took about 3 weeks Therefore, wave Y is expected to take at least a similar amount of time Over the next week, I expect to see strong selling pressure with a sharp and clear downward movement in the form of a five-wave bearish structure. H4 structure Looking at the blue fifth wave, an internal structure consisting of five red waves (1–2–3–4–5) can be observed. The price's previous breach of the 4365 level indicates that the target of the fifth red wave has already been achieved. Current status: Daily momentum reversed lower H4 momentum is in the process of reversing downward The price failed to penetrate and stabilize above 4365 The last candle closed below the 4348 level Based on these data, I expect that the top of the fifth wave has already formed. 3. Volume Profile and price scenarios From a Volume Profile perspective: Level 4348 represents a high liquidity area and acts as strong resistance The price has not yet been able to penetrate this area decisively Main bearish scenario: If the price closes below the 4317 level (low liquidity area) by the open of the next session, the price will likely quickly pass through this area and fall towards the next high liquidity area near 4215. This scenario will constitute a strong confirmation of the completion of the fifth wave. Alternative scenario: If the price manages to break through and hold above 4348, the fifth wave may not have been completed yet, and may extend in the form of a Terminal Triangle. In this case, I will continue to monitor the upper targets and update the analysis as additional data becomes available. 4. Trading plan At current levels, this area is a good potential selling area. However, to determine an accurate entry point, I need further confirmation from price action when the market opens tomorrow. When clearer signals appear, I will update the trading plan.
WavePoint_FX
تحلیل موج الیوت طلا (XAUUSD): آمادهسازی برای ریزش چند هفتهای؟ (هفته چهارم دسامبر)
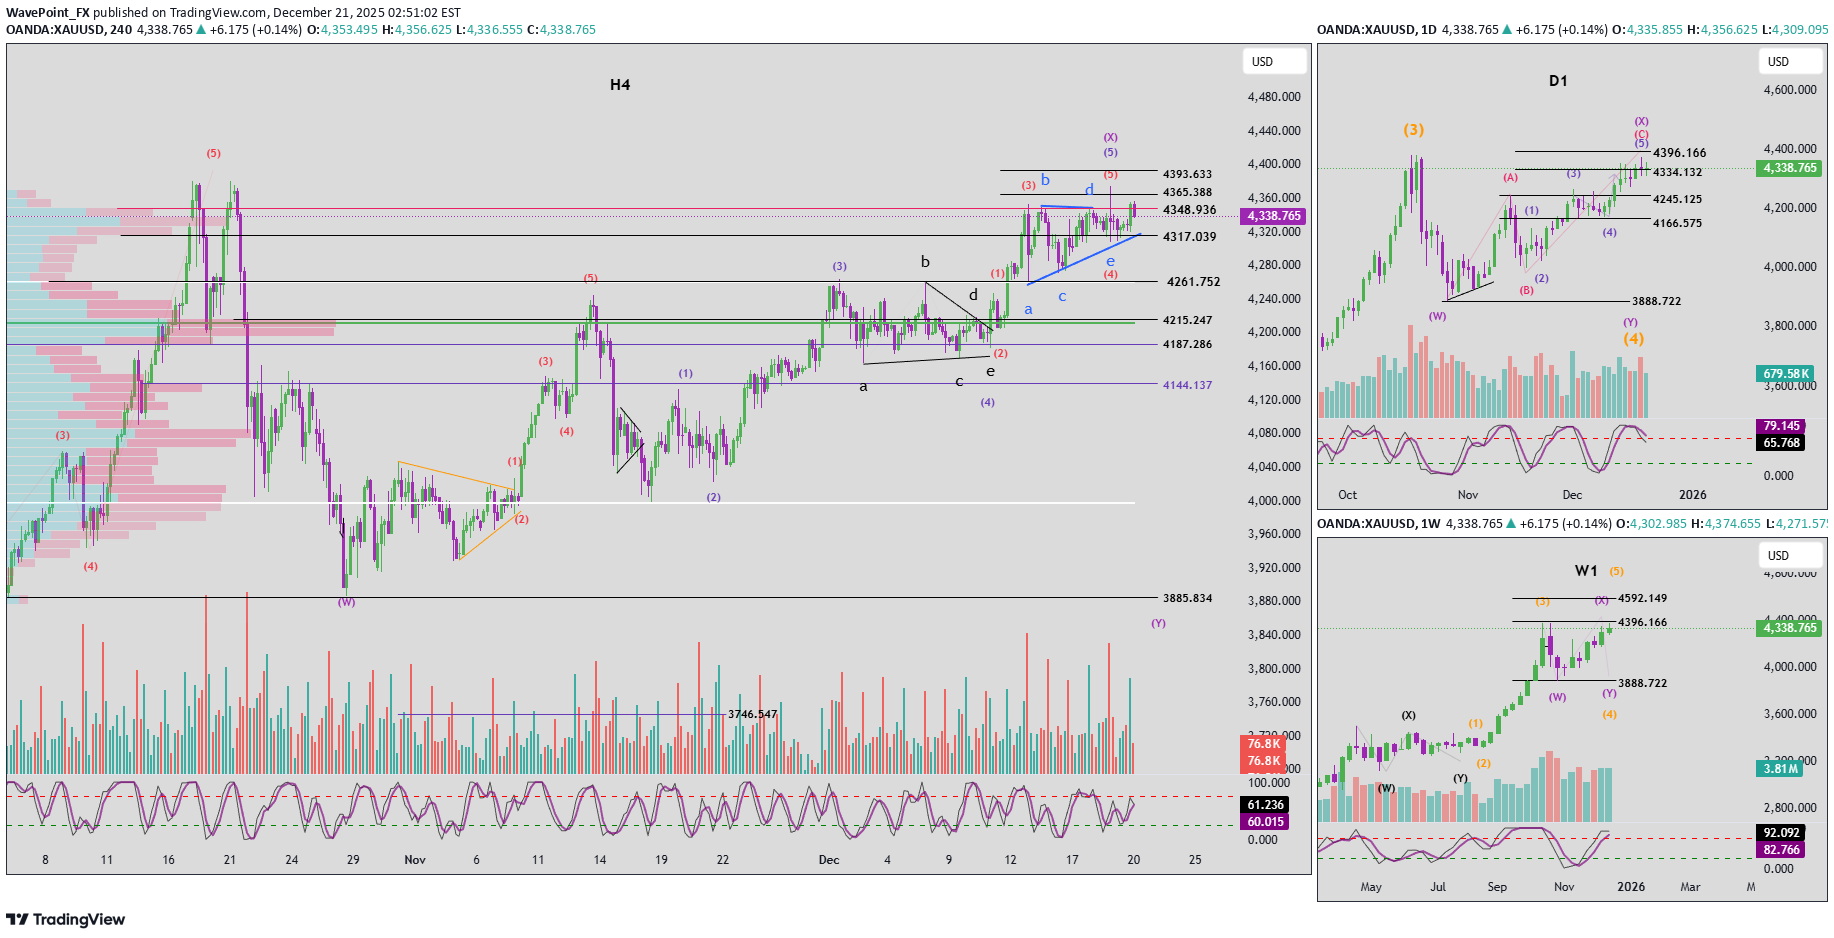
1. Momentum Overview Weekly (W1) Weekly momentum is currently preparing to reverse to the downside. If a confirmation candle appears next week, a weekly bearish trend is likely to be established. This would indicate the beginning of a multi-week corrective phase. Daily (D1) Daily momentum has already confirmed a bearish reversal. Therefore, the downside bias is expected to dominate in the coming week. H4 H4 momentum is approaching bearish confirmation. This suggests that selling pressure may begin to emerge as early as the Asian session at the start of the week. 2. Elliott Wave Structure Weekly (W1) The price structure on W1 clearly shows that the market is positioned at the top of Wave 3 (yellow). Combined with the weekly momentum preparing to reverse, the market is likely to continue into Wave 4 (yellow), developing as a flat corrective structure. After Wave X is completed, price is expected to decline in line with weekly momentum to complete Wave Y. The completion of Wave Y may take several weeks, until weekly momentum reaches the oversold zone. Daily (D1) Within the purple Wave X structure, price is forming a red ABC corrective pattern. Inside red Wave C, we observe a five-wave impulse structure (1–2–3–4–5) in blue. At present, price is trading in blue Wave 5. With daily momentum already reversing to the downside, I expect blue Wave 5 to be complete, which implies: - Red Wave C has finished - Purple Wave X has also completed Following this, the market should enter a declining phase to form Wave Y. Regarding time symmetry: - Wave W previously took approximately 3 weeks to complete - Therefore, Wave Y is expected to last at least a similar duration In the coming week, I want to see strong selling pressure, with sharp downside movement, forming a clear five-wave bearish structure. H4 Structure Looking at the blue Wave 5, we can identify an internal five-wave red structure (1–2–3–4–5). The breakout above 4365 suggests that the price objective of red Wave 5 has already been achieved. Currently: - Daily momentum has reversed bearish - H4 momentum is also turning bearish - Price failed to break and hold above 4365 - The latest candle closed below 4348 Based on these combined signals, I expect the top of Wave 5 to be in place. 3. Volume Profile & Price Scenarios From the Volume Profile perspective: - 4348 is a high-liquidity zone acting as a strong resistance - Price has not yet been able to break decisively above this area Primary bearish scenario: If price closes below 4317 (a low-liquidity void) at the start of the next session, the market is likely to move quickly through this area and decline toward the next high-liquidity zone near 4215. This scenario would provide strong confirmation that Wave 5 has completed. Alternative scenario: If price breaks above and holds above 4348, Wave 5 may extend further, potentially forming a terminal triangle. In that case, I will continue to monitor higher target zones and provide updates once additional data becomes available. 4. Trading Plan At current levels, this is a potentially strong sell zone. However, to define a precise entry plan, I need additional confirmation from price action at the market open tomorrow. Once clearer signals appear, I will update the trading plan accordingly.
WavePoint_FX
تحليل موجات إليوت للذهب (XAUUSD): هل قمة الموجة X شکل گرفت؟ پیشبینی نوسانات قیمتی!
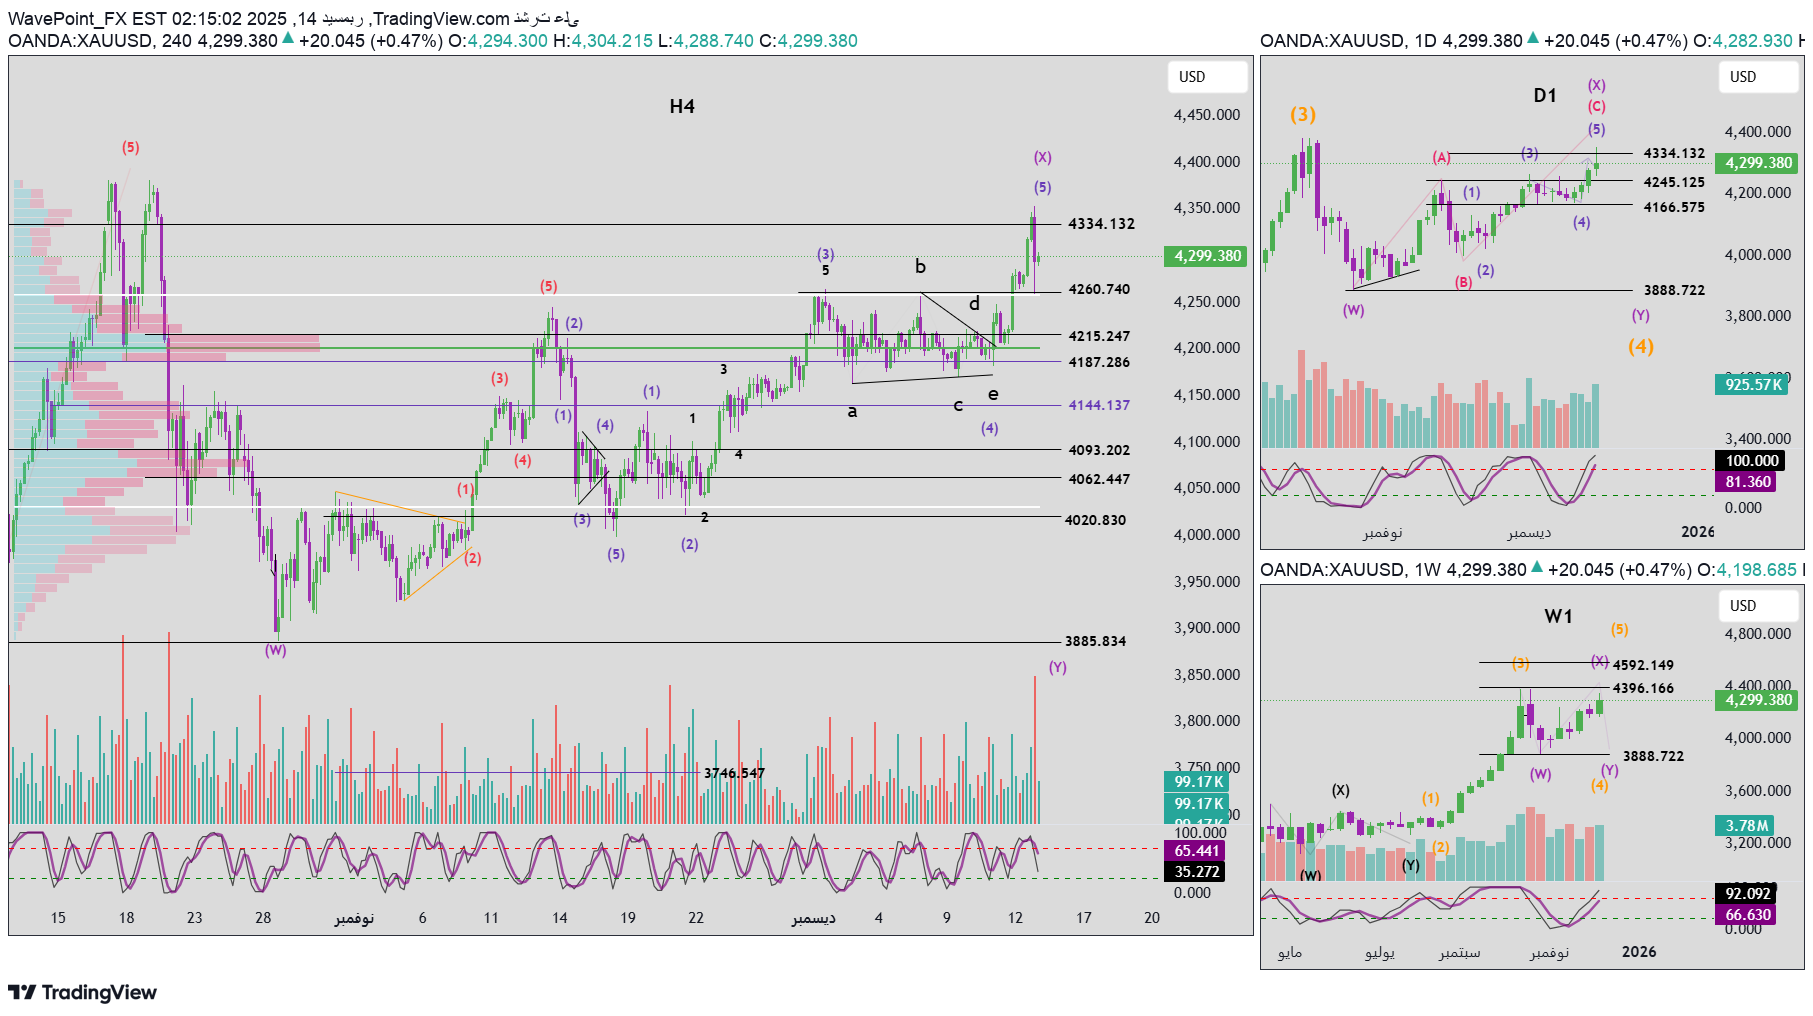
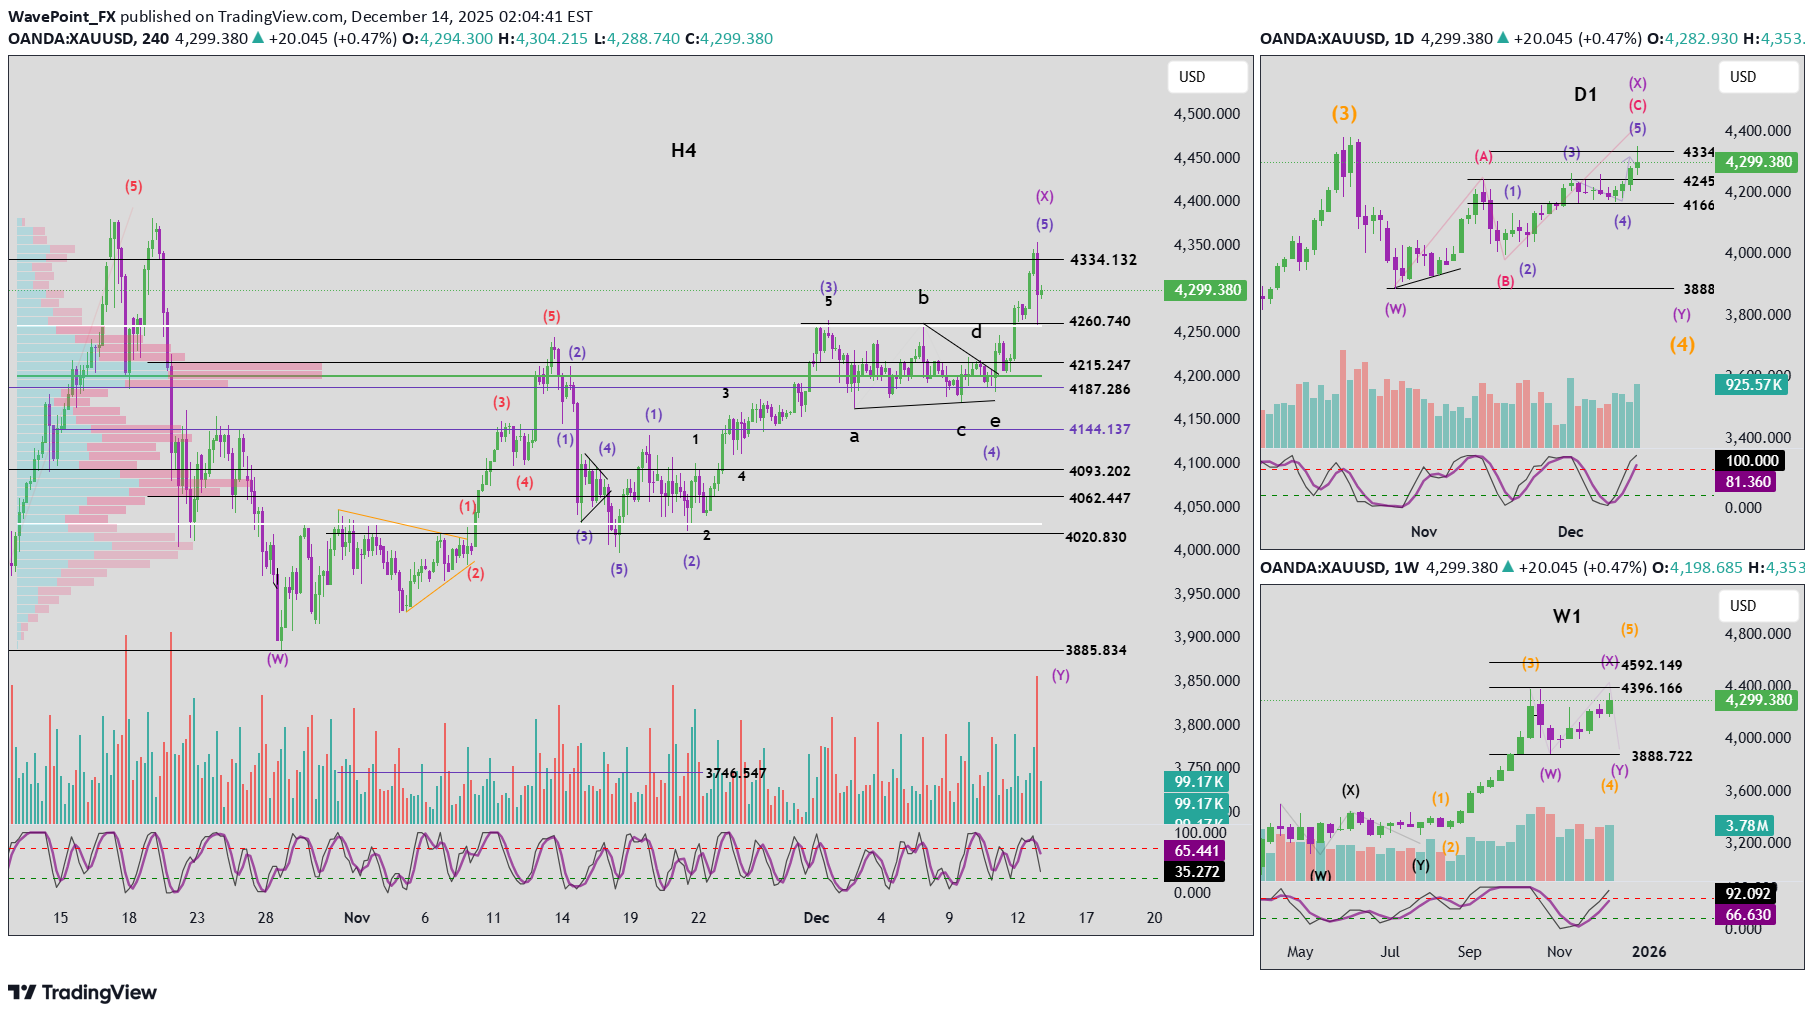
1. Momentum analysis Daily time frame (D1) The daily frame momentum is currently showing initial signs of a bearish reversal, however it is still necessary to wait for today's D1 candle close for confirmation. If the reversal is confirmed, it is likely that wave X has formed a top, and the price will move down with D1 momentum to complete wave Y. H4 time frame The 4-hour momentum is currently on the decline. In the near term, there are two possibilities: Bearish corrective movement on H4 frame Or move sideways until H4's momentum begins to reverse upward H1 time frame One hour momentum is showing signs of a bullish reversal, indicating: Possibility of a short-term uptick Or the continuation of the horizontal movement within a narrow range 2. Elliott wave structure Daily frame (D1) There is no fundamental change in the wave structure on the daily frame compared to the previous plan. However, as D1's momentum weakens and its reversal begins, the probability of a wave X peak increasing during the day or in the next few sessions. H4 time frame On the H4 frame, the price may still be in wave 5 (blue) of wave C (red) within the X wave structure. Given that the structure of D1 resembles a Flat pattern, the price rising to or approaching the top of wave 3 near 4396 remains a possible scenario. H1 time frame Inside wave 5 (blue), we observe an internal structure of 5 waves (red). At the current stage, the price may be at: Wave 4 (red), or Wave 5 (red), depending on the development of the upcoming movement The current upward movements are characterized by: Clear interference between waves Absence of strong impulsive momentum Gradual weakening of momentum As H4 momentum continues to decline, two main scenarios emerge. 3. Main scenarios The first scenario is wave 4 in the triangle pattern The price is still moving within wave 4 which takes the form of a triangle pattern. In this scenario: Wave d has probably completed The price is currently in the process of forming wave e The expiration zone of wave e is expected to be: It coincides with a bullish reversal in H4 momentum It converges with the lower border of the triangle Through Volume Profile analysis: The price is currently trading near the POC (point of control), which is the same area as the top of wave 3 Below it, the 4301 area represents an important liquidity limit and is the likely area for wave e to end Below that, the 4271 level is a strong separator between areas of high and low liquidity If the price closes below 4271, you should prepare for the possibility of a deeper decline. The second scenario, red wave 5, Ending Triangle pattern Another scenario with high probability is that the price is currently in wave 5 (red). This wave may take the form of an Ending Triangle with an internal structure of 5 waves in black. Main features: Gradual increase in price Strong interference between waves Continuing weakness in momentum In this scenario: The price is expected to remain supported above the current POC area A final upward push towards the 4365 level occurs After wave 5 is completed, a sharp and rapid decline is likely, which is a common behavior after Ending Triangle patterns This scenario needs additional confirmation from price action, and will be updated as the structure becomes clearer. 4. Trading plan Buying zone: 4302 – 4300 Stop loss: 4290 Profit goals: TP1: 4332 TP2: 4365 TP3: 4393
WavePoint_FX
تحلیل موج الیوت طلا (XAUUSD): آمادهسازی برای ریزش بزرگ یا صعود نهایی؟
1. Momentum Analysis Daily (D1) Daily momentum is showing early signs of a bearish reversal. However, confirmation is still required by waiting for today’s D1 candle close. If the reversal is confirmed, this would suggest that Wave X is topping, and price is likely to move lower following D1 momentum to complete Wave Y. H4 H4 momentum is currently declining. In the near term, this suggests: - A corrective decline on H4, or - Sideway consolidation until H4 momentum reverses back to the upside H1 H1 momentum is showing signs of a bullish reversal, indicating: - A potential short-term upward move, or - Continued sideways movement within a tightening range 2. Elliott Wave Structure Daily (D1) The D1 wave structure remains largely unchanged from the previous plan. However, with D1 momentum weakening and starting to reverse, the probability of a Wave X top forming within today or the next few sessions is increasing. H4 On H4, price may still be developing Wave 5 (blue) of Wave C (red) within the larger Wave X structure. Given that the D1 structure resembles a Flat pattern, a move toward or equal to Wave 3 high near 4396 remains a realistic scenario. H1 Within Wave 5 (blue), we can observe an internal 5-wave structure (red). At this stage, price may be forming: - Wave 4 (red), or - Wave 5 (red), depending on upcoming price behavior Current advances are: - Overlapping - Lacking clear impulsive strength When combined with declining H4 momentum, this leads to two primary scenarios. 3. Main Scenarios 🔹 Scenario 1: Wave 4 Triangle Price remains in Wave 4, developing a triangle structure. In this case: - Wave d is likely complete - Price is currently forming Wave e 📌 The expected termination zone for Wave e: - Aligns with a bullish reversal in H4 momentum - Converges with the lower boundary of the triangle From Volume Profile analysis: - Price is currently trading around the POC (Point of Control), which also aligns with the Wave 3 top - Below, the 4301 zone represents a key liquidity boundary → this is the primary expectation for Wave e completion - Further below, 4271 marks a strong High–Low volume boundary ⚠️ A daily close below 4271 would significantly increase the probability of a deeper bearish scenario. 🔹 Scenario 2: Wave 5 (Red) – Ending Triangle Another high-probability scenario is that price is currently within Wave 5 (red). This Wave 5 may be forming an Ending Triangle with an internal 5-wave black structure. Key characteristics: - Gradually rising price - Strong overlap - Weakening momentum In this scenario: - Price should remain supported above the current POC - A final push higher toward 4365 is expected - Completion of Wave 5 would likely be followed by a sharp and steep bearish move, which is typical after an ending triangle 📌 This scenario requires additional price confirmation, and updates will be provided as structure becomes clearer. 4. Trading Plan Buy Zone: 4302 – 4300 Stop Loss: 4290 Take Profit Targets: TP1: 4332 TP2: 4365 TP3: 4393XAUUSD Plan Update Momentum H4 momentum has now confirmed a bullish reversal. In the near term, this suggests a potential upward move lasting approximately 4 to 5 H4 candles. At the same time, the CPI release has triggered a bullish reversal in H1 momentum, with a strong H1 candle closing with full bullish strength. This indicates that buy-side pressure is entering the market aggressively. Price is currently retesting the POC zone. If price can hold above this area, a short-term bullish trend is likely to continue. Wave Structure and Price Scenarios Based on the wave structure discussed above, the bullish scenario allows price to continue rising toward the target zones at 4365 and 4393. However, it is important to note that the previous pullback did not clearly reach the lower boundary of the triangle. As a result, there is not yet sufficient confirmation to determine whether the structure represents: - A Wave 4 triangle, or - An ending triangle within Wave 5 Given this uncertainty, the market is currently considered to be in a late-stage wave environment. Therefore: - Observation is preferred, or - Only short-term scalping trades should be considered Even if the current upward move continues, it is unlikely to extend for a prolonged period. After completion, price is expected to resume a broader decline to complete Wave Y (purple), with a projected target near the Wave W base around the 3888 area.
WavePoint_FX
تحليل موجات إليوت XAUUSD – 17/12/2025
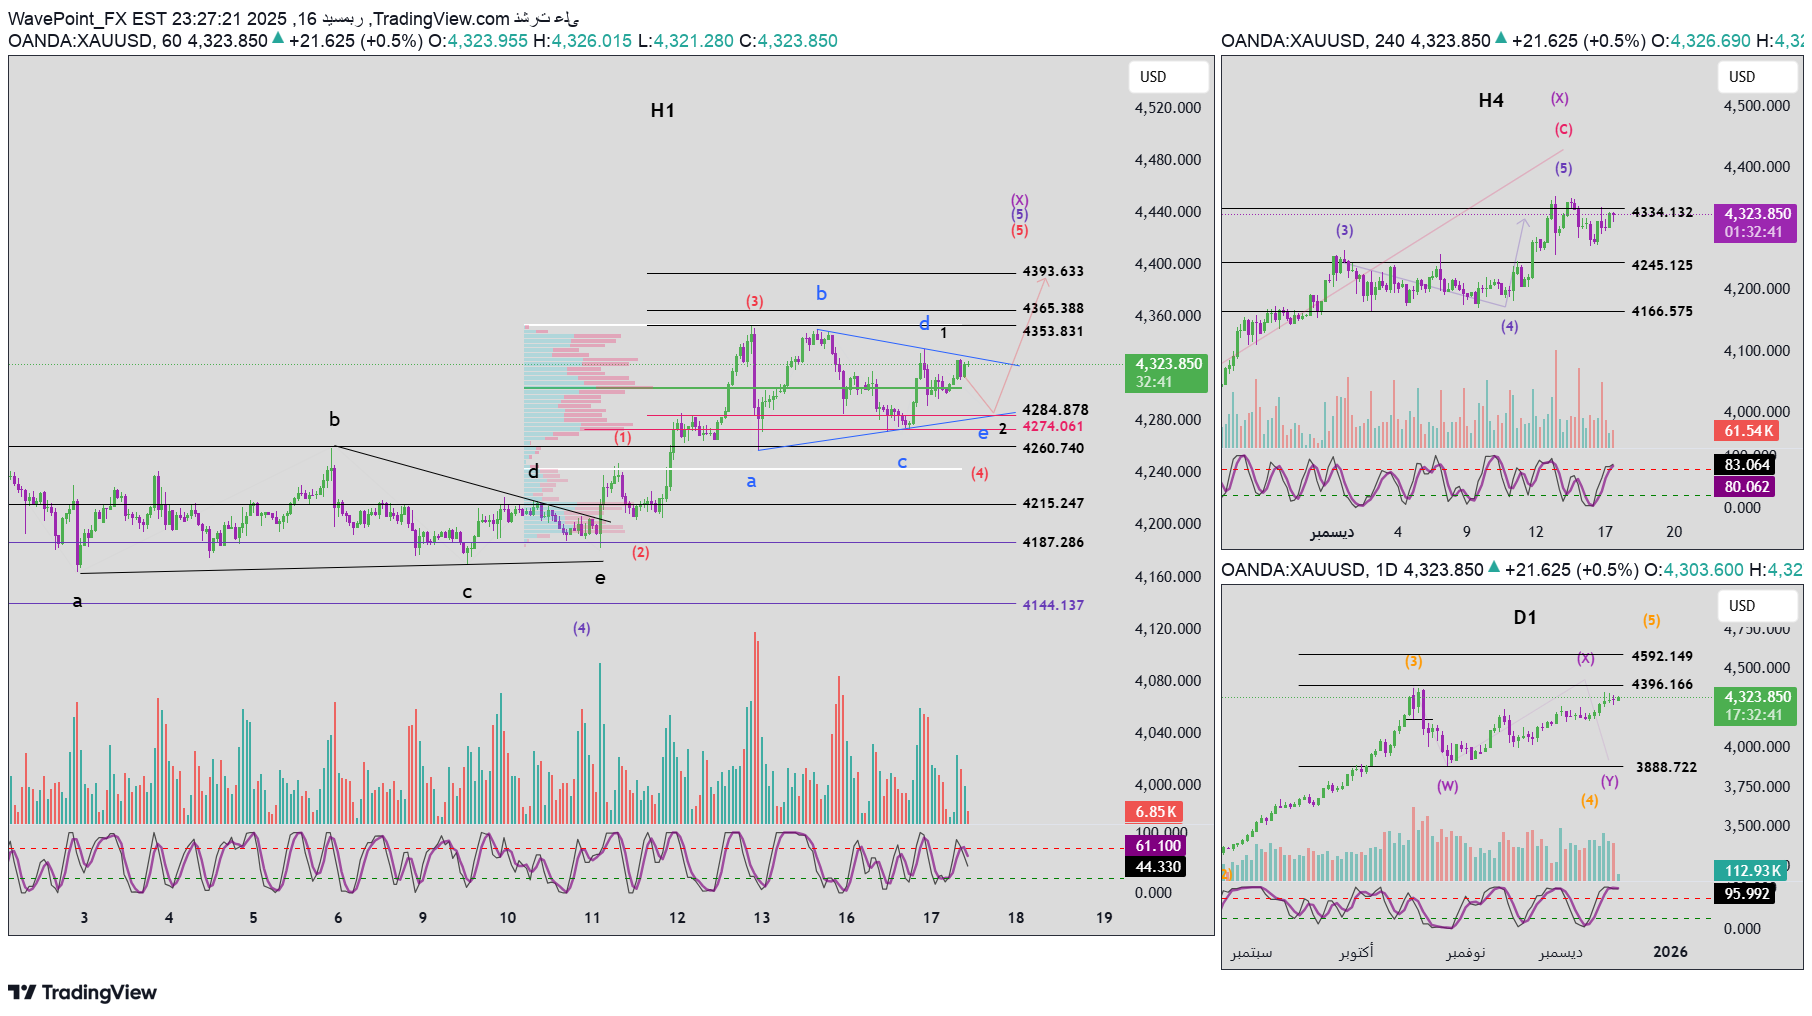
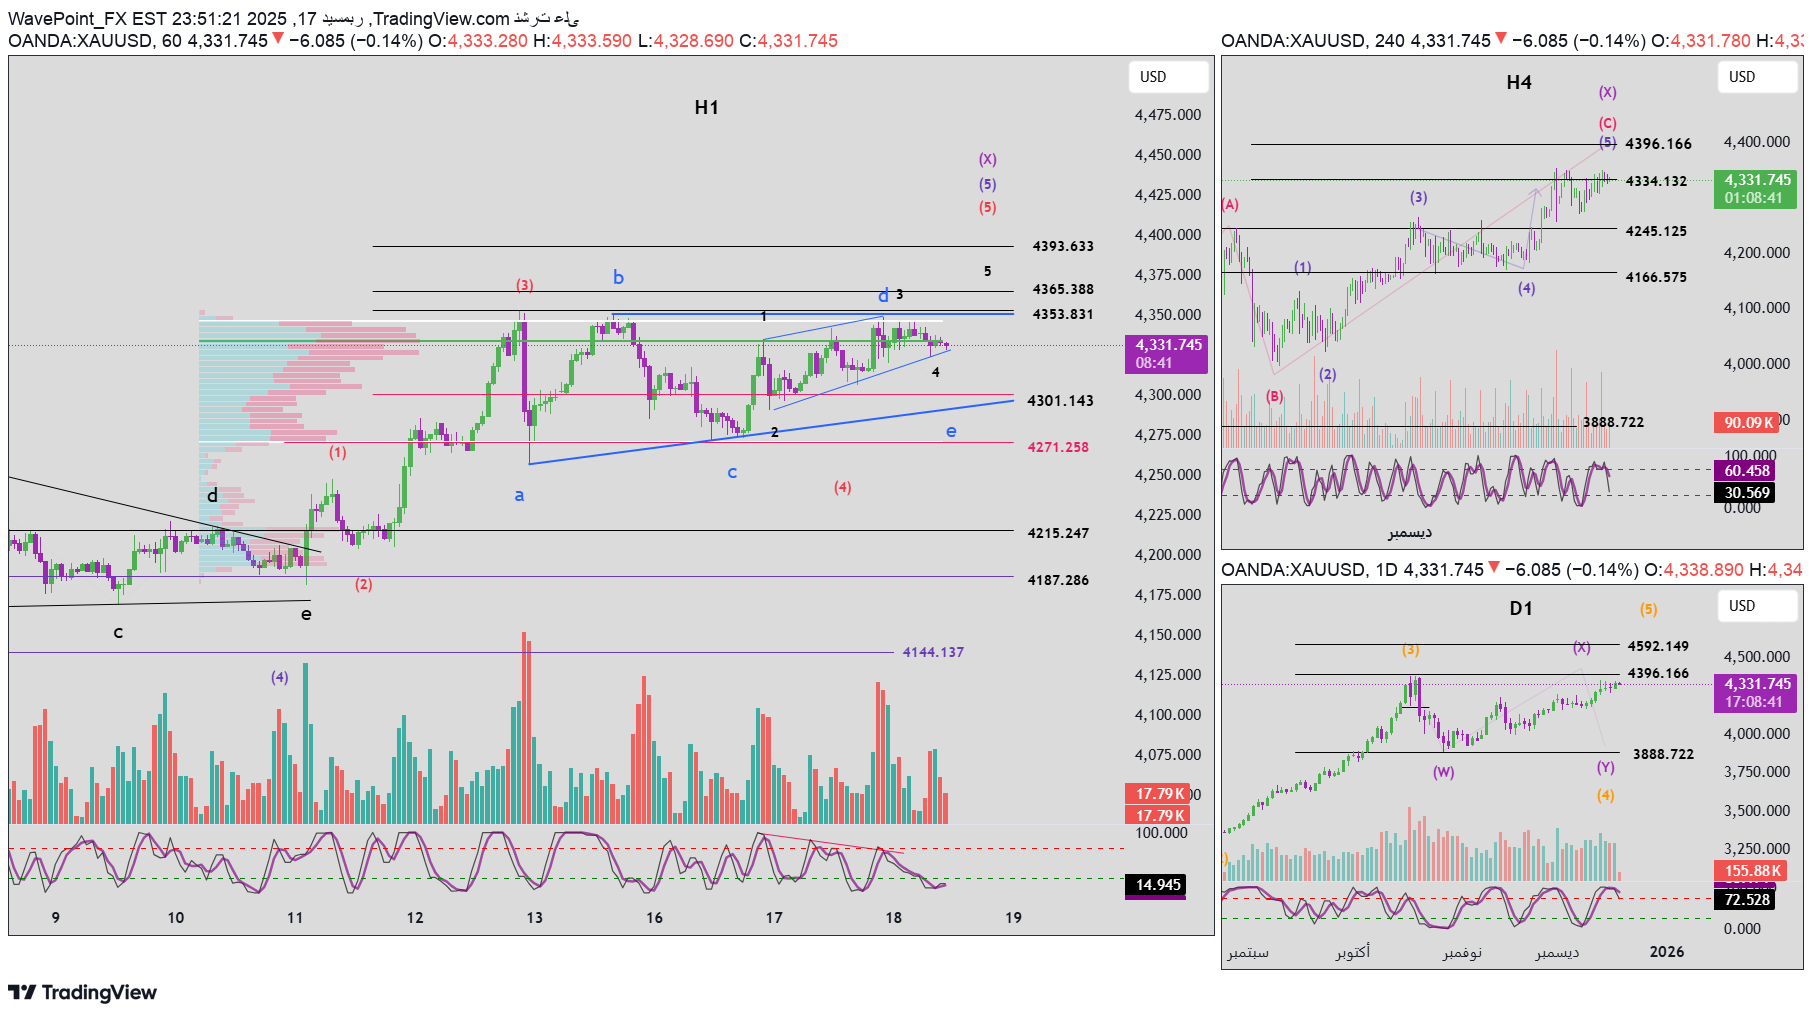
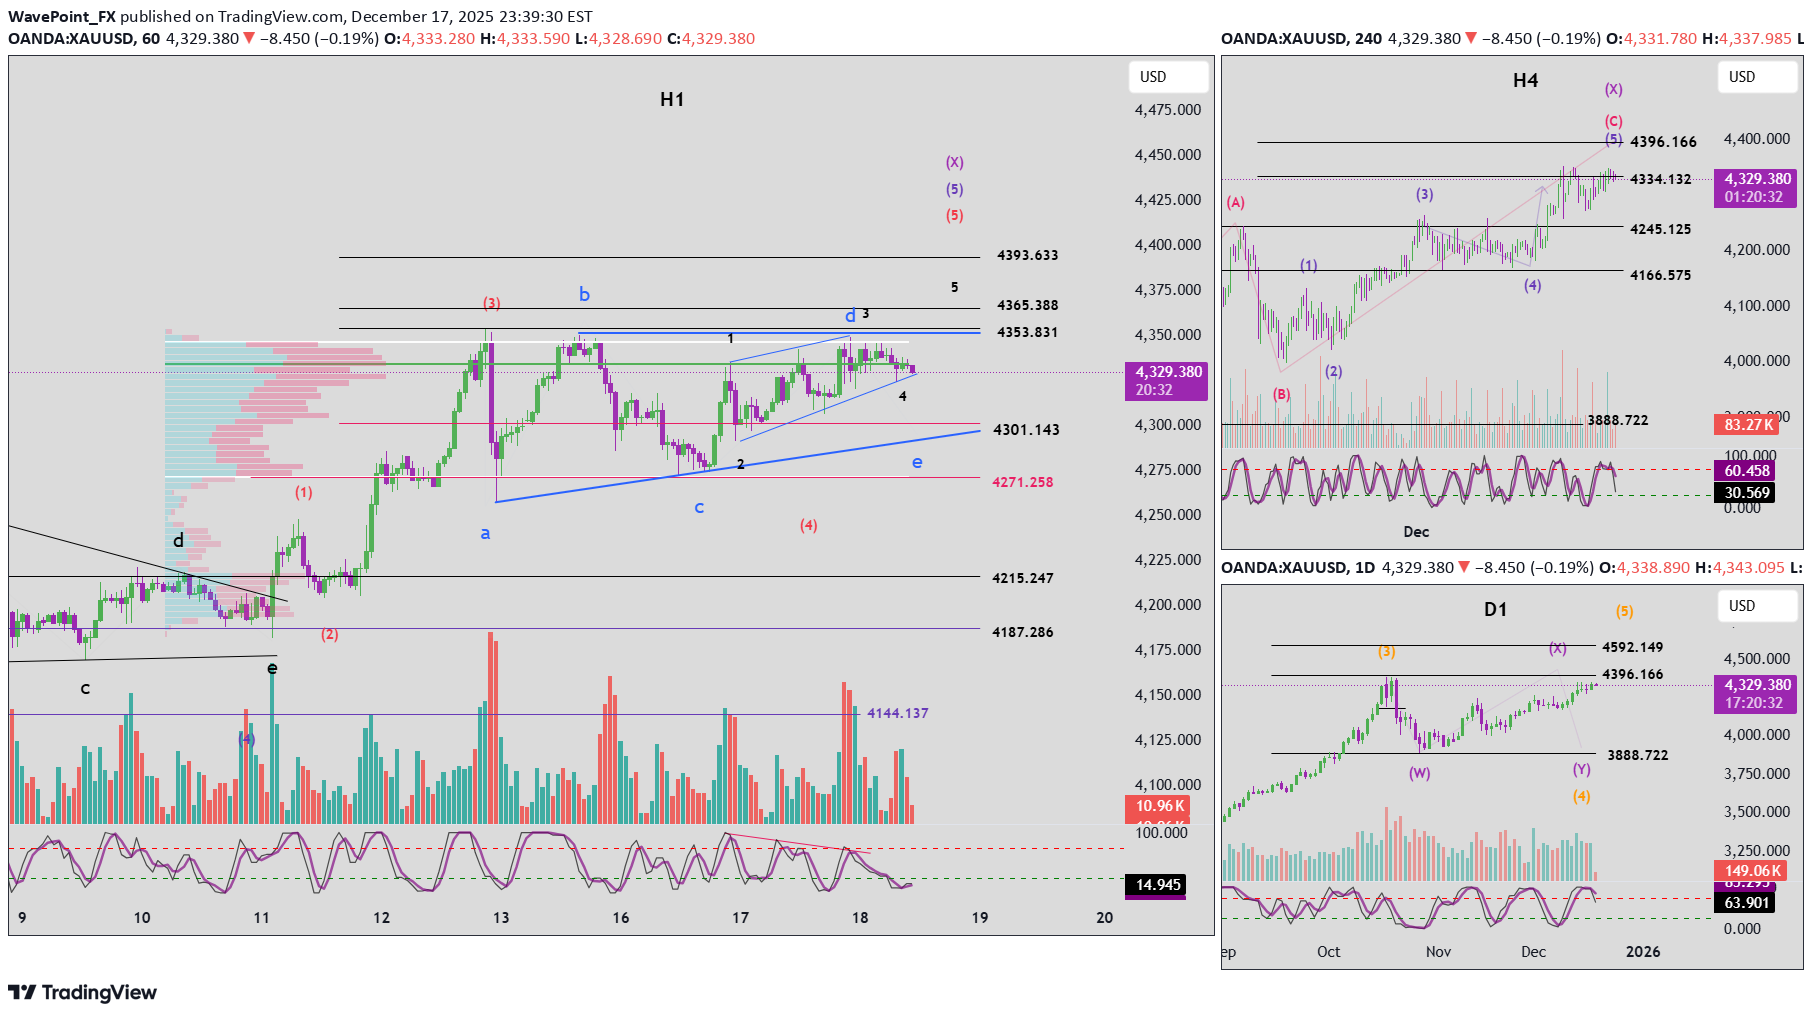
1. Momentum Daily time frame D1 After closing the D1 candle, we notice that the daily momentum is in an overlapping/compressed state. This situation does not negate the current upward trend, but it does not confirm that a reversal has occurred yet. We need to wait for clear confirmation of the daily frame momentum. H4 time frame H4 momentum is also starting to compress and is showing early signs of a possible reversal. At the moment there is no confirmed bearish candle on H4, so it is best to wait and watch. H1 time frame H1 momentum is declining, indicating that a short-term correction or sideways move may be underway on the H1 frame. 2. Elliott wave structure Wave structure on D1 The wave structure on the daily frame has not seen significant changes. As the momentum continues to squeeze, we will likely see 1 to 2 additional bullish daily candles. The upper target area near 4396 is still valid to complete wave X. Wave structure on H4 Although H4 momentum reached overbought territory, the price failed to break the previous high at 4354. This is an early warning sign of weak purchasing power. Although the signal is not sufficient to confirm a reversal, it supports the possibility of the start of the downward Y wave as mentioned in the previous plans. Wave structure on H1 The failure of the price to record a new high as the H4 momentum reached overbought led to two main scenarios on the H1 frame: The first scenario – a triangle-shaped corrective pattern (abcde – in blue): The price is likely in the final stage of forming a triangle. If the price falls below the lower border to complete wave e, the expected completion area is located near 4284. Currently the price is still above the POC area (green), so it is not excluded that wave e has already completed. A breakout of the trend line b–d will give a breakout pattern entry signal. Scenario 2 – 5-wave impulsive structure (1–2–3–4–5 – in black): The price is currently in the process of forming the second wave (2). The expected target for the second wave is also near 4284. 👉 Important meeting area Both scenarios meet at the 4284 level, making this area a high probability buy zone. ⚠️ Note the risks In case the price closes below the 4274 level, you must prepare for the possibility of a deeper decline, and it will be necessary to re-evaluate the current buying plan. 3. Trading plan Buying zone: 4285 – 4283 Stop loss: 4273 First target: 4329 Second goal: 4353 Third goal: 4365
WavePoint_FX
Elliott Wave Analysis XAUUSD – 17/12/2025
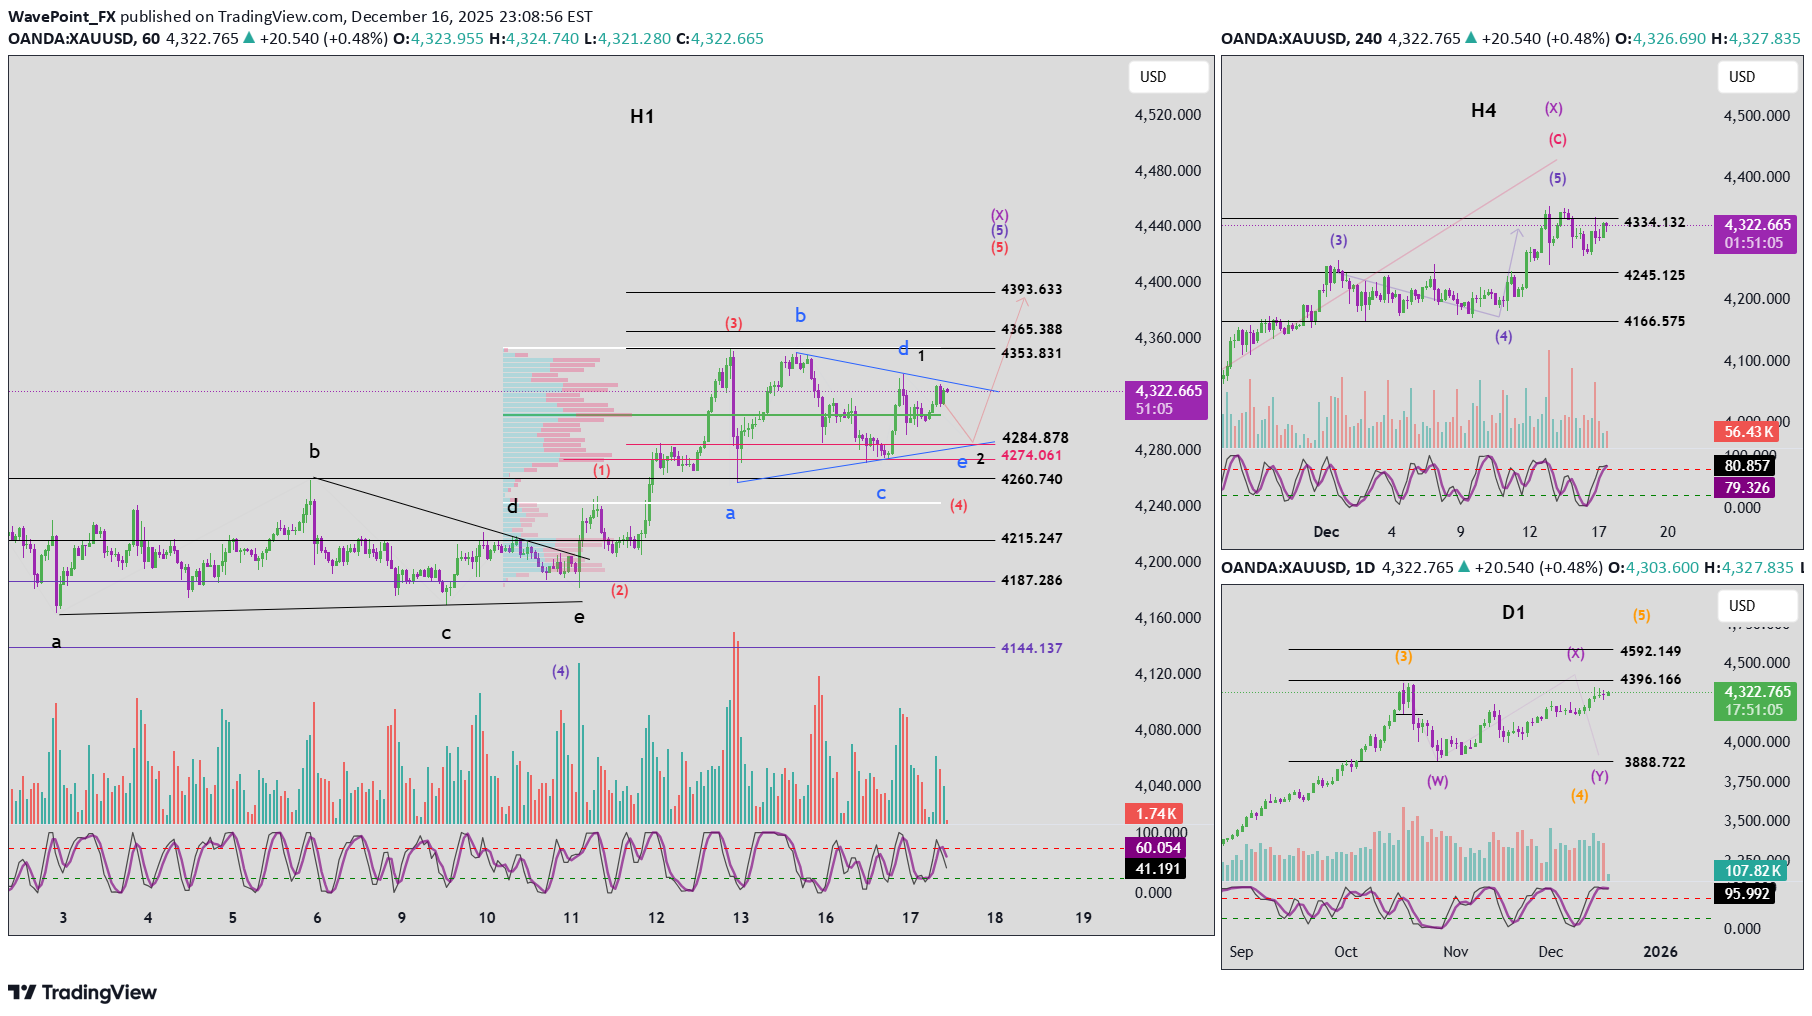
1. Momentum D1 (Daily) After the D1 candle closed, the daily momentum is currently compressed. This condition does not invalidate the ongoing bullish move, but it also does not confirm a reversal yet. We still need to wait for a clear momentum confirmation on D1. H4 H4 momentum is also compressing and showing early signs of a potential reversal. At this stage, there is no confirmed bearish H4 candle, so the correct approach is to remain patient and observe. H1 H1 momentum is weakening, suggesting that a short-term pullback or sideways movement may be developing on the H1 timeframe. 2. Elliott Wave Structure D1 Wave Structure The D1 wave count remains largely unchanged. With daily momentum still compressed, it is possible that price may produce one to two more bullish D1 candles. The upside target near 4396 is still valid to complete wave X. H4 Wave Structure Although H4 momentum has reached the overbought zone, price failed to break the previous high at 4354. This is an early warning signal that bullish momentum is weakening. While the signal is not yet strong enough to confirm a reversal, it supports the potential development of a bearish wave Y, as discussed in previous plans. H1 Wave Structure The failure of price to break the H4 high while momentum reached overbought creates two main scenarios on H1: Scenario 1 – Corrective triangle (abcde – blue): + Price may be in the final phase of a triangle correction. + If price drops below the lower boundary to complete wave e, the expected termination zone is around 4284. +Currently, price is still trading above the POC (green area), so it is possible that wave e has already completed. + In that case, a break above the b–d trendline would confirm a breakout entry. Scenario 2 – Impulsive 5-wave structure (1–2–3–4–5 – black): +Price is currently forming wave 2 (black). +The projected target for wave 2 is also near 4284. 👉 Key Confluence Zone: Both scenarios converge around 4284, making this area a high-probability Buy zone. ⚠️ Risk Note: If price closes below 4274, we must be prepared for a deeper downside scenario, and the current Buy plan should be reconsidered. 3. Trading Plan Buy Zone: 4285 – 4283 Stop Loss: 4273 Take Profit 1: 4329 Take Profit 2: 4353 Take Profit 3: 4365Market Update – XAUUSD With the latest H1 candle closing with strong bullish momentum and H1 momentum continuing to rise, it is likely that the triangle structure has now been completed. A common characteristic of a completed triangle is a strong bullish breakout, which aligns well with the current price action. In addition, H4 momentum is compressing, suggesting that the upward move may continue rather than reverse at this stage. This momentum behavior supports the view that the market is transitioning into the next impulsive phase. The projected targets for wave 5 are located around 4365 and the higher resistance zone near 4393. However, it is important to note that when a triangle forms as wave 4, wave 5 typically accelerates strongly but does not extend too far. In most cases, the length of wave 5 is approximately equal to the length of the largest side of the triangle. Traders should closely monitor price behavior near the upper target zones and manage risk carefully as wave 5 approaches completion.
WavePoint_FX
تحليل موجات إليوت XAUUSD – 16 ديسمبر 2025
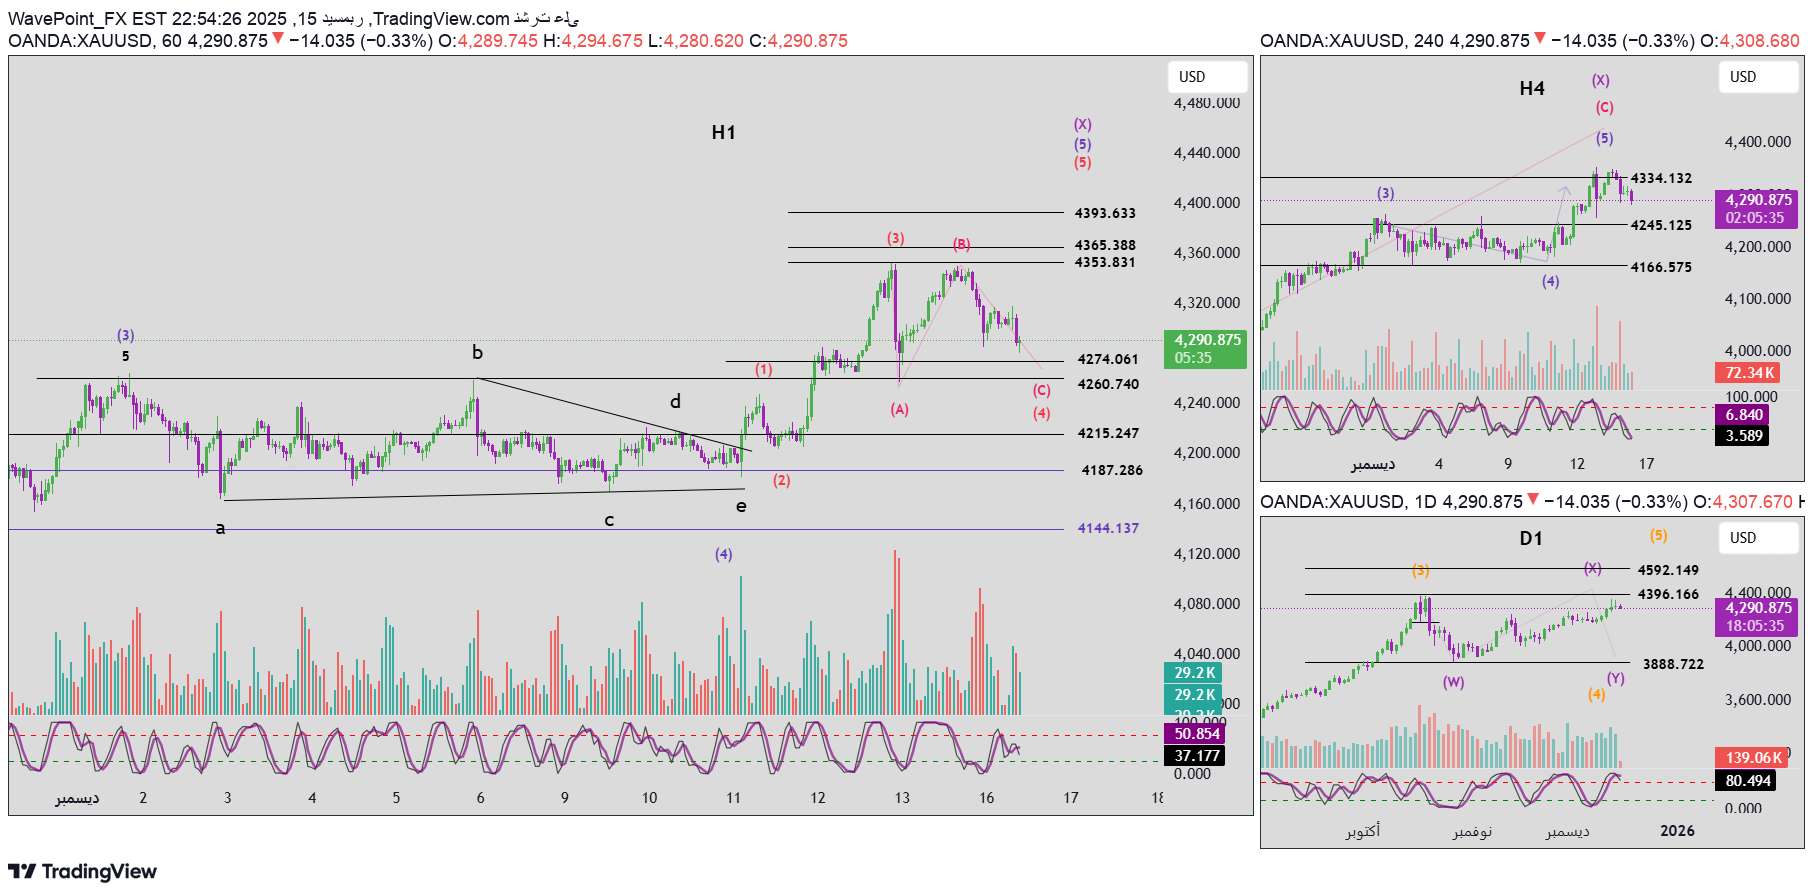
1. Momentum Daily time frame D1: The daily frame's momentum is showing signs of a bearish reversal, but we must wait for the close of today's candle to confirm this reversal. This confirmation is very important to determine whether the market has formed a medium-term top. H4 time frame: The momentum on the H4 frame is currently in the oversold zone and preparing for a bullish reversal. When this reversal is confirmed, a technical bullish bounce lasting 4 to 5 H4 candles is expected. H1 time frame: H1 momentum is still bearish and heading towards the oversold zone. We will wait for the price to reach this area while confirming a bullish reversal in momentum, which may result in a short-term corrective upward move on the H1 frame. 2. Elliott wave structure Daily time frame D1: If D1 momentum confirms the bearish reversal with the close of today's candle, the price will likely be at the top of wave X in violet. After wave X completes, the market may enter the purple wave Y, which is likely to form as a flat correction. → The expected target of wave Y is located near the 3888 level. H4 time frame: The price is currently moving inside wave 5 in green. As this wave completes, we will also see wave C and wave X complete on the larger time frame. Since H4 momentum is in the oversold zone, a short-term upward movement is likely to occur before the major structure is completed. H1 time frame: The current decline is likely to be within the red 1–2–3–4–5 structure within green wave 5, as the price is currently in red wave 4. This red wave 4 is forming as a Flat correction, which corresponds to the scenario analyzed in the previous plan. Red wave C target: near 4260 Above this level there is the 4274 area, which is an area separating high and low liquidity Therefore, when the price reaches the 4260–4274 area, we will combine this area with a bullish H1 momentum reversal confirmation to search for buying opportunities. Expected goals for red wave 5: First target: 4365 Second goal: 4393 3. Important points to monitor As mentioned in previous plans, the recent upward rebound did not reach the 4353 level, and this does not negate the scenario of the completion of the green wave 5 near this level (see the weekly plan). Therefore, if the following is true: Confirmation of a bearish reversal of D1 momentum after the close of today's candle The next bounce on H4 failed to breach the 4353 level → You must prepare for the possibility that the violet Y wave on the daily frame has already begun. 4. Trading plan Buy Zone: 4261 – 4259 Stop Loss: 4240 First target (TP1): 4286 Second target (TP2): 4319 Third target (TP3): 4365
WavePoint_FX
Elliott Wave Analysis XAUUSD – December 16, 2025
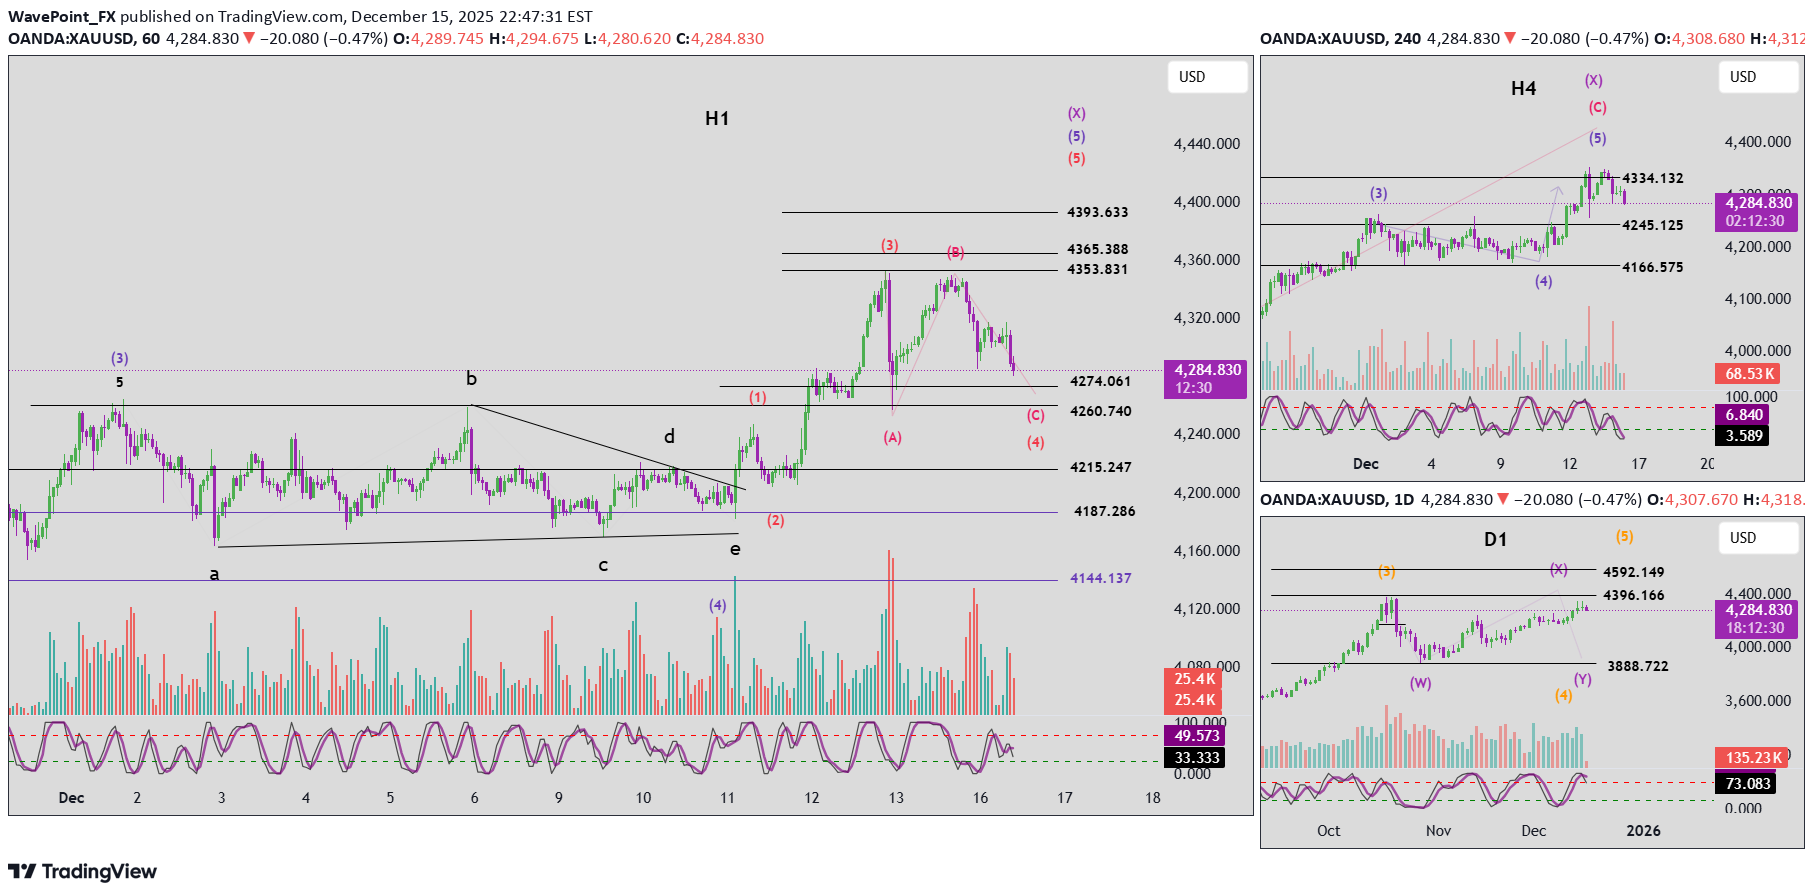
1. Momentum D1 (Daily): Daily momentum is showing signs of a bearish reversal. However, we must wait for today’s D1 candle to close to confirm this signal. This is a critical confirmation, as it will determine whether the market has formed a medium-term top. H4: H4 momentum is currently in the oversold zone and is preparing for a bullish reversal. Once confirmed, we can expect a technical rebound lasting approximately 4–5 H4 candles. H1: H1 momentum remains bearish and is moving toward the oversold area. We will wait for price to reach oversold conditions and for momentum to confirm a bullish reversal, which would signal a short-term H1 corrective rally. --- 2. Elliott Wave Structure D1: With D1 momentum turning down, if today’s daily candle confirms the reversal, price is likely forming the top of the purple wave X. After wave X completes, the market may enter purple wave Y, which is most likely developing as a Flat correction. → The projected target for wave Y is near the 3888 zone. H4: Price is currently trading within green wave 5. Once this wave 5 completes, it will also mark the completion of wave C and wave X on the higher timeframe. Given that H4 momentum is oversold, a short-term upward move is expected before the broader structure completes. H1: The current decline is likely forming a red 1–2–3–4–5 structure within green wave 5. At this stage, price is developing red wave 4. This red wave 4 is unfolding as a Flat corrective structure, consistent with the scenario outlined in yesterday’s plan. Target for red wave C: around 4260 Above this level, 4274 represents a high-liquidity / low-liquidity boundary Therefore, when price reaches the 4260–4274 zone, we will combine this area with H1 momentum bullish confirmation to look for long entries. Expected targets for red wave 5: Target 1: 4365 Target 2: 4393 3. Key Notes As discussed in previous plans, the recent rebound did not reach the 4353 level. This does not invalidate the scenario in which green wave 5 completes near this area (refer to the weekly plan). Therefore, if: D1 momentum confirms a bearish reversal at today’s close, and The upcoming H4 rebound fails to break above 4353, → We must be prepared for the scenario in which purple wave Y on the D1 timeframe has already begun. 4. Trading Plan Buy Zone: 4261 – 4259 Stop Loss: 4240 Take Profit 1: 4286 Take Profit 2: 4319 Take Profit 3: 4365Market Update Ahead of the U.S. Session Looking at H4 and H1 momentum, both timeframes are currently preparing for a bullish reversal. On the H1 timeframe, there are approximately 30 minutes left before the candle closes. At the moment, a strong bullish candle is forming, indicating increasing buying pressure. If this candle maintains its bullish strength into the close, it will provide clear confirmation that H1 momentum has shifted to the upside. From a price perspective, the market has already reached the target zone mentioned in the previous plan. Therefore, the correct approach at this stage is to wait for the H1 candle to close for confirmation. If the H1 candle closes with strong bullish momentum, we can consider placing a Buy Stop order above the high of the confirmed bullish candle, aiming to follow the continuation of the upward move once price breaks higher.If you managed to enter the Buy Stop order, it would have been triggered at 4295, and up to now it has already gained around 350 pips.
WavePoint_FX
تحليل الذهب (XAUUSD) بموجات إليوت: هل انتهى الصعود وبدأت موجة الهبوط الكبرى؟
1. الزخم (Momentum) الإطار الأسبوعی (W1): زخم الإطار الأسبوعی یقترب حالیًا من منطقة التشبع الشرائی. هناک احتمال مرتفع أنه خلال الأسبوع القادم سیدخل زخم W1 منطقة التشبع الشرائی ویبدأ فی إظهار إشارات انعکاس هابطة. الإطار الیومی (D1): زخم الإطار الیومی موجود حالیًا فی منطقة التشبع الشرائی ویستعد للانعکاس. نحتاج إلى تأکید هذا الانعکاس من خلال شمعة یومیة هابطة واضحة. عند التأکید، من المرجح أن یدخل السوق فی حرکة تصحیحیة تمتد من 4 إلى 5 أیام. إطار الأربع ساعات (H4): زخم H4 انعکس بالفعل إلى الاتجاه الهابط، لکنه لا یزال بحاجة إلى حوالی 2–3 شموع H4 إضافیة للدخول فی منطقة التشبع البیعی، مما یشیر إلى أن الضغط البیعی قصیر المدى لا یزال قائمًا. 2. هیکل موجات إلیوت الإطار الأسبوعی (W1) على الإطار الأسبوعی، نلاحظ أن الموجة X (باللون البنفسجی) تقترب من مرحلتها النهائیة. یتحرک السعر حالیًا بالقرب من مستوى بدایة الموجة W، مما یشیر إلى احتمال کبیر لتشکل نموذج تصحیحی من نوع Flat. خصائص نموذج الـ Flat: قد یعود السعر إلى مستوى بدایة الموجة W یمکن أن یتجاوز هذا المستوى قلیلًا لیکوّن قمة جدیدة لکن هذا الاختراق غالبًا ما یکون محدودًا، قبل أن ینعکس السعر هبوطًا لإکمال الموجة Y فی الوضع الحالی، لم یؤکد الزخم الأسبوعی انعکاسًا هابطًا واضحًا بعد، لذلک لا یمکن استبعاد احتمال وجود دفعة صعودیة أخیرة فی الموجة X قبل بدء الهبوط الرئیسی. الإطار الیومی (D1) على الإطار الیومی، تتشکل الموجة X (البنفسجیة) ضمن بنیة ABC. حالیًا: الموجة C (باللون الأحمر) أنهت بنیتها الداخلیة المکونة من 5 موجات السعر یتحرک الآن داخل الموجة الخامسة (الخضراء) من الموجة C وبالنظر إلى أن زخم D1 فی منطقة التشبع الشرائی، فإن احتمال اقتراب نهایة الموجة الخامسة الخضراء مرتفع. بعد اکتمالها، من المتوقع أن یبدأ السعر فی الهبوط لتشکیل الموجة Y. لکن یجب الانتباه إلى ما یلی: زخم D1 لم یؤکد بعد انعکاسًا هابطًا واضحًا لذلک فإن محاولة اقتناص قمة الموجة X فی هذه المرحلة تنطوی على مخاطرة وکما تم توضیحه فی الإطار الأسبوعی، یسمح نموذج الـ Flat بأن یکون السعر مساویًا أو أعلى قلیلًا من مستوى الموجة W قبل الانعکاس إطار الأربع ساعات (H4) عند النظر بشکل أدق إلى إطار H4: تم اکتمال بنیة 5 موجات (1–2–3–4–5 باللون الأخضر) داخل الموجة C الحمراء وصلت الموجة الخامسة إلى هدفها بالقرب من مستوى 4334، ثم بدأ السعر بالهبوط بقوة من هذه المنطقة لا یزال زخم H4 بحاجة إلى 2–3 شموع إضافیة للوصول إلى منطقة التشبع البیعی، وبالتالی: ما زال هناک مجال لاستمرار الهبوط السیناریو الأکثر ترجیحًا هو استمرار السعر فی الهبوط نحو منطقة POC (الخط الأخضر) بین 4215 – 4187، ثم حدوث ارتداد تصحیحی إذا تحقق هذا السیناریو: فإن الهبوط الحالی من المرجح أن یکون الموجة 1 الهابطة ضمن بنیة 5 موجات للموجة Y أما الارتداد اللاحق فسیکون الموجة 2، وغالبًا ما یتخذ شکل تصحیح ABC عند اکتمال هذا الارتداد، وبالتزامن مع عودة زخم H4 إلى منطقة التشبع الشرائی، یمکن البحث عن فرص بیع مناسبة 3. ملاحظات مهمة نقطة مهمة یجب الانتباه لها فی هذه الحرکة الهابطة: الزخم الأسبوعی یستعد للدخول فی منطقة التشبع الشرائی والانعکاس الزخم الیومی موجود بالفعل فی منطقة التشبع الشرائی هذا التوافق فی الزخم یشیر إلى أن الحرکة الهابطة قد تستغرق وقتًا أطول لدفع الزخم الأسبوعی مرة أخرى نحو منطقة التشبع البیعی عادةً، یحتاج الزخم الأسبوعی إلى عدة دورات انعکاس (غالبًا حوالی 3 مرات) لإکمال دورة تصحیح کاملة. لذلک: الصبر ضروری خلال هذه المرحلة یجب تجنب تبنی نظرة صعودیة طویلة المدى مبکرًا من المهم دائمًا انتظار تأکید حرکة السعر الفعلیة هذا التحلیل هو مجرد سیناریو وتحذیر محتمل، وجمیع التوقعات تحتاج إلى تأکید من حرکة السعر فی السوق الحقیقی. 4. الخلاصة بالنسبة للأسبوع القادم، الاتجاه الرئیسی المتوقع هو الهبوط. سیتم تحدیث خطة التداول التفصیلیة یومیًا مع توفر بیانات سعریة جدیدة.تحلیل موجات إلیوت XAUUSD – 15 دیسمبر 2025 1. الزخم (Momentum) الإطار الیومی (D1): زخم الإطار الیومی یعطی حالیًا إشارة فنیة إیجابیة تشیر إلى اقتراب انعکاس محتمل. ومع ذلک، فهذا لا یعنی أن السعر سیهبط فورًا، بل یعکس أن زخم الإطار الیومی بدأ یضعف، وهی حالة غالبًا ما تسبق تغیّر الاتجاه. إطار الأربع ساعات (H4): زخم H4 یستعد للانعکاس صعودًا من منطقة التشبع البیعی. هذا لیس إشارة مثالیة فی التوقیت الحالی، خاصة وأننا نقیّم احتمال تشکّل قمة موجیة. هذه الإشارة تُحذّر بشکل غیر مباشر من أن الحرکة الصاعدة على إطار H4 قد لا تکون قد انتهت بعد، وقد یستمر السعر فی الارتفاع. إطار الساعة (H1): زخم H1 حالیًا متداخل ومتشابک داخل منطقة التشبع الشرائی. من الناحیة النظریة نتوقع حرکة تصحیحیة هابطة على إطار H1، لکن هذا التشابک فی الزخم یدل على أن الهیکل الصاعد لم یکتمل بعد، وبالتالی لا یمکن استبعاد استمرار الصعود. 2. هیکل موجات إلیوت الإطار الیومی (D1) على الإطار الیومی، لا یزال السعر یتحرک داخل هیکل تصحیحی من نوع Flat (W–X–Y). ومع تقلّص زخم D1 واستعداده للانعکاس، فإن قمة الموجة X تبدو قریبة جدًا. السعر حالیًا یتداول قرب قمة الموجة 3 الصفراء، وهی المنطقة النموذجیة لانتهاء الموجة X ضمن هیکل Flat. بعد اکتمال الموجة X، نتوقع هبوط السعر باتجاه منطقة الموجة W البنفسجیة لإکمال الموجة Y. إطار الأربع ساعات (H4) على إطار H4، کان السعر یوم أمس فی الموجة الخامسة باللون الأخضر. وبعد حرکة الهبوط التی حدثت یوم الجمعة، کنا نتوقع أن تکون القمة قد تشکلت. لکن بالنظر إلى الزخم الحالی على H4، نلاحظ أنه یستعد للانعکاس صعودًا. لذلک، یجب مواصلة المراقبة بحذر، لأنه فی حال أکد زخم H4 الانعکاس الصاعد، فمن المرجح أن یستمر الاتجاه الصاعد، خاصة وأن السعر بدأ یرتفع مجددًا ویقترب من منطقة القمة مع افتتاح الجلسة الجدیدة. إطار الساعة (H1) على إطار H1، کان السیناریو الأساسی یوم أمس هو عدّ موجی 1–2–3–4–5 باللون الأحمر کما هو موضح على الرسم البیانی. ولکن مع ظهور إشارات جدیدة من زخم H4، نحتاج إلى إضافة سیناریو عدّ موجی بدیل. السیناریو الأول (الخطة الأصلیة): الشرط الأساسی هو ألا یخترق السعر مستوى 4353. عندما یدخل زخم H4 منطقة التشبع الشرائی ویؤکد انعکاسًا هابطًا، نتوقع تشکّل هیکل هابط من 5 موجات. فی هذا السیناریو، تعتبر منطقة 4334 مستوى مناسبًا لانتهاء الارتداد الحالی، وسیتم الترکیز على سلوک السعر عند هذا المستوى. السیناریو الثانی (الخطة البدیلة): فی حال واصل السعر الصعود وشکّل هیکل 1–2–3–4–5 باللون الأسود، فعند دخول زخم H4 منطقة التشبع الشرائی: قد یعادل السعر أو یتجاوز قمة 4353 وقد یتکوّن هیکل Flat للموجة الرابعة باللون الأسود، أو تکون هذه الحرکة موجة خامسة ممتدة 3. الخلاصة المؤقتة فی الوقت الحالی، لم یتم تأکید الهیکل الموجی النهائی بشکل واضح بعد. لذلک: نحتاج إلى مزید من التأکید من حرکة السعر وزخم H4 ویُفضّل تجنّب اتخاذ قرارات تداول مبکرة بینما الهیکل لا یزال غیر مکتمل سأقوم بتحدیث التحلیل باستمرار عند ظهور إشارات أو تأکیدات فنیة أوضح.تحدیث السوق مع وصول السعر إلى منطقة القمة الحالیة، فإن السیناریو الأکثر منطقیة هو أن السوق یُشکّل هیکل تصحیحی من نوع Flat ABC. على إطار H1، إغلاق شمعة هابطة قویة یشیر إلى أن الموجة B قد اکتملت على الأرجح، وأن السعر بدأ التحرک ضمن الموجة C الهابطة. عند المستوى السعری الحالی، یُعتبر هذا الموقع مناسبًا للدخول فی صفقة بیع بنمط Swing، تداولًا مع الموجة C، مع توقع هبوط السعر باتجاه قاعدة الهیکل. النقطة غیر المثالیة فی هذا الإعداد هی أن زخم H1 موجود حالیًا فی منطقة التشبع البیعی. ومع ذلک، فإن التداول فی الواقع یتطلب اتخاذ قرارات حتى فی ظل ظروف غیر مثالیة. وبالاعتماد على هیکل الموجة والسیاق العام للسوق، فقد قمت بالدخول فی صفقة بیع عند المنطقة الحالیة. خطة التداول: منطقة البیع (Sell Zone): 4330 – 4333 إیقاف الخسارة (SL): 4350 الهدف الأول (TP1): 4296 الهدف الثانی (TP2): 4260+120 pips Etry Sell Zone: 4330 – 4333+300 pips Etry Sell Zone: 4330 – 4333
WavePoint_FX
تحلیل موج الیوت طلا (XAUUSD): سیگنال ریزش در راه است؟ (هفته سوم دسامبر ۲۰۲۵)
1. Momentum Weekly (W1): Weekly momentum is approaching the overbought zone. There is a high probability that in the coming week, W1 momentum will enter the overbought area and start showing signs of a bearish reversal. Daily (D1): D1 momentum is currently in the overbought zone and preparing to turn down. We need confirmation from a clear bearish D1 candle. Once confirmed, the market is likely to enter a corrective move lasting approximately 4–5 days. H4: H4 momentum has already turned bearish. However, it still needs around 2–3 more H4 candles to reach the oversold zone, indicating that short-term downside momentum remains intact. 2. Elliott Wave Structure Weekly Timeframe (W1) On the weekly chart, wave X (purple) appears to be in its final phase. Price is currently trading near the base of wave W, suggesting a high probability that this structure is forming a flat correction. Key characteristics of a flat pattern: - Price can retrace back to the origin of wave W. - It may even exceed the W low/high and create a marginal new extreme. - However, this breakout is typically limited before price reverses to complete wave Y. In the current context, weekly momentum has not yet confirmed a bearish reversal. Therefore, the possibility of one final upward push in wave X cannot be ruled out before a larger decline begins. Daily Timeframe (D1) On the daily chart, wave X (purple) is developing as an ABC structure. At present: - The red wave C has already completed a 5-wave internal structure. - Price is now trading within the green wave 5 of wave C. With D1 momentum already in the overbought zone, there is a high probability that green wave 5 is nearing completion. Once this wave ends, price is expected to decline to form wave Y. However, an important caution remains: - D1 momentum has not yet confirmed a bearish reversal. - Therefore, attempting to catch the exact top of wave X carries risk. - As discussed on the weekly timeframe, flat corrections can allow price to equal or slightly exceed the wave W level before reversing. H4 Timeframe Looking more closely at the H4 structure: - The 5-wave sequence (1–2–3–4–5 in green) within the red wave C has completed. - Wave 5 reached its projected target near 4334, after which price started to decline sharply. H4 momentum still requires 2–3 candles to reach oversold conditions, suggesting: - The current bearish leg still has room to extend. - The most probable scenario is a continuation lower toward the POC zone (green line) around 4215 – 4187, followed by a corrective bounce. If this scenario unfolds: - The current decline is likely forming wave 1 down of a new 5-wave structure for wave Y. - The subsequent recovery would be wave 2, typically unfolding as an ABC corrective move. - This wave 2 rally would provide a high-probability sell opportunity, especially if H4 momentum rebounds into the overbought zone again. 3. Key Notes & Risk Awareness One critical point to emphasize: - Weekly momentum is preparing to enter the overbought zone and potentially reverse. - Daily momentum is already overbought. - This momentum confluence suggests that the coming decline could be more extended, aiming to push weekly momentum back toward oversold conditions. In practice, weekly momentum often requires multiple oscillations (commonly around three reversals) to complete a full corrective cycle. Therefore: - Patience is essential during this phase. - Avoid prematurely adopting a long-term bullish bias. - Always wait for price action confirmation. This analysis represents a directional warning and scenario planning only. All expectations must be confirmed by real-time price behavior. 4. Conclusion For the upcoming week, the primary bias favors a bearish corrective phase. Detailed trading plans (entries, stop loss, and targets) will be updated daily as new price data becomes available.Elliott Wave Analysis XAUUSD – December 15, 2025 1. Momentum Daily (D1): Daily momentum is currently showing a constructive signal, suggesting that a reversal may be approaching. However, this does not confirm an immediate price decline. Instead, it indicates that D1 momentum is weakening, which often precedes a trend transition rather than an instant reversal. H4: H4 momentum is now preparing to turn upward from the oversold zone. This is not an ideal signal in the current context, as we are evaluating a potential wave top. The H4 momentum is indirectly warning that the bullish move may not be finished yet on the H4 timeframe, and price could continue higher before a proper reversal develops. H1: H1 momentum is currently compressed in the overbought zone. While a short-term pullback on H1 is expected, the compression of momentum suggests that the upside structure has not fully completed, and the rally may still extend. 2. Elliott Wave Structure Daily Timeframe (D1) On the daily chart, price remains within a Flat corrective structure (W–X–Y). As D1 momentum continues to contract and prepares for a potential reversal, the top of wave X appears to be very close. At present, price is trading around the yellow wave 3 high, which is also the typical termination zone for wave X in a Flat structure. Once wave X is completed, we expect a decline toward the purple wave W area to finalize wave Y. H4 Timeframe On H4, price was in the green wave 5 during yesterday’s session. Following the bearish move on Friday, we initially expected that a top had formed. However, current H4 momentum is preparing to turn bullish, which means we must remain cautious. If H4 momentum confirms a bullish reversal, the upward move is likely to continue, especially considering that price is now rising again and approaching the previous high as the new session opens. H1 Timeframe On H1, yesterday’s primary count was a red 1–2–3–4–5 structure, as marked on the chart. However, due to the new signals coming from H4 momentum, a second wave-count scenario must be considered. Scenario 1 (original plan): The key condition is that price does not break above 4353. If H4 momentum reaches the overbought zone and then confirms a bearish reversal, we would expect a 5-wave decline to unfold. In this case, the 4334 zone is considered an appropriate area for the current corrective rally to terminate, and price behavior at this level will be closely monitored. Scenario 2 (alternative plan): If price continues higher and develops a black 1–2–3–4–5 structure, then with H4 momentum entering the overbought zone: - Price may equal or exceed the 4353 high - The market may then form either a Flat correction for black wave 4, or this advance could represent an extended black wave 5 3. Interim Conclusion - At this stage, the final wave structure has not yet been fully confirmed. Therefore: - Additional confirmation from price action and H4 momentum is required - It is important to avoid committing to a rigid trading plan too early while the structure remains incomplete I will continue to update the analysis as soon as clearer technical and wave confirmations appear.Market Update With price pushing up into the current high area, the most reasonable scenario is that the market is forming a Flat ABC corrective structure. On the H1 timeframe, the strong bearish candle that has just closed suggests that wave B has likely completed, and price is now moving into wave C to the downside. At the current price location, this is considered a good area to enter a swing sell, trading wave C with the expectation that price will move back toward the base of the structure. One imperfect factor in this setup is that H1 momentum is currently in the oversold zone. However, trading is always about decision-making under non-perfect conditions. Based on the wave structure and overall context, I have entered a sell position at the current zone. Trade Plan: Sell Zone: 4330 – 4333 Stop Loss: 4350 Take Profit 1: 4296 Take Profit 2: 4260
Disclaimer
Any content and materials included in Sahmeto's website and official communication channels are a compilation of personal opinions and analyses and are not binding. They do not constitute any recommendation for buying, selling, entering or exiting the stock market and cryptocurrency market. Also, all news and analyses included in the website and channels are merely republished information from official and unofficial domestic and foreign sources, and it is obvious that users of the said content are responsible for following up and ensuring the authenticity and accuracy of the materials. Therefore, while disclaiming responsibility, it is declared that the responsibility for any decision-making, action, and potential profit and loss in the capital market and cryptocurrency market lies with the trader.