Technical analysis by WavePoint_FX about Symbol PAXG: Buy recommendation (12/17/2025)

WavePoint_FX
تحليل موجات إليوت XAUUSD – 17/12/2025
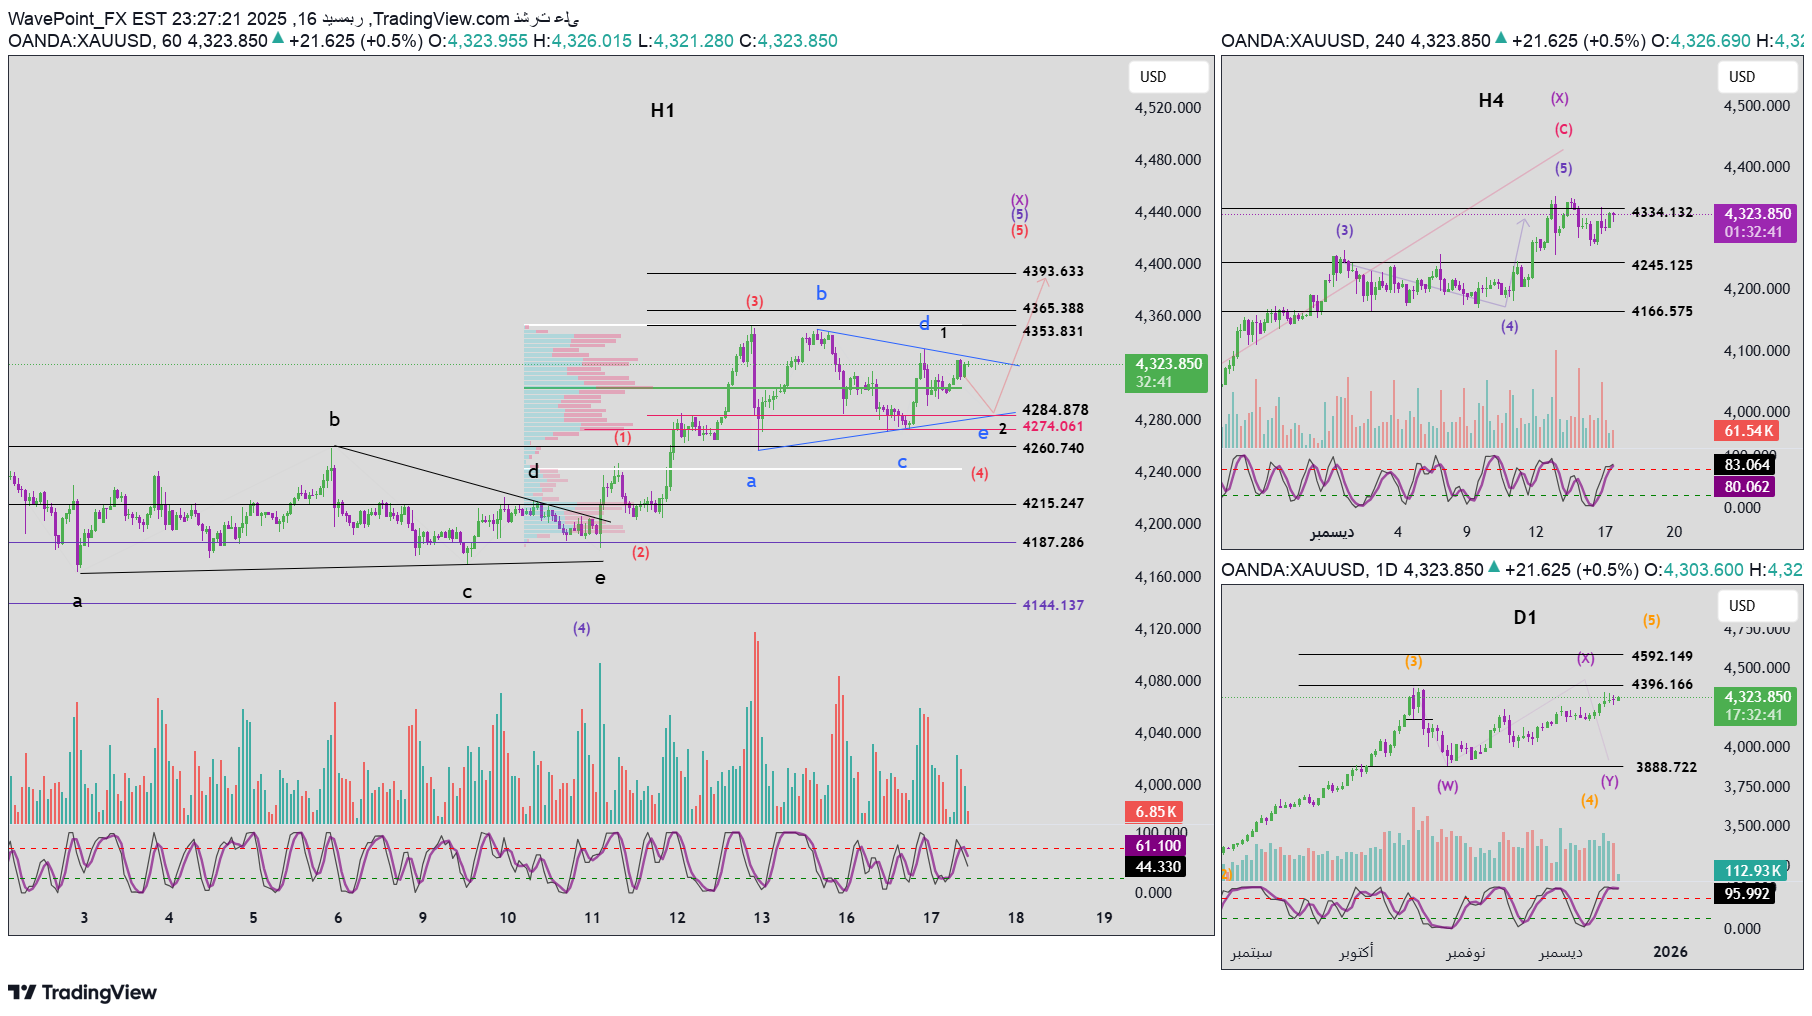
1. Momentum Daily time frame D1 After closing the D1 candle, we notice that the daily momentum is in an overlapping/compressed state. This situation does not negate the current upward trend, but it does not confirm that a reversal has occurred yet. We need to wait for clear confirmation of the daily frame momentum. H4 time frame H4 momentum is also starting to compress and is showing early signs of a possible reversal. At the moment there is no confirmed bearish candle on H4, so it is best to wait and watch. H1 time frame H1 momentum is declining, indicating that a short-term correction or sideways move may be underway on the H1 frame. 2. Elliott wave structure Wave structure on D1 The wave structure on the daily frame has not seen significant changes. As the momentum continues to squeeze, we will likely see 1 to 2 additional bullish daily candles. The upper target area near 4396 is still valid to complete wave X. Wave structure on H4 Although H4 momentum reached overbought territory, the price failed to break the previous high at 4354. This is an early warning sign of weak purchasing power. Although the signal is not sufficient to confirm a reversal, it supports the possibility of the start of the downward Y wave as mentioned in the previous plans. Wave structure on H1 The failure of the price to record a new high as the H4 momentum reached overbought led to two main scenarios on the H1 frame: The first scenario – a triangle-shaped corrective pattern (abcde – in blue): The price is likely in the final stage of forming a triangle. If the price falls below the lower border to complete wave e, the expected completion area is located near 4284. Currently the price is still above the POC area (green), so it is not excluded that wave e has already completed. A breakout of the trend line b–d will give a breakout pattern entry signal. Scenario 2 – 5-wave impulsive structure (1–2–3–4–5 – in black): The price is currently in the process of forming the second wave (2). The expected target for the second wave is also near 4284. 👉 Important meeting area Both scenarios meet at the 4284 level, making this area a high probability buy zone. ⚠️ Note the risks In case the price closes below the 4274 level, you must prepare for the possibility of a deeper decline, and it will be necessary to re-evaluate the current buying plan. 3. Trading plan Buying zone: 4285 – 4283 Stop loss: 4273 First target: 4329 Second goal: 4353 Third goal: 4365