Technical analysis by WavePoint_FX about Symbol PAXG: Buy recommendation (12/16/2025)

WavePoint_FX
تحليل موجات إليوت XAUUSD – 16 ديسمبر 2025
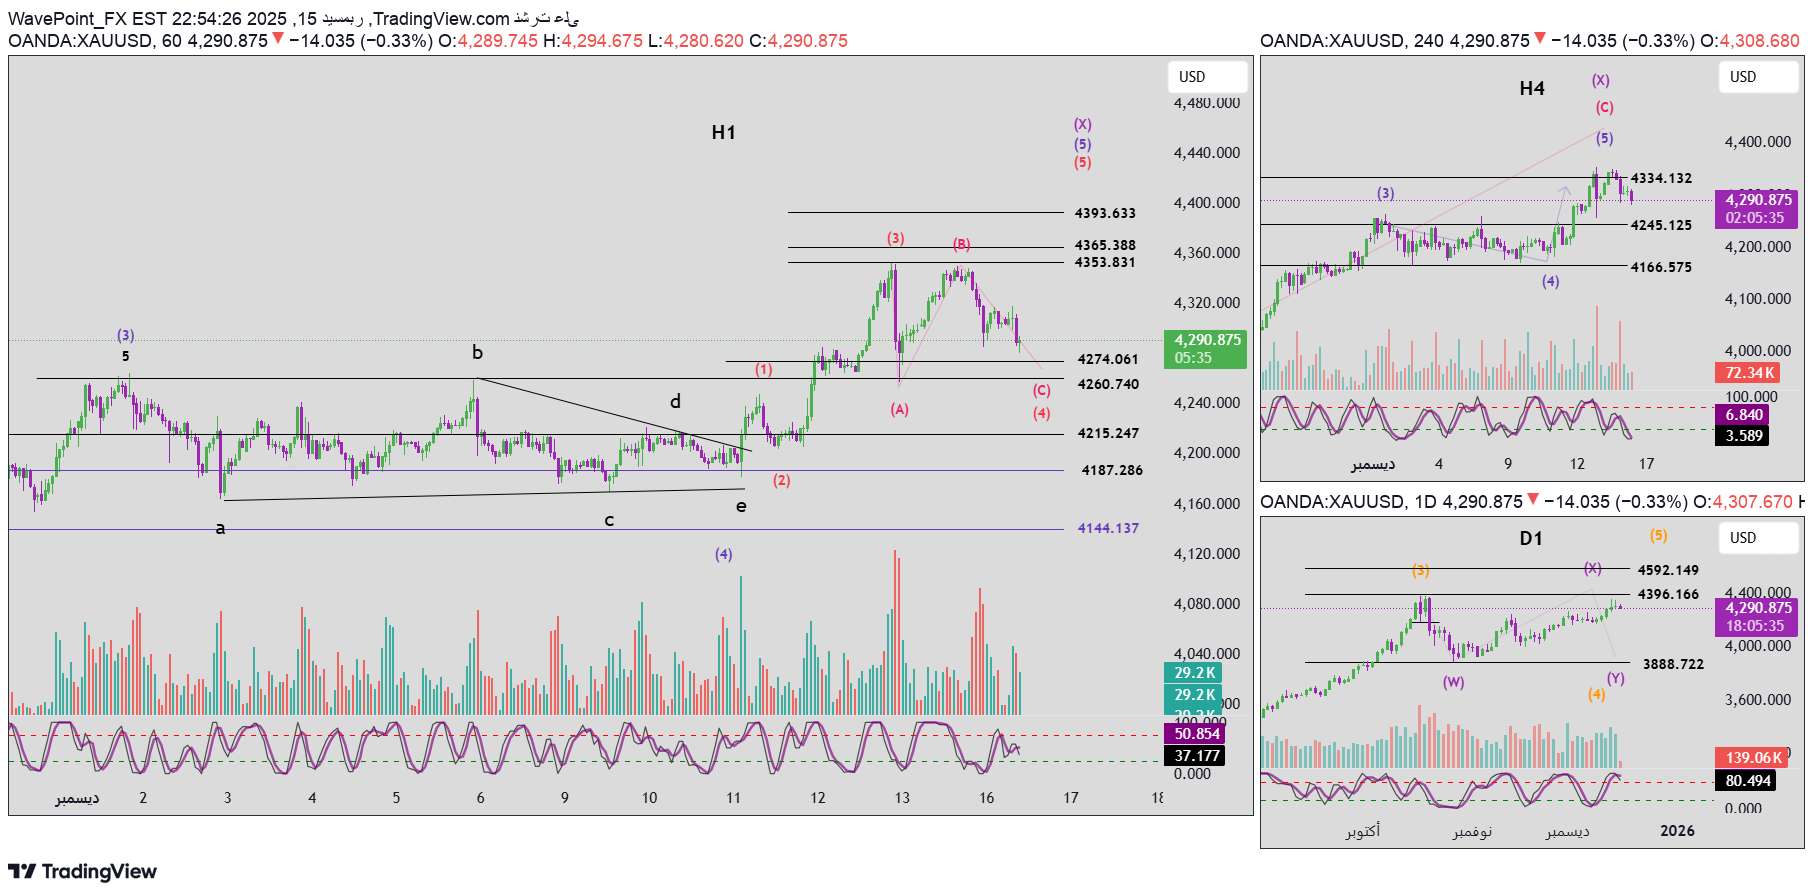
1. Momentum Daily time frame D1: The daily frame's momentum is showing signs of a bearish reversal, but we must wait for the close of today's candle to confirm this reversal. This confirmation is very important to determine whether the market has formed a medium-term top. H4 time frame: The momentum on the H4 frame is currently in the oversold zone and preparing for a bullish reversal. When this reversal is confirmed, a technical bullish bounce lasting 4 to 5 H4 candles is expected. H1 time frame: H1 momentum is still bearish and heading towards the oversold zone. We will wait for the price to reach this area while confirming a bullish reversal in momentum, which may result in a short-term corrective upward move on the H1 frame. 2. Elliott wave structure Daily time frame D1: If D1 momentum confirms the bearish reversal with the close of today's candle, the price will likely be at the top of wave X in violet. After wave X completes, the market may enter the purple wave Y, which is likely to form as a flat correction. → The expected target of wave Y is located near the 3888 level. H4 time frame: The price is currently moving inside wave 5 in green. As this wave completes, we will also see wave C and wave X complete on the larger time frame. Since H4 momentum is in the oversold zone, a short-term upward movement is likely to occur before the major structure is completed. H1 time frame: The current decline is likely to be within the red 1–2–3–4–5 structure within green wave 5, as the price is currently in red wave 4. This red wave 4 is forming as a Flat correction, which corresponds to the scenario analyzed in the previous plan. Red wave C target: near 4260 Above this level there is the 4274 area, which is an area separating high and low liquidity Therefore, when the price reaches the 4260–4274 area, we will combine this area with a bullish H1 momentum reversal confirmation to search for buying opportunities. Expected goals for red wave 5: First target: 4365 Second goal: 4393 3. Important points to monitor As mentioned in previous plans, the recent upward rebound did not reach the 4353 level, and this does not negate the scenario of the completion of the green wave 5 near this level (see the weekly plan). Therefore, if the following is true: Confirmation of a bearish reversal of D1 momentum after the close of today's candle The next bounce on H4 failed to breach the 4353 level → You must prepare for the possibility that the violet Y wave on the daily frame has already begun. 4. Trading plan Buy Zone: 4261 – 4259 Stop Loss: 4240 First target (TP1): 4286 Second target (TP2): 4319 Third target (TP3): 4365