Technical analysis by WavePoint_FX about Symbol PAXG: Sell recommendation (13 hour ago)

WavePoint_FX
تحليل موجات إليوت – XAUUSD الأسبوع الرابع من شهر ديسمبر
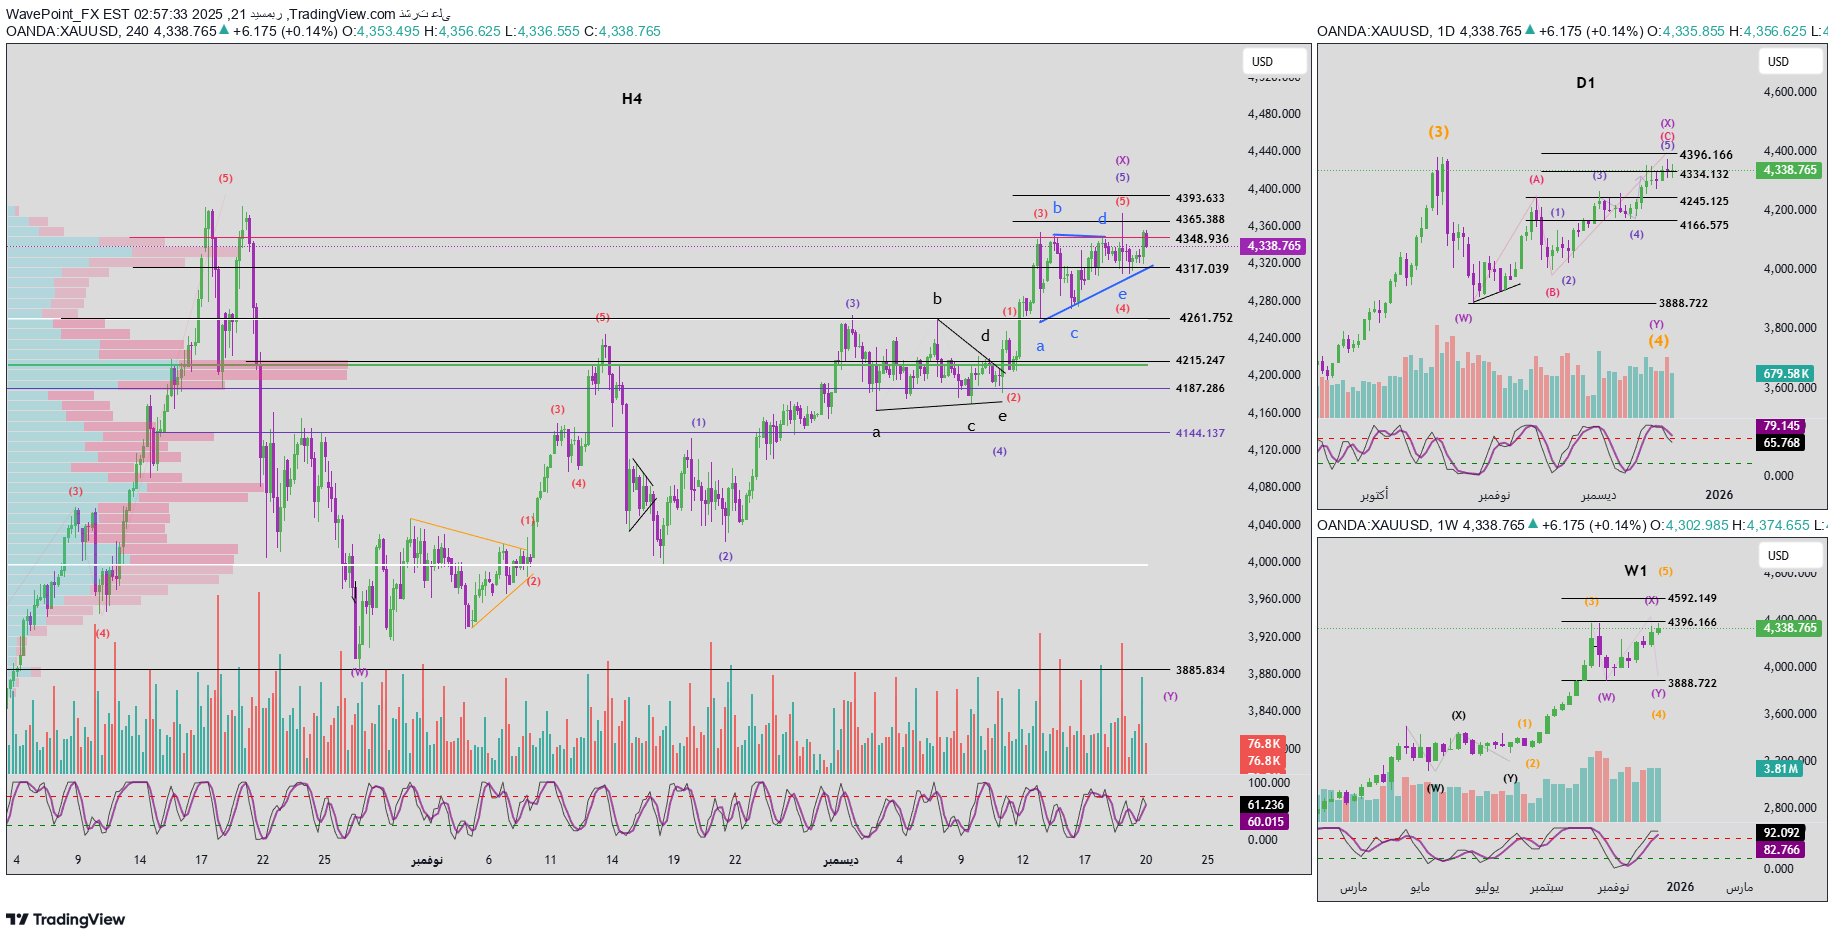
1. Momentum Weekly frame (W1) The weekly frame's momentum is preparing to reverse to the downside. If a confirmation candle appears during the next week, a downward trend is likely to form on the weekly frame, which indicates the beginning of a correction phase that may extend for several weeks. Daily frame (D1) The daily momentum has already confirmed the bearish reversal, and therefore the bearish trend is expected to be dominant during the coming week. Frame H4 H4 momentum is close to confirming a bearish reversal, indicating the possibility of the beginning of selling pressure since the opening of the Asian session at the beginning of the week. 2. Elliott wave structure Weekly frame (W1) The price structure on the weekly frame shows that the market is at the top of the third wave (in yellow). Combined with the weekly momentum preparing for a reversal, the price is likely to continue into the fourth wave (in yellow) in the form of a flat correction. After wave X is completed, the price is expected to continue falling in line with the weekly momentum to complete wave Y. Wave Y may take several weeks for the weekly momentum to enter the oversold zone. Daily frame (D1) Within the X wave structure in violet, an ABC corrective pattern in red is forming. Inside the red wave C, we notice an impulsive structure consisting of five waves (1–2–3–4–5) in blue. Currently, the price is trading in the fifth blue wave. With the daily momentum reversing to the downside, I expect the fifth blue wave to have completed, which means: The red C wave is completed Wave X violet is completed After that, the market is likely to enter a bearish phase to form wave Y. In terms of timing: The previous W wave took about 3 weeks Therefore, wave Y is expected to take at least a similar amount of time Over the next week, I expect to see strong selling pressure with a sharp and clear downward movement in the form of a five-wave bearish structure. H4 structure Looking at the blue fifth wave, an internal structure consisting of five red waves (1–2–3–4–5) can be observed. The price's previous breach of the 4365 level indicates that the target of the fifth red wave has already been achieved. Current status: Daily momentum reversed lower H4 momentum is in the process of reversing downward The price failed to penetrate and stabilize above 4365 The last candle closed below the 4348 level Based on these data, I expect that the top of the fifth wave has already formed. 3. Volume Profile and price scenarios From a Volume Profile perspective: Level 4348 represents a high liquidity area and acts as strong resistance The price has not yet been able to penetrate this area decisively Main bearish scenario: If the price closes below the 4317 level (low liquidity area) by the open of the next session, the price will likely quickly pass through this area and fall towards the next high liquidity area near 4215. This scenario will constitute a strong confirmation of the completion of the fifth wave. Alternative scenario: If the price manages to break through and hold above 4348, the fifth wave may not have been completed yet, and may extend in the form of a Terminal Triangle. In this case, I will continue to monitor the upper targets and update the analysis as additional data becomes available. 4. Trading plan At current levels, this area is a good potential selling area. However, to determine an accurate entry point, I need further confirmation from price action when the market opens tomorrow. When clearer signals appear, I will update the trading plan.