Technical analysis by WavePoint_FX about Symbol PAXG: Sell recommendation (15 hour ago)

WavePoint_FX
تحلیل موج الیوت طلا (XAUUSD): آمادهسازی برای ریزش چند هفتهای؟ (هفته چهارم دسامبر)
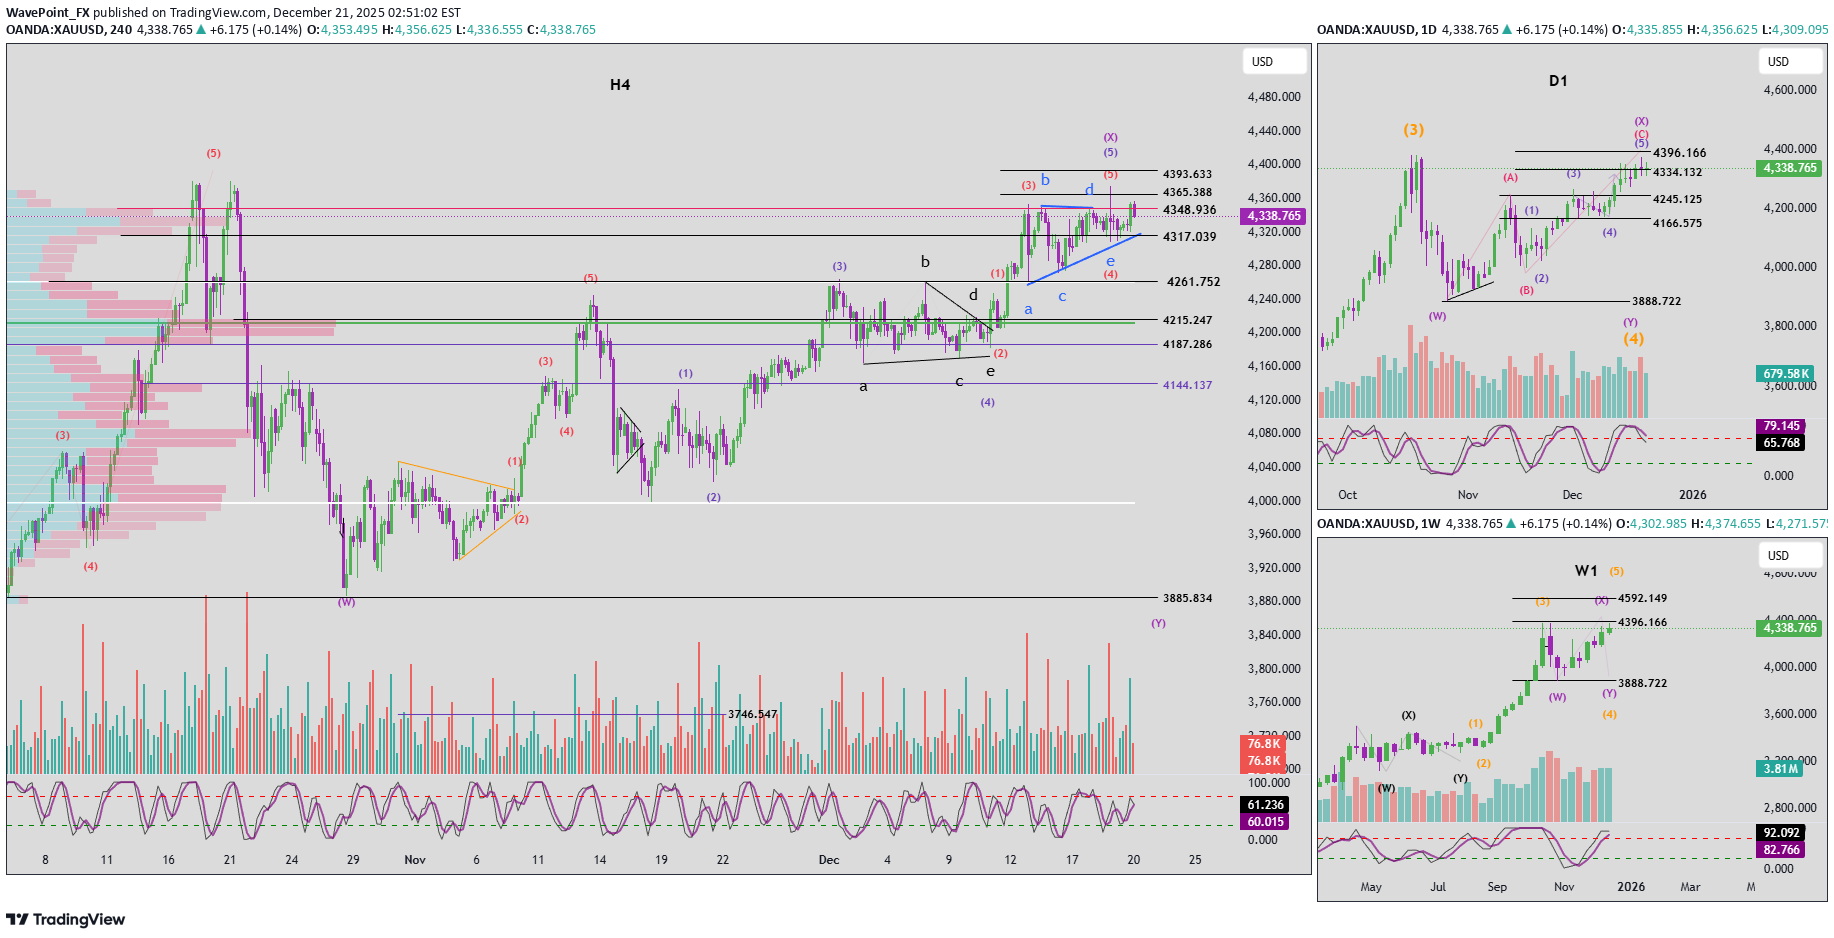
1. Momentum Overview Weekly (W1) Weekly momentum is currently preparing to reverse to the downside. If a confirmation candle appears next week, a weekly bearish trend is likely to be established. This would indicate the beginning of a multi-week corrective phase. Daily (D1) Daily momentum has already confirmed a bearish reversal. Therefore, the downside bias is expected to dominate in the coming week. H4 H4 momentum is approaching bearish confirmation. This suggests that selling pressure may begin to emerge as early as the Asian session at the start of the week. 2. Elliott Wave Structure Weekly (W1) The price structure on W1 clearly shows that the market is positioned at the top of Wave 3 (yellow). Combined with the weekly momentum preparing to reverse, the market is likely to continue into Wave 4 (yellow), developing as a flat corrective structure. After Wave X is completed, price is expected to decline in line with weekly momentum to complete Wave Y. The completion of Wave Y may take several weeks, until weekly momentum reaches the oversold zone. Daily (D1) Within the purple Wave X structure, price is forming a red ABC corrective pattern. Inside red Wave C, we observe a five-wave impulse structure (1–2–3–4–5) in blue. At present, price is trading in blue Wave 5. With daily momentum already reversing to the downside, I expect blue Wave 5 to be complete, which implies: - Red Wave C has finished - Purple Wave X has also completed Following this, the market should enter a declining phase to form Wave Y. Regarding time symmetry: - Wave W previously took approximately 3 weeks to complete - Therefore, Wave Y is expected to last at least a similar duration In the coming week, I want to see strong selling pressure, with sharp downside movement, forming a clear five-wave bearish structure. H4 Structure Looking at the blue Wave 5, we can identify an internal five-wave red structure (1–2–3–4–5). The breakout above 4365 suggests that the price objective of red Wave 5 has already been achieved. Currently: - Daily momentum has reversed bearish - H4 momentum is also turning bearish - Price failed to break and hold above 4365 - The latest candle closed below 4348 Based on these combined signals, I expect the top of Wave 5 to be in place. 3. Volume Profile & Price Scenarios From the Volume Profile perspective: - 4348 is a high-liquidity zone acting as a strong resistance - Price has not yet been able to break decisively above this area Primary bearish scenario: If price closes below 4317 (a low-liquidity void) at the start of the next session, the market is likely to move quickly through this area and decline toward the next high-liquidity zone near 4215. This scenario would provide strong confirmation that Wave 5 has completed. Alternative scenario: If price breaks above and holds above 4348, Wave 5 may extend further, potentially forming a terminal triangle. In that case, I will continue to monitor higher target zones and provide updates once additional data becomes available. 4. Trading Plan At current levels, this is a potentially strong sell zone. However, to define a precise entry plan, I need additional confirmation from price action at the market open tomorrow. Once clearer signals appear, I will update the trading plan accordingly.