Technical analysis by WavePoint_FX about Symbol PAXG: Buy recommendation (12/16/2025)

WavePoint_FX
Elliott Wave Analysis XAUUSD – December 16, 2025
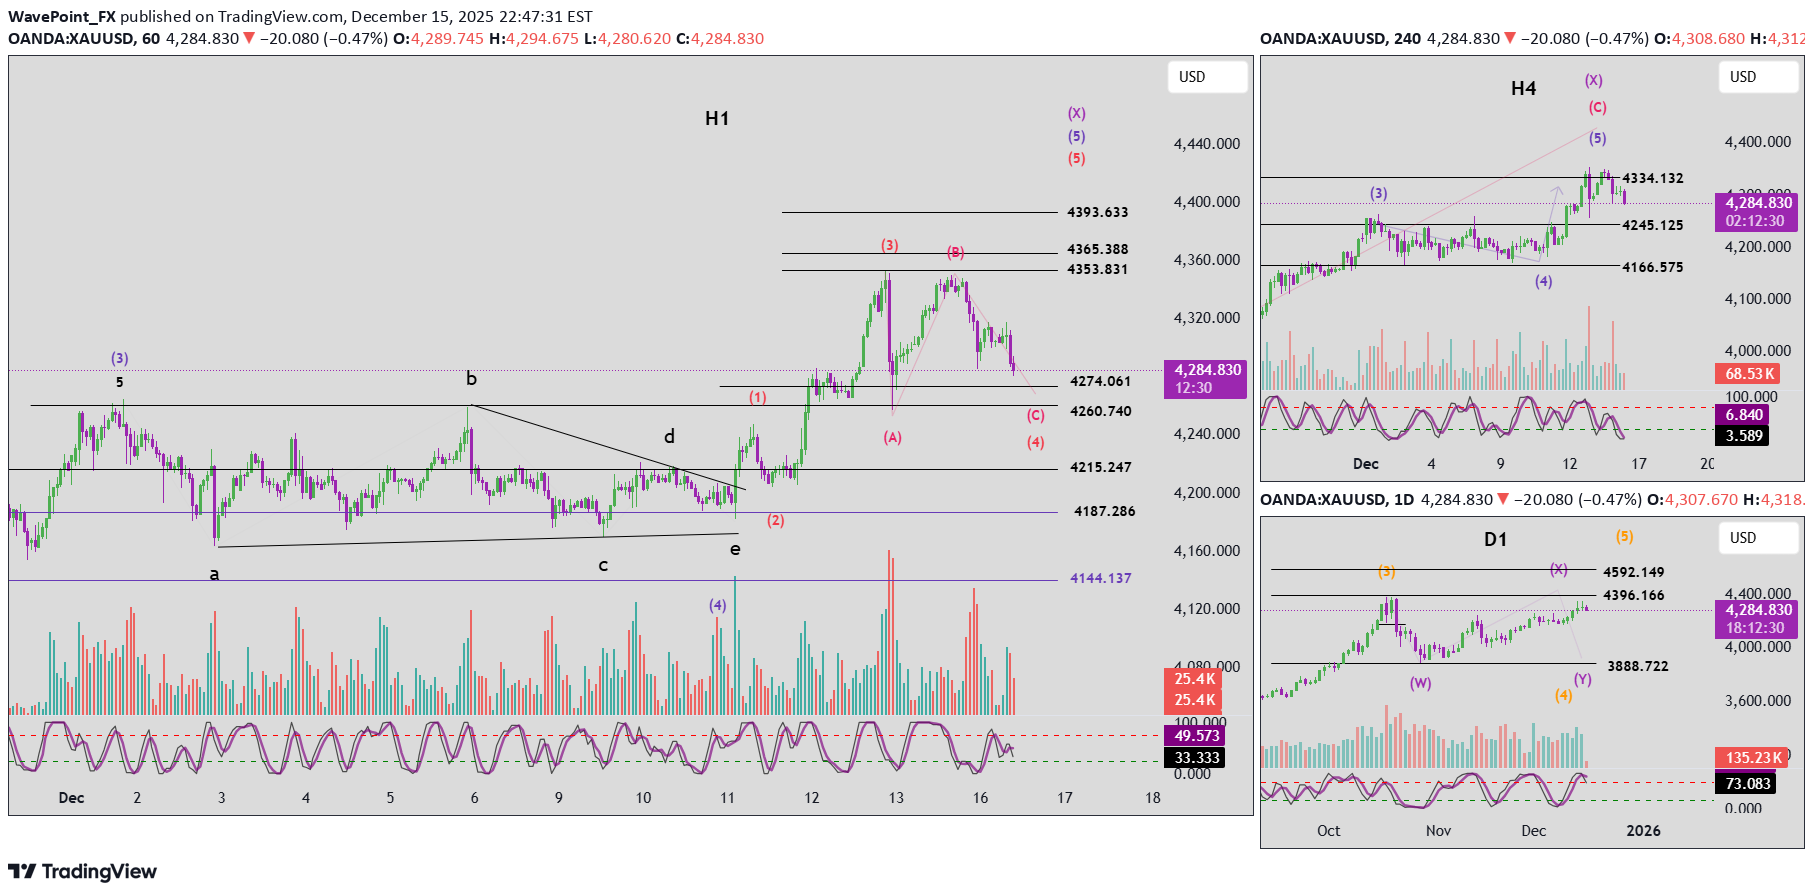
1. Momentum D1 (Daily): Daily momentum is showing signs of a bearish reversal. However, we must wait for today’s D1 candle to close to confirm this signal. This is a critical confirmation, as it will determine whether the market has formed a medium-term top. H4: H4 momentum is currently in the oversold zone and is preparing for a bullish reversal. Once confirmed, we can expect a technical rebound lasting approximately 4–5 H4 candles. H1: H1 momentum remains bearish and is moving toward the oversold area. We will wait for price to reach oversold conditions and for momentum to confirm a bullish reversal, which would signal a short-term H1 corrective rally. --- 2. Elliott Wave Structure D1: With D1 momentum turning down, if today’s daily candle confirms the reversal, price is likely forming the top of the purple wave X. After wave X completes, the market may enter purple wave Y, which is most likely developing as a Flat correction. → The projected target for wave Y is near the 3888 zone. H4: Price is currently trading within green wave 5. Once this wave 5 completes, it will also mark the completion of wave C and wave X on the higher timeframe. Given that H4 momentum is oversold, a short-term upward move is expected before the broader structure completes. H1: The current decline is likely forming a red 1–2–3–4–5 structure within green wave 5. At this stage, price is developing red wave 4. This red wave 4 is unfolding as a Flat corrective structure, consistent with the scenario outlined in yesterday’s plan. Target for red wave C: around 4260 Above this level, 4274 represents a high-liquidity / low-liquidity boundary Therefore, when price reaches the 4260–4274 zone, we will combine this area with H1 momentum bullish confirmation to look for long entries. Expected targets for red wave 5: Target 1: 4365 Target 2: 4393 3. Key Notes As discussed in previous plans, the recent rebound did not reach the 4353 level. This does not invalidate the scenario in which green wave 5 completes near this area (refer to the weekly plan). Therefore, if: D1 momentum confirms a bearish reversal at today’s close, and The upcoming H4 rebound fails to break above 4353, → We must be prepared for the scenario in which purple wave Y on the D1 timeframe has already begun. 4. Trading Plan Buy Zone: 4261 – 4259 Stop Loss: 4240 Take Profit 1: 4286 Take Profit 2: 4319 Take Profit 3: 4365Market Update Ahead of the U.S. Session Looking at H4 and H1 momentum, both timeframes are currently preparing for a bullish reversal. On the H1 timeframe, there are approximately 30 minutes left before the candle closes. At the moment, a strong bullish candle is forming, indicating increasing buying pressure. If this candle maintains its bullish strength into the close, it will provide clear confirmation that H1 momentum has shifted to the upside. From a price perspective, the market has already reached the target zone mentioned in the previous plan. Therefore, the correct approach at this stage is to wait for the H1 candle to close for confirmation. If the H1 candle closes with strong bullish momentum, we can consider placing a Buy Stop order above the high of the confirmed bullish candle, aiming to follow the continuation of the upward move once price breaks higher.If you managed to enter the Buy Stop order, it would have been triggered at 4295, and up to now it has already gained around 350 pips.