Technical analysis by WavePoint_FX about Symbol PAXG: Buy recommendation (12/18/2025)

WavePoint_FX
تحلیل موج الیوت طلا (XAUUSD): آمادهسازی برای ریزش بزرگ یا صعود نهایی؟
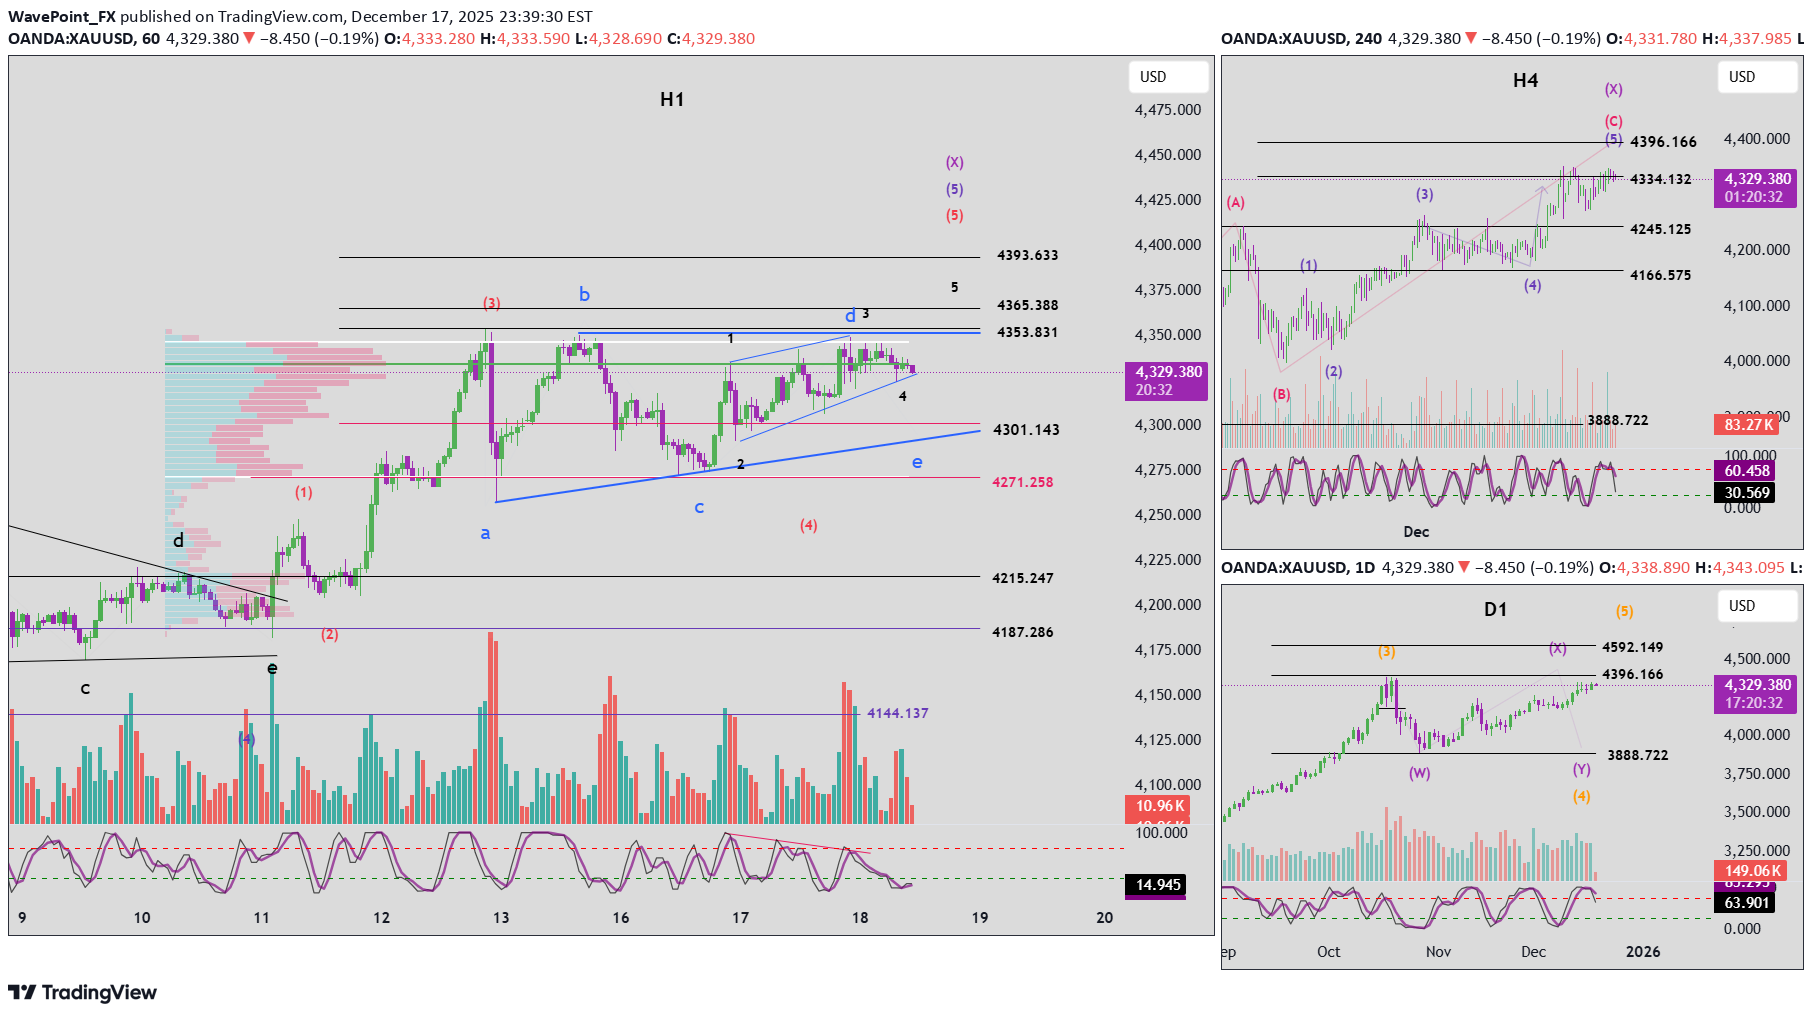
1. Momentum Analysis Daily (D1) Daily momentum is showing early signs of a bearish reversal. However, confirmation is still required by waiting for today’s D1 candle close. If the reversal is confirmed, this would suggest that Wave X is topping, and price is likely to move lower following D1 momentum to complete Wave Y. H4 H4 momentum is currently declining. In the near term, this suggests: - A corrective decline on H4, or - Sideway consolidation until H4 momentum reverses back to the upside H1 H1 momentum is showing signs of a bullish reversal, indicating: - A potential short-term upward move, or - Continued sideways movement within a tightening range 2. Elliott Wave Structure Daily (D1) The D1 wave structure remains largely unchanged from the previous plan. However, with D1 momentum weakening and starting to reverse, the probability of a Wave X top forming within today or the next few sessions is increasing. H4 On H4, price may still be developing Wave 5 (blue) of Wave C (red) within the larger Wave X structure. Given that the D1 structure resembles a Flat pattern, a move toward or equal to Wave 3 high near 4396 remains a realistic scenario. H1 Within Wave 5 (blue), we can observe an internal 5-wave structure (red). At this stage, price may be forming: - Wave 4 (red), or - Wave 5 (red), depending on upcoming price behavior Current advances are: - Overlapping - Lacking clear impulsive strength When combined with declining H4 momentum, this leads to two primary scenarios. 3. Main Scenarios 🔹 Scenario 1: Wave 4 Triangle Price remains in Wave 4, developing a triangle structure. In this case: - Wave d is likely complete - Price is currently forming Wave e 📌 The expected termination zone for Wave e: - Aligns with a bullish reversal in H4 momentum - Converges with the lower boundary of the triangle From Volume Profile analysis: - Price is currently trading around the POC (Point of Control), which also aligns with the Wave 3 top - Below, the 4301 zone represents a key liquidity boundary → this is the primary expectation for Wave e completion - Further below, 4271 marks a strong High–Low volume boundary ⚠️ A daily close below 4271 would significantly increase the probability of a deeper bearish scenario. 🔹 Scenario 2: Wave 5 (Red) – Ending Triangle Another high-probability scenario is that price is currently within Wave 5 (red). This Wave 5 may be forming an Ending Triangle with an internal 5-wave black structure. Key characteristics: - Gradually rising price - Strong overlap - Weakening momentum In this scenario: - Price should remain supported above the current POC - A final push higher toward 4365 is expected - Completion of Wave 5 would likely be followed by a sharp and steep bearish move, which is typical after an ending triangle 📌 This scenario requires additional price confirmation, and updates will be provided as structure becomes clearer. 4. Trading Plan Buy Zone: 4302 – 4300 Stop Loss: 4290 Take Profit Targets: TP1: 4332 TP2: 4365 TP3: 4393XAUUSD Plan Update Momentum H4 momentum has now confirmed a bullish reversal. In the near term, this suggests a potential upward move lasting approximately 4 to 5 H4 candles. At the same time, the CPI release has triggered a bullish reversal in H1 momentum, with a strong H1 candle closing with full bullish strength. This indicates that buy-side pressure is entering the market aggressively. Price is currently retesting the POC zone. If price can hold above this area, a short-term bullish trend is likely to continue. Wave Structure and Price Scenarios Based on the wave structure discussed above, the bullish scenario allows price to continue rising toward the target zones at 4365 and 4393. However, it is important to note that the previous pullback did not clearly reach the lower boundary of the triangle. As a result, there is not yet sufficient confirmation to determine whether the structure represents: - A Wave 4 triangle, or - An ending triangle within Wave 5 Given this uncertainty, the market is currently considered to be in a late-stage wave environment. Therefore: - Observation is preferred, or - Only short-term scalping trades should be considered Even if the current upward move continues, it is unlikely to extend for a prolonged period. After completion, price is expected to resume a broader decline to complete Wave Y (purple), with a projected target near the Wave W base around the 3888 area.