Technical analysis by WavePoint_FX about Symbol PAXG: Buy recommendation (12/18/2025)

WavePoint_FX
تحليل موجات إليوت للذهب (XAUUSD): هل قمة الموجة X شکل گرفت؟ پیشبینی نوسانات قیمتی!
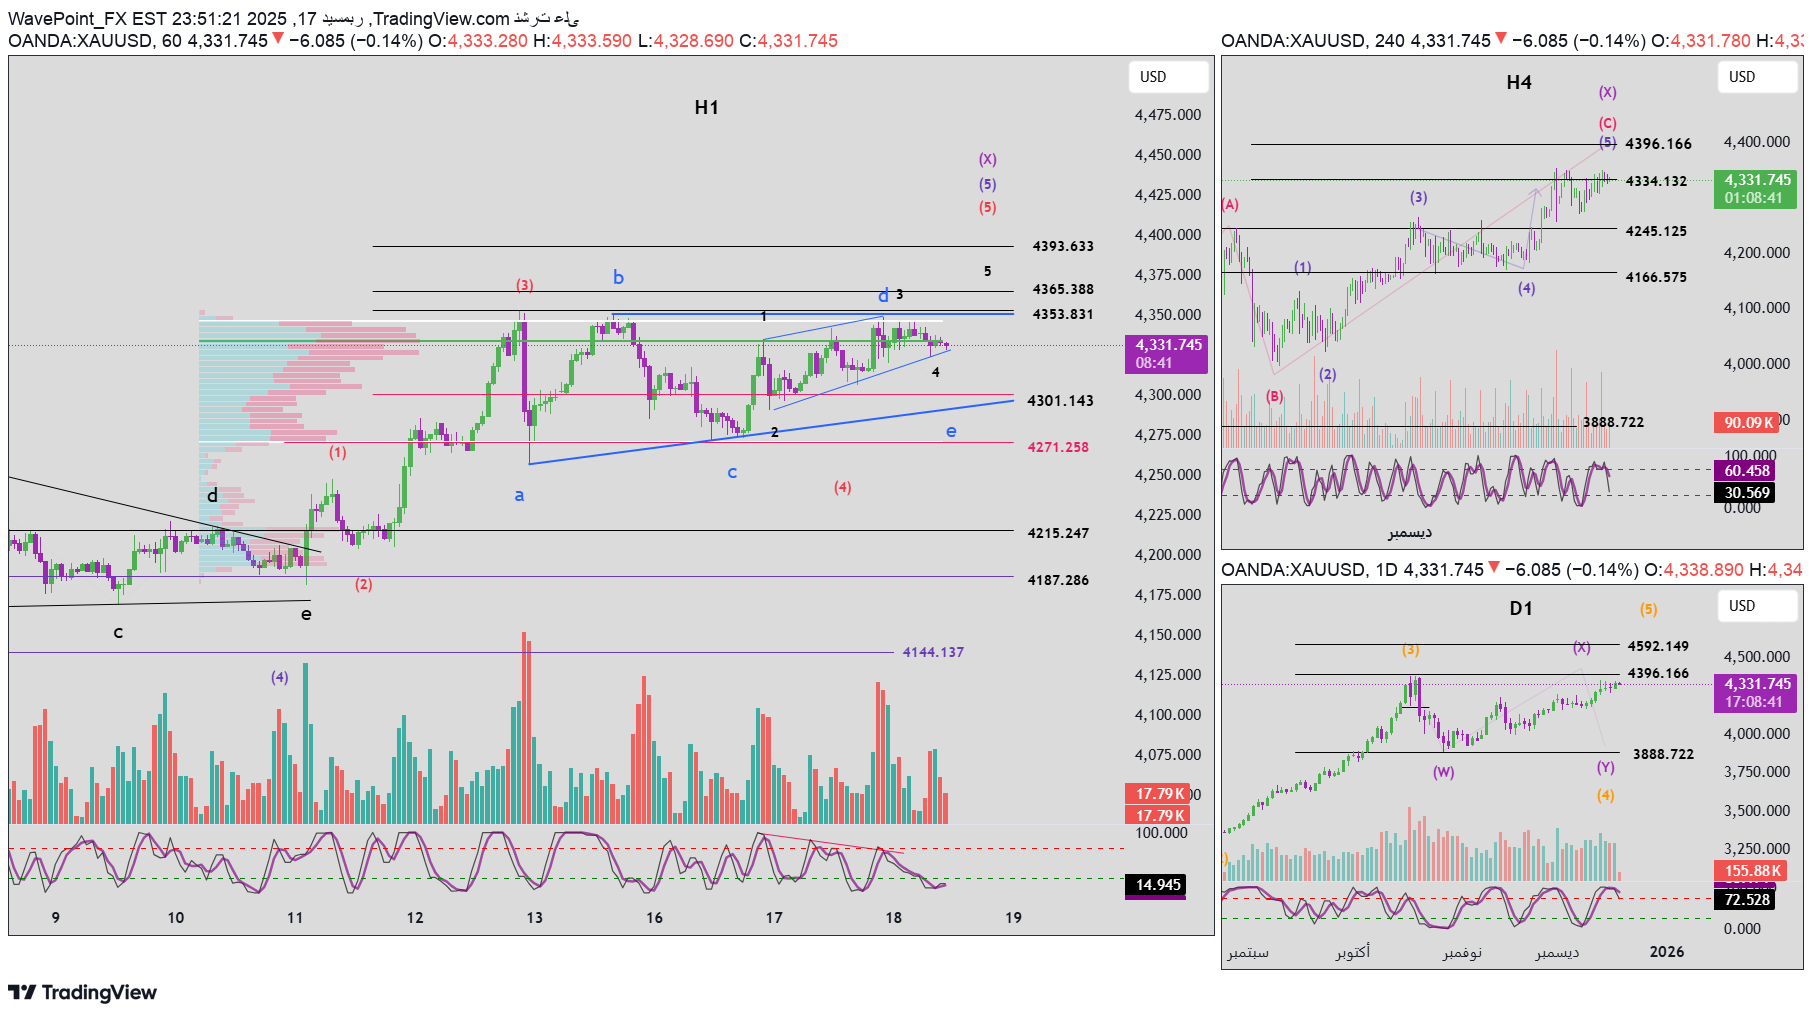
1. Momentum analysis Daily time frame (D1) The daily frame momentum is currently showing initial signs of a bearish reversal, however it is still necessary to wait for today's D1 candle close for confirmation. If the reversal is confirmed, it is likely that wave X has formed a top, and the price will move down with D1 momentum to complete wave Y. H4 time frame The 4-hour momentum is currently on the decline. In the near term, there are two possibilities: Bearish corrective movement on H4 frame Or move sideways until H4's momentum begins to reverse upward H1 time frame One hour momentum is showing signs of a bullish reversal, indicating: Possibility of a short-term uptick Or the continuation of the horizontal movement within a narrow range 2. Elliott wave structure Daily frame (D1) There is no fundamental change in the wave structure on the daily frame compared to the previous plan. However, as D1's momentum weakens and its reversal begins, the probability of a wave X peak increasing during the day or in the next few sessions. H4 time frame On the H4 frame, the price may still be in wave 5 (blue) of wave C (red) within the X wave structure. Given that the structure of D1 resembles a Flat pattern, the price rising to or approaching the top of wave 3 near 4396 remains a possible scenario. H1 time frame Inside wave 5 (blue), we observe an internal structure of 5 waves (red). At the current stage, the price may be at: Wave 4 (red), or Wave 5 (red), depending on the development of the upcoming movement The current upward movements are characterized by: Clear interference between waves Absence of strong impulsive momentum Gradual weakening of momentum As H4 momentum continues to decline, two main scenarios emerge. 3. Main scenarios The first scenario is wave 4 in the triangle pattern The price is still moving within wave 4 which takes the form of a triangle pattern. In this scenario: Wave d has probably completed The price is currently in the process of forming wave e The expiration zone of wave e is expected to be: It coincides with a bullish reversal in H4 momentum It converges with the lower border of the triangle Through Volume Profile analysis: The price is currently trading near the POC (point of control), which is the same area as the top of wave 3 Below it, the 4301 area represents an important liquidity limit and is the likely area for wave e to end Below that, the 4271 level is a strong separator between areas of high and low liquidity If the price closes below 4271, you should prepare for the possibility of a deeper decline. The second scenario, red wave 5, Ending Triangle pattern Another scenario with high probability is that the price is currently in wave 5 (red). This wave may take the form of an Ending Triangle with an internal structure of 5 waves in black. Main features: Gradual increase in price Strong interference between waves Continuing weakness in momentum In this scenario: The price is expected to remain supported above the current POC area A final upward push towards the 4365 level occurs After wave 5 is completed, a sharp and rapid decline is likely, which is a common behavior after Ending Triangle patterns This scenario needs additional confirmation from price action, and will be updated as the structure becomes clearer. 4. Trading plan Buying zone: 4302 – 4300 Stop loss: 4290 Profit goals: TP1: 4332 TP2: 4365 TP3: 4393