
RSI_Trading_point
@t_RSI_Trading_point

What symbols does the trader recommend buying?
Purchase History
پیام های تریدر
Filter
RSI_Trading_point
تحلیل فوری اتریوم: خطر سقوط به ۳۰۰۰ دلار پس از تست خط روند صعودی!
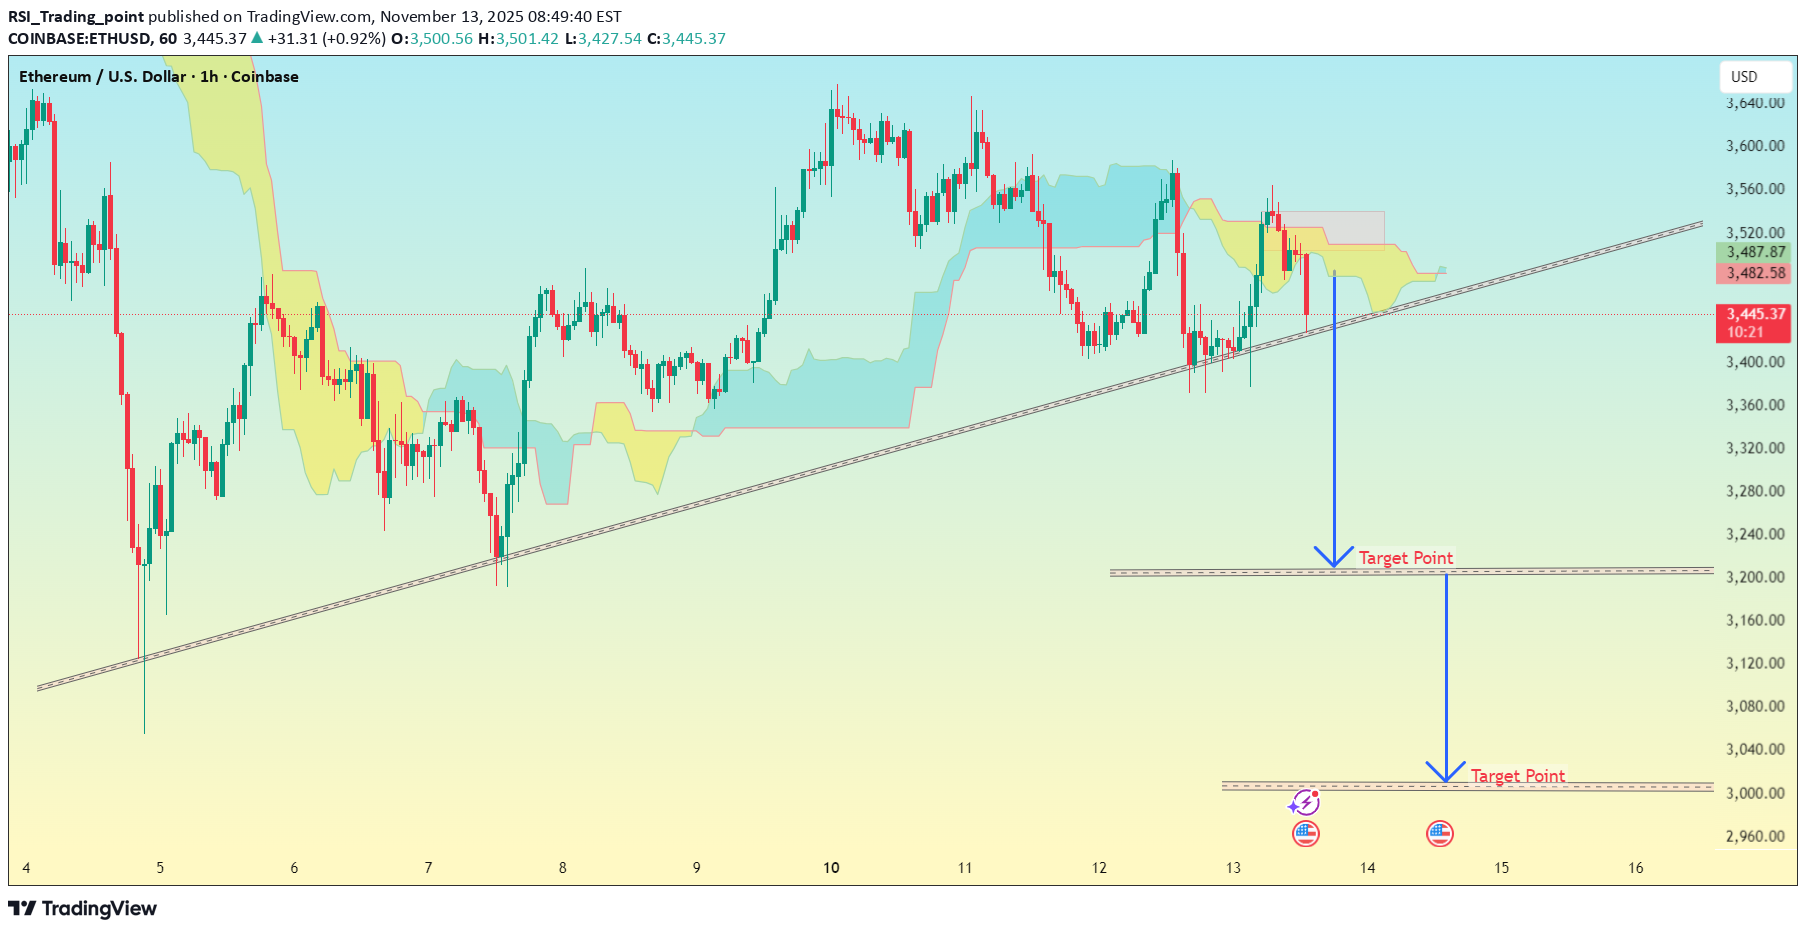
ETH/USD (1H timeframe) on Coinbase, and it’s clearly showing a raisin trendline test with two downside “Target Points” already drawn. Let’s break it down: --- 🔍 Chart Analysis Price is $3,441, sitting right on the ascending trendline. Ichimoku Cloud is turning bearish (price below the cloud). Trendline break looks likely — momentum is weak and candles are closing below the cloud. Two target zones (downside) are marked on my chart. --- 📉 Bearish Breakdown Scenario If ETH breaks and closes below the ascending trendline (~$3,440 area): First Target (TP1): around $3,230 – $3,250 → This aligns with previous horizontal support and midpoint of the last bounce. Second Target (TP2): around $3,000 – $3,050 → This is my deeper support zone — the next strong demand level on the chart. --- ⚠ Invalidation / Stop-Loss If ETH closes back above $3,520 – $3,540, that would invalidate the bearish move (trendline reclaim + cloud flip). --- 🧭 Trade Summary Entry (Breakdown): Below 3,440 TP1: 3,240 TP2: 3,020 SL: 3,540trade active
RSI_Trading_point
تحلیل تکنیکال بیت کوین (4 ساعته): سیگنال صعودی قوی با اهداف 118,000 دلار!
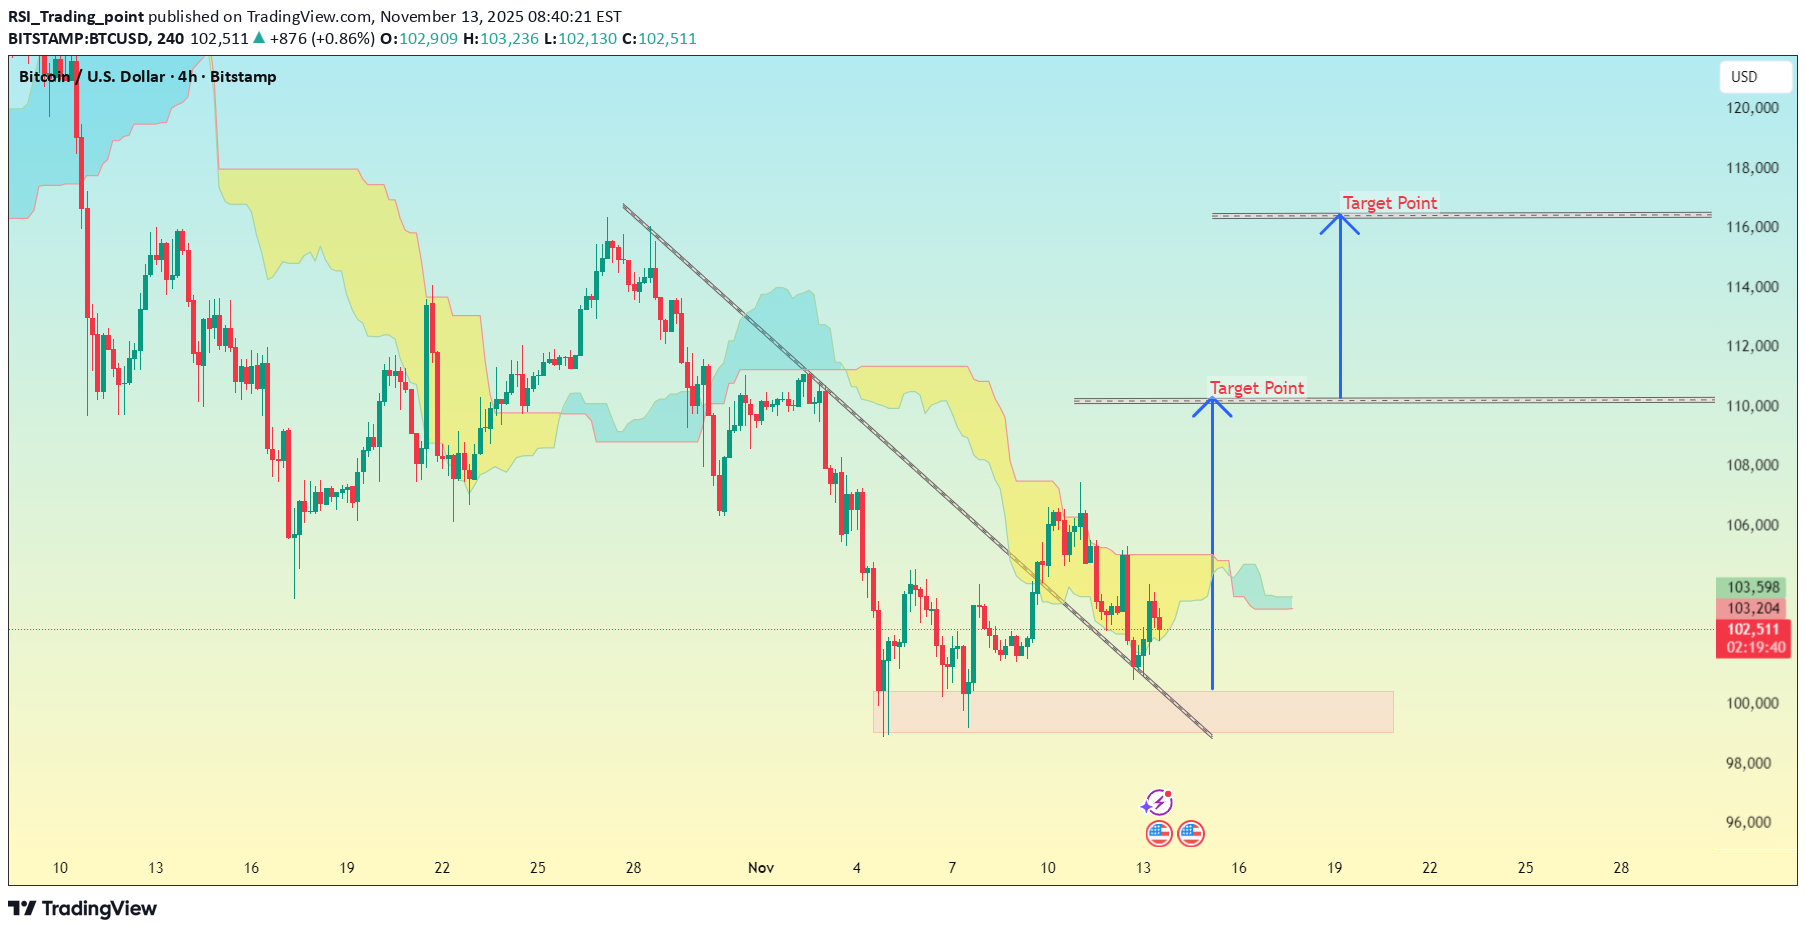
BTC/USD (4H timeframe) on Bitstamp, and the chart shows: A downtrend breakout from a descending trendline. Ichimoku Cloud turning bullish (price breaking into or above the cloud). A support zone around $100,000 – $101,000. Two target points already drawn on my chart. Based on the structure: 📈 Bullish Scenario If BTC confirms the breakout and stays above the descending trendline and cloud: First Target: around $110,000 – $111,000 Second Target: around $116,000 – $118,000 These match the levels marked on my chart and align with: Cloud breakout projection Prior supply/resistance zones Fibonacci 0.618–1.0 retracement zone (rough estimate) ⚠ Invalidation / Stop-Loss If BTC closes below the grey support box (~$100,000), it would invalidate the bullish setup — likely signaling more downside.active
RSI_Trading_point
تحلیل تکنیکال اپل (AAPL): هدف قیمتی بعدی کجاست؟ (رشد +7% ممکن است؟)
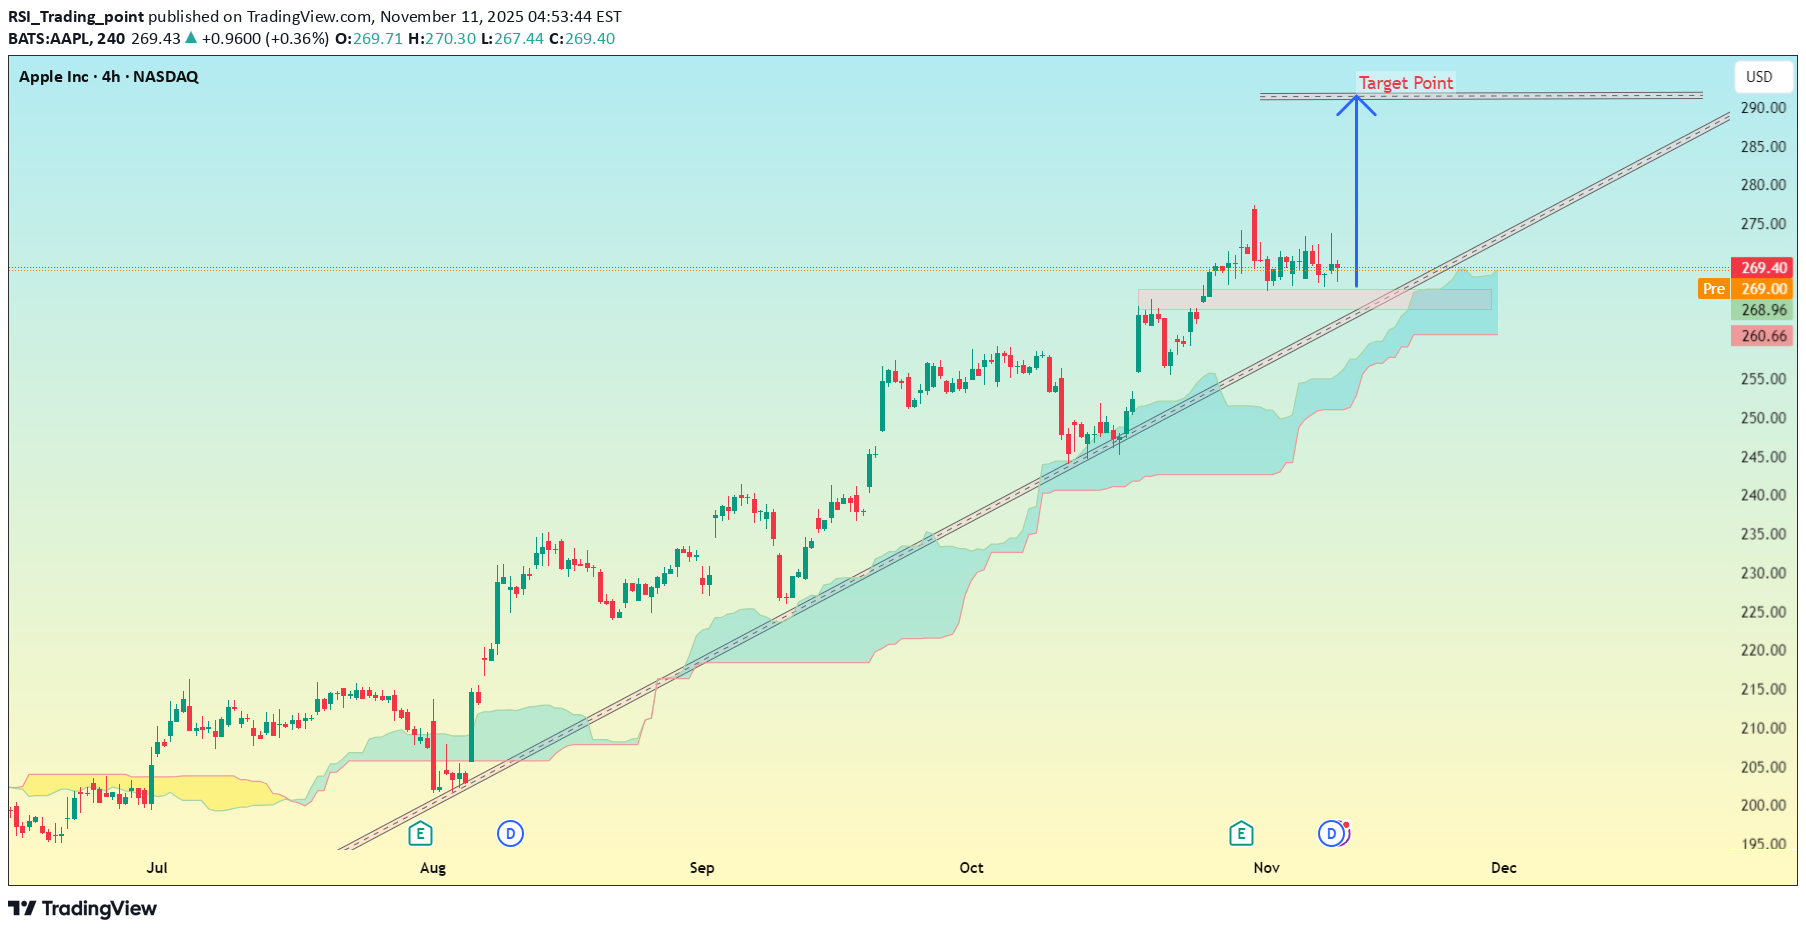
Apple Inc. (AAPL) 4H – NASDAQ chart: Here’s a detailed read of the setup my drawn 👇 --- 🧭 Chart Overview Current Price: ≈ $269.4 Trend: Strong uptrend (price holding above Ichimoku cloud & rising trendline) Support Zone: Around $265 – $266 (where price retested the trendline + cloud) Resistance/Target Box: Marked on my chart as Target Point near the upper trendline. --- 🎯 Target Analysis My blue arrow points to a resistance zone near the top of the ascending channel. The Target Point zone is around $285 – $288. → That’s roughly +6% to +7% upside from the current level. --- 📈 Summary TypeLevel (USD)Notes Entry (current)269–270Price retesting support/trendline Target285 – 288Channel top / bullish target Stop-loss (recommended)260 – 261Below trendline & Ichimoku cloud --- ⚠ Notes If AAPL closes below $260, this trendline support breaks, and momentum may shift bearish. But as long as it stays above $265, it looks strong toward $285+. Watch volume — a breakout above $275 with volume would confirm move to target.active
RSI_Trading_point
تحلیل فوری سولانا (SOL/USDT): دو هدف قیمتی مهم در تایم فریم یک ساعته!
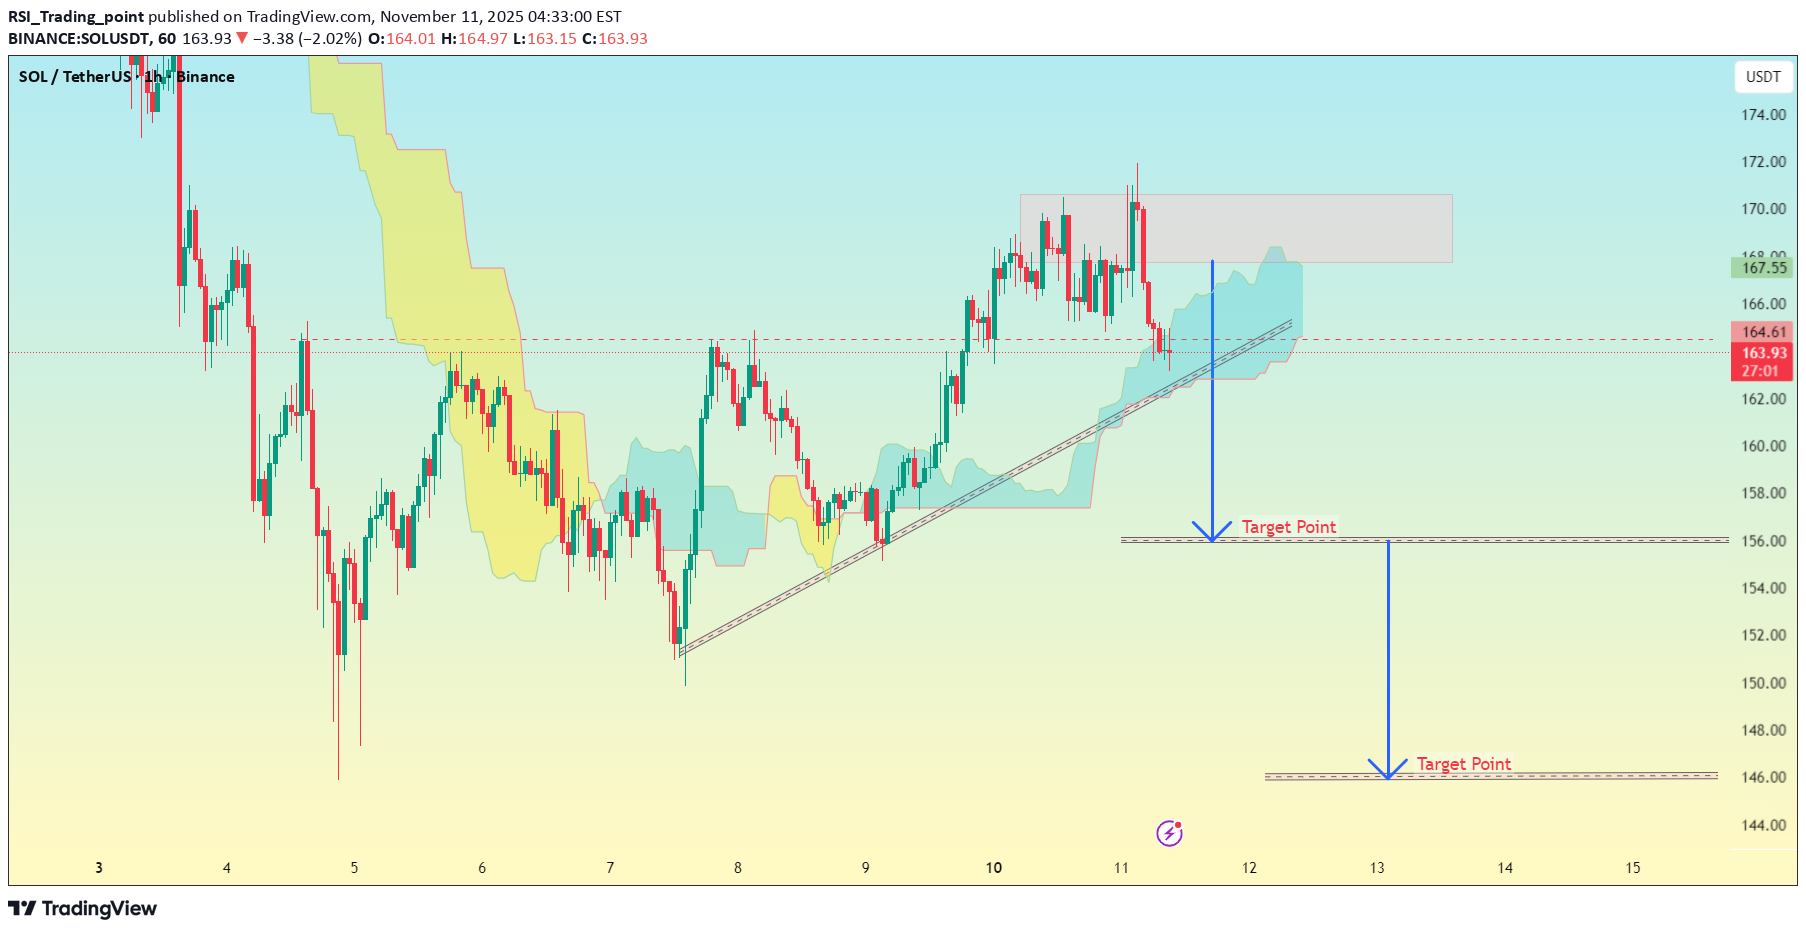
(SOL/USDT 1H timeframe on Binance): Here’s what I can interpret from the structure shown: Current Price: Around $164 Support Trendline: Rising from around $158 → $164 (now price has slightly broken or retested this line) Resistance Zone: Highlighted in red box near $169–$172 Two Target Points are drawn on the chart: 🎯 Target 1: The first blue arrow (labeled Target Point) points to around $156. → This is likely the first downside target after trendline break. 🎯 Target 2: The second blue arrow (lower one) points to around $146–$147. → This is my extended or final bearish target if the price continues falling. --- 🔍 Summary: LevelTypeTarget Zone Target 1Short-term$156 Target 2Major target$146–$147 --- ⚠ Tip: If SOL closes below $162 on 1H or 4H candle → high chance to move toward $156. If it loses $156 support, then $146 becomes realistic. But if SOL reclaims and closes above $168–$170, the bearish setup fails and bullish continuation toward $174+ can begin.trade active
RSI_Trading_point
پیشبینی صعودی اتریوم (ETH/USD): رسیدن به هدف ۳۷۲۰ دلار ممکن است؟
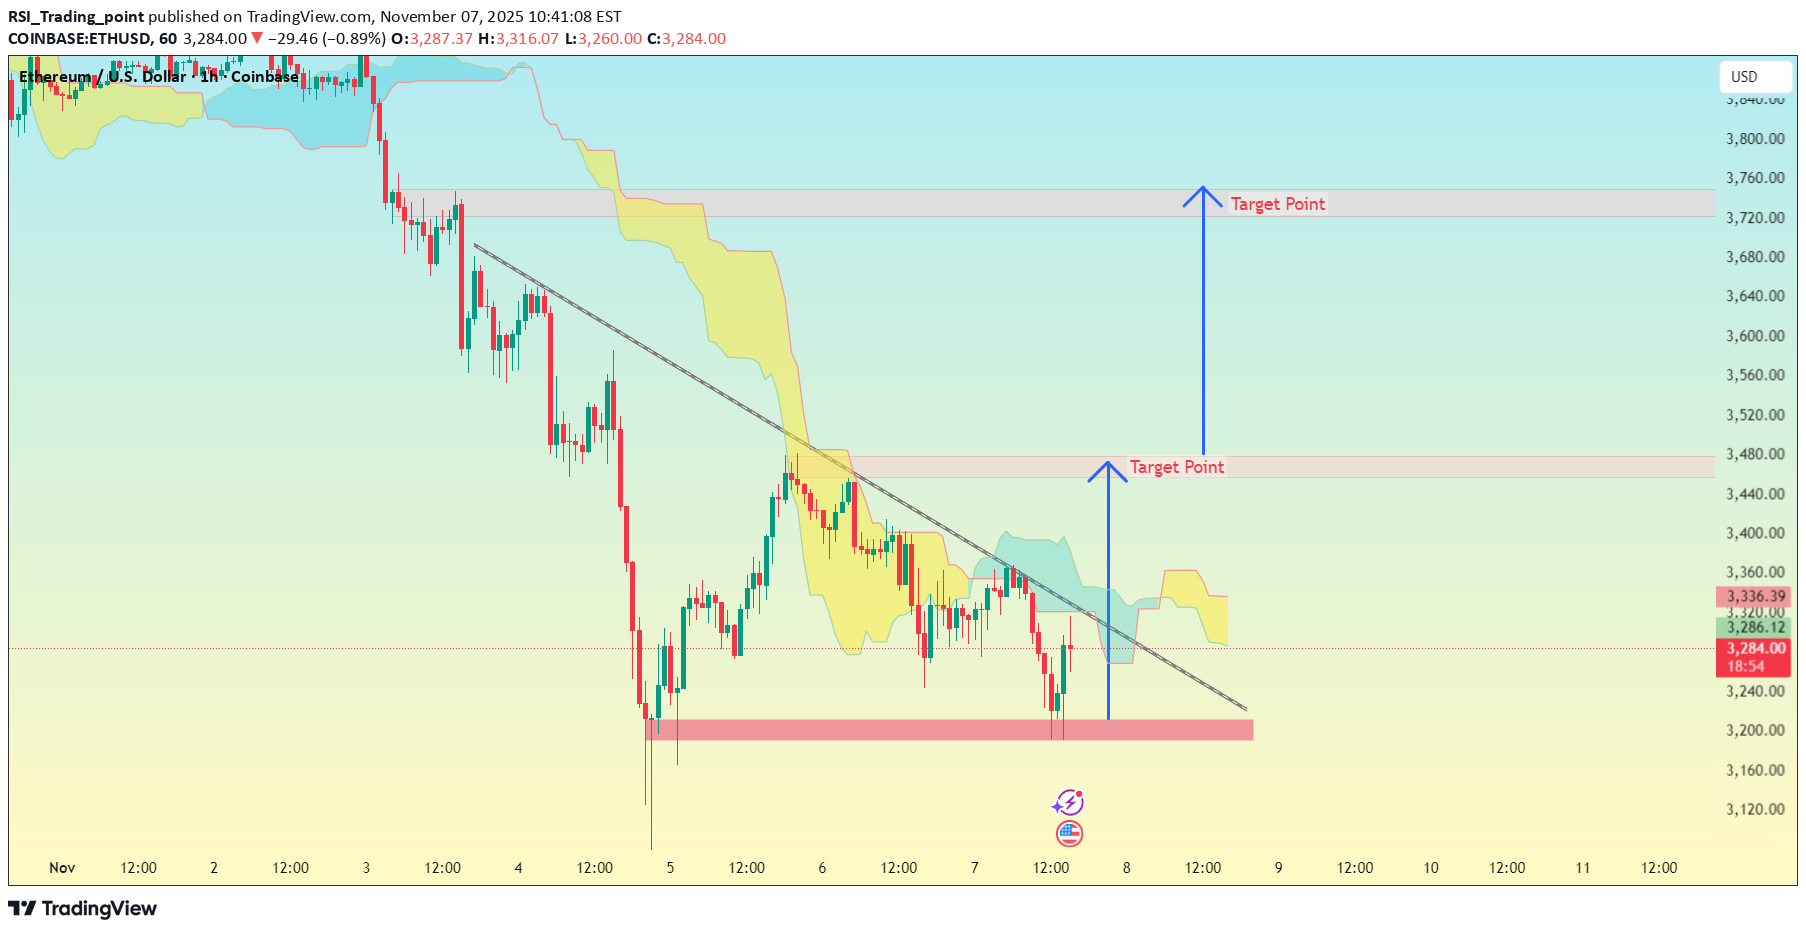
ETH/USD (Ethereum vs U.S. Dollar) on what seems to be the 2-hour timeframe. Here’s what’s visible: The chart shows a descending trendline (downtrend) and a horizontal support zone around the $3,200 area. My marked two “Target Points” above, suggesting a bullish reversal setup from that support. 🎯 Target Levels (approximate based on chart scale) 1. First Target Point: around $3,450 – $3,480 → This aligns with the first resistance zone and the projected move from the descending breakout. 2. Second Target Point: around $3,720 – $3,750 → This represents the measured move from the pattern height projected upward — the next major resistance. --- ⚙ Summary Current Price: ≈ $3,283 Support Zone: ≈ $3,200 1st Target: $3,450 2nd Target: $3,720 Bias: Bullish breakout expected if ETH/USD breaks above the descending trendline and confirms above the Ichimoku cloud.active
RSI_Trading_point
تحلیل تکنیکال طلا (XAU/USD): شکست خط روند و هدف هیجانانگیز 4175 دلار!
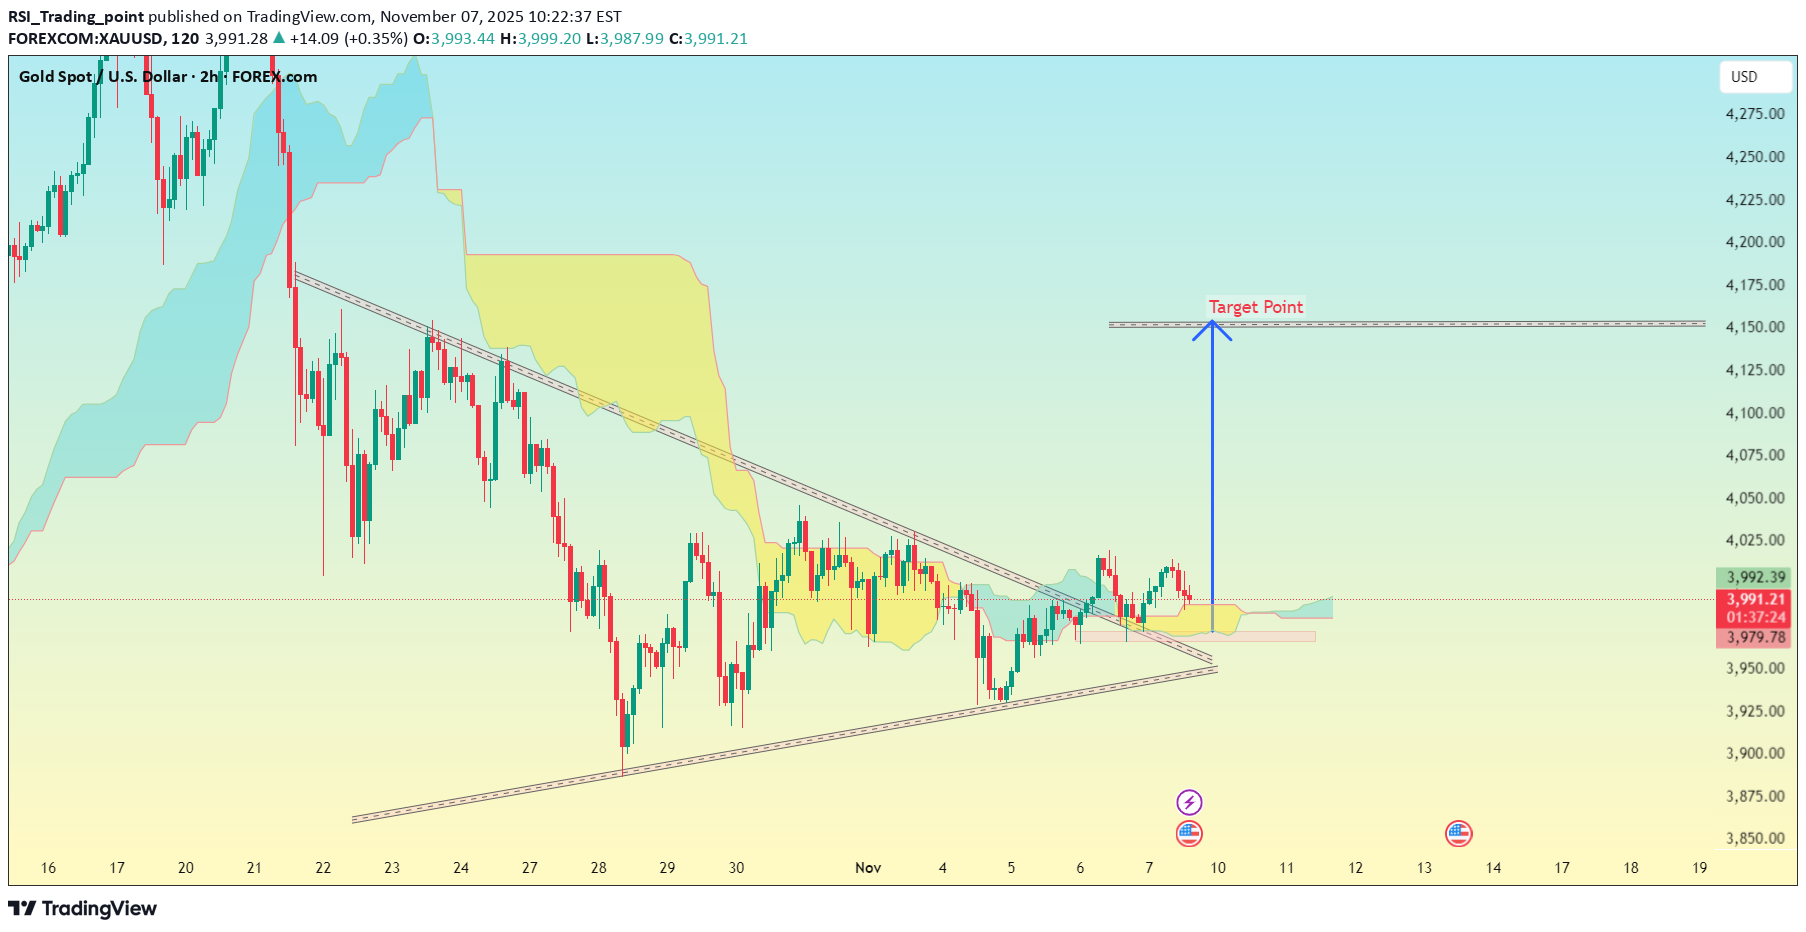
XAU/USD (Gold Spot vs. USD) on the 2-hour timeframe. From what’s visible: My drawn a descending trendline that has been broken upward, suggesting a potential bullish breakout. There’s also a triangle pattern (descending wedge) visible. My chart already labels a “Target Point” marked around the $4,175 level (based on the y-axis on the right). 🎯 Approximate Target: $4,175 – $4,180 USD per ounce This target seems derived from the height of the wedge projected from the breakout point, which is a common method in technical analysis. ⚙ Quick reasoning: Breakout confirmation: Price has broken above the trendline and the Ichimoku cloud. Retest area: Around $3,980 – $4,000, which might act as support if price pulls back. Upside target projection: Matches the wedge height projected upwards → ≈ $4,175.active
RSI_Trading_point
سقوط قریبالوقوع سولانا (SOL): تحلیل تکنیکال شکست مثلث نزولی و هدف ۱۲۷ دلاری!
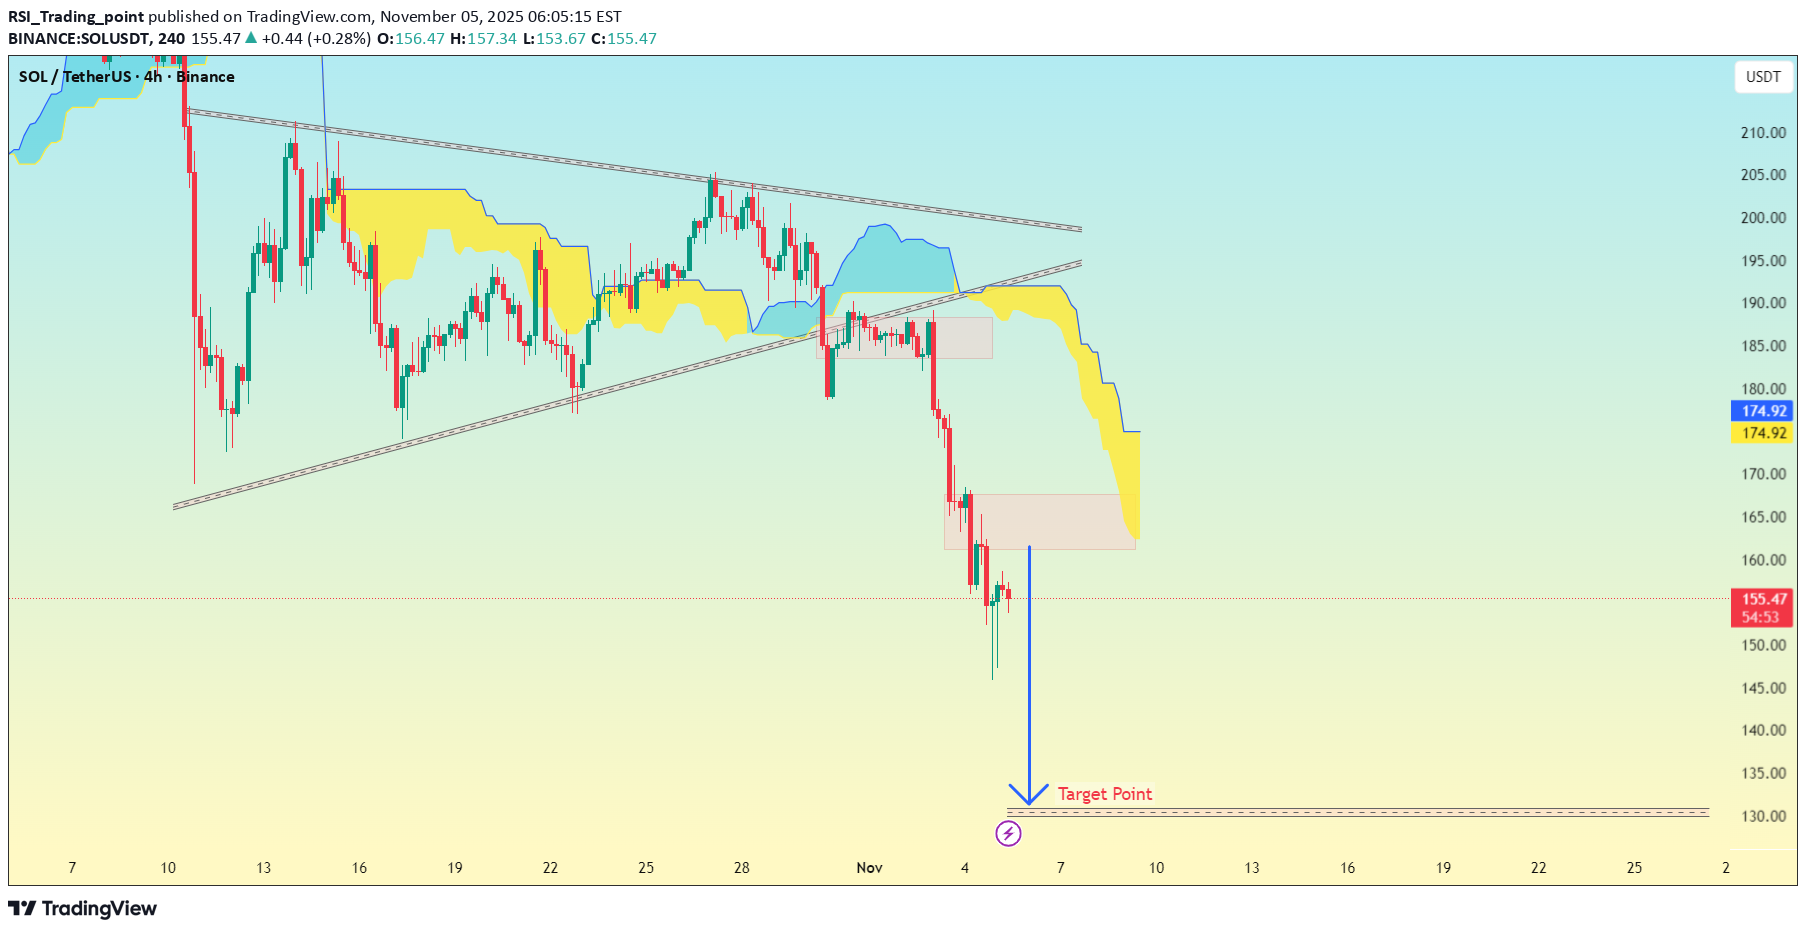
SOL/USDT (Solana vs Tether) Timeframe: 4-hour chart Exchange: Binance Analysis tool: Ichimoku Cloud + trendlines Pattern: my drawn a descending triangle or bearish pennant that recently broke downwards. Current Price: Around $153.67 Target Point (marked): Around $135 – $137 zone 🎯 Target Zone From my chart, the “Target Point” label is placed approximately at: > $135 USDT This aligns with a measured move projection from the height of the triangle (around $200 down to ~$160), giving a target near $135 — a typical price objective for a bearish breakout. 🧠 Quick Breakdown: Price broke below support near $160. The Ichimoku Cloud turned bearish (price below cloud, red span ahead). Momentum and volume confirm downside continuation. Target completion likely around $135 – $137, unless support appears earlier.active
RSI_Trading_point
پیشبینی انفجاری اتریوم (ETH): هدفهای جدید در برابر دلار آمریکا (تحلیل تکنیکال 4 ساعته)
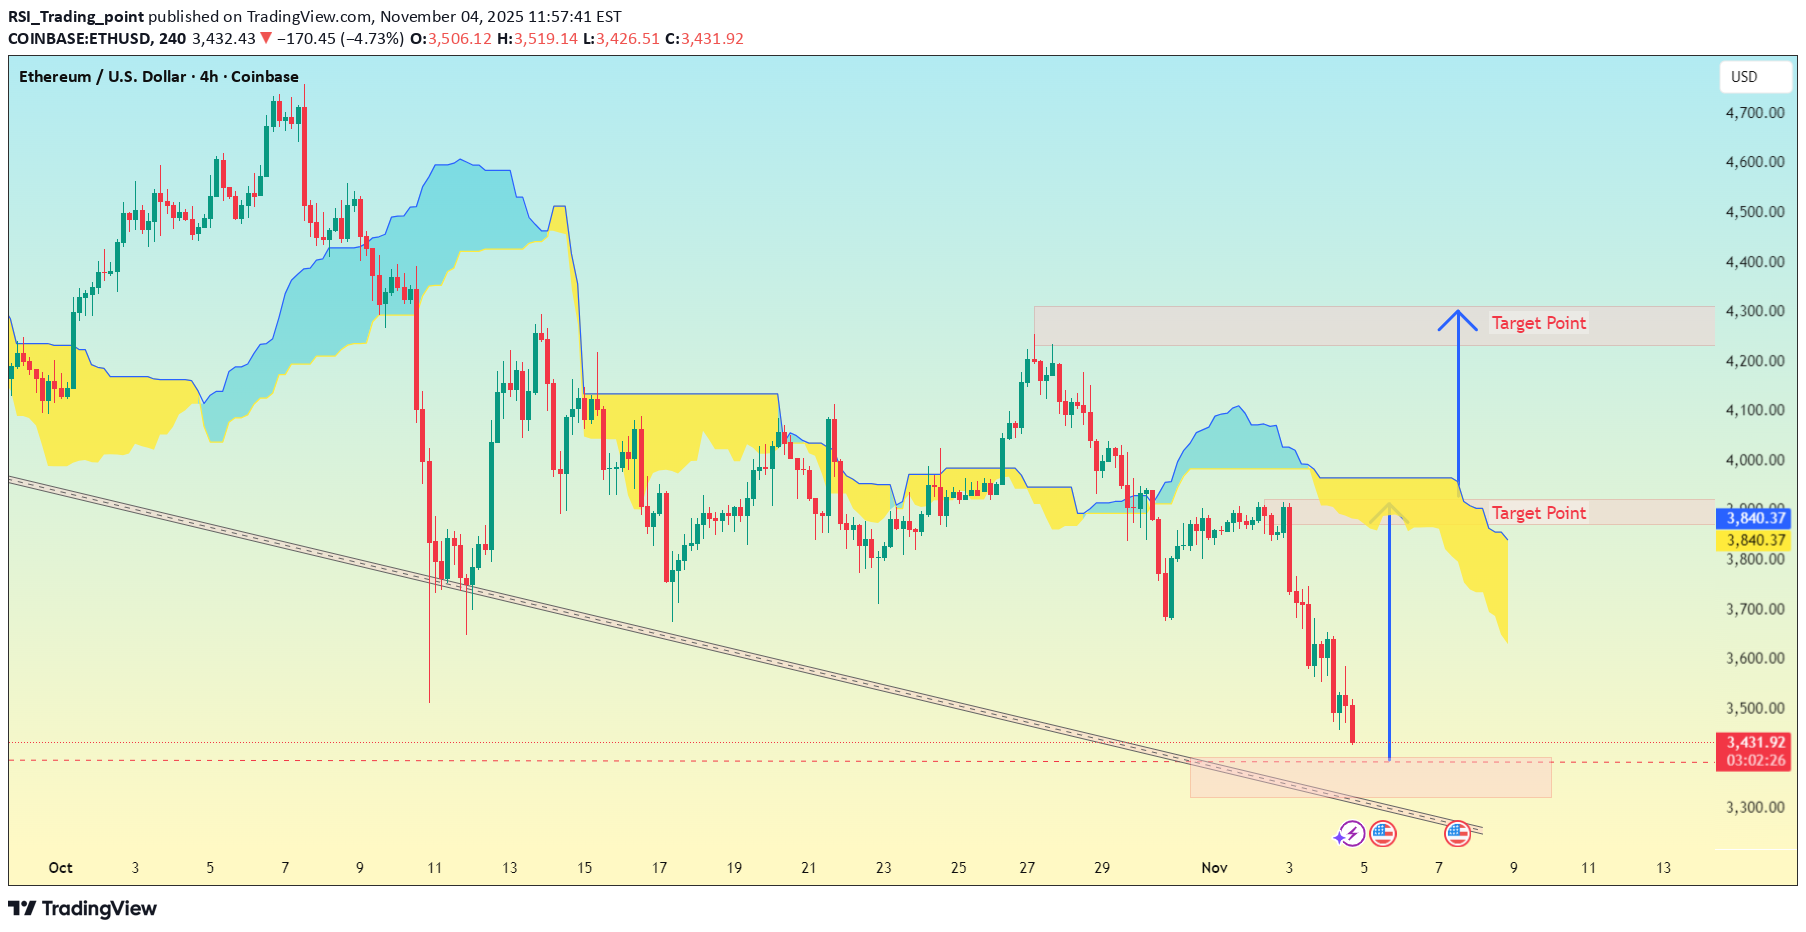
ETH/USD (Ethereum vs US Dollar) on the 4-hour timeframe, here's the analysis and target breakdown based on my setup: --- 🔍 Chart Observation Price is currently around $3,427. The market is in a downtrend, but it looks like it has reached a support zone (highlighted in pink at the bottom). My drawn an Ichimoku cloud, showing resistance above and potential reversal area below. A bullish rebound is expected from the support area, targeting the next resistance zones. --- 🎯 Target Points 1. First Target (Short-term) → $3,840 – $3,860 This aligns with the bottom edge of the Ichimoku cloud and your first “Target Point” label. A possible resistance area if ETH starts to rebound. 2. Second Target (Mid-term) → $4,250 – $4,300 This is the upper “Target Point” zone you marked. It’s near the top of the previous consolidation area, and a strong resistance if ETH continues bullish. --- 🧭 Trading Plan Summary Buy Zone (Support): $3,350 – $3,420 Target 1: $3,840 – $3,860 Target 2: $4,250 – $4,300 Stop Loss: Below $3,300 (to protect from deeper downside) --- ⚠ Note If price breaks below $3,300, bearish momentum could continue toward $3,150 – $3,200. If it holds above $3,400 and breaks through $3,600, that confirms bullish reversal strength. ---
RSI_Trading_point
تحلیل بیت کوین: هشدار جدی و هدفهای نزولی جدید (زیر ۱۰۷ هزار دلار)
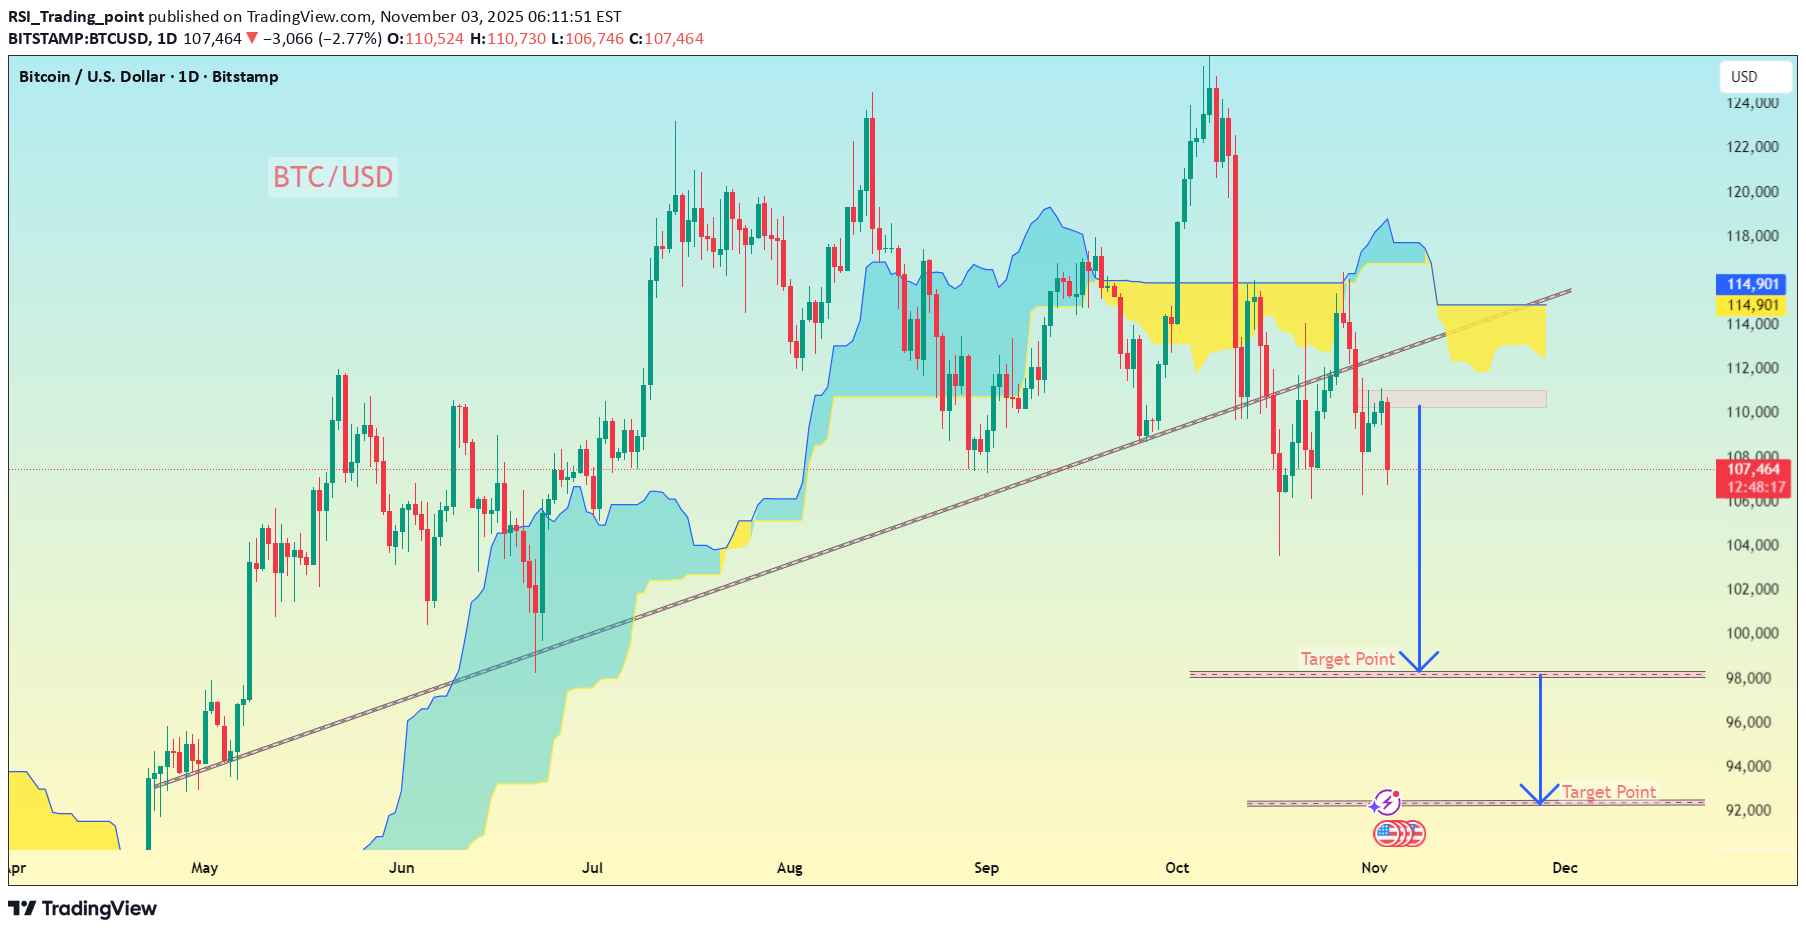
BTC/USD (Bitcoin vs USD) chart 👇 🧭 Timeframe: I'm using the 1-Day (D1) chart — so this is a medium-term setup, not intraday. --- 📊 Technical Overview: Price is currently around $107,400. A major ascending trendline (support) has been broken downward — bearish signal. Ichimoku Cloud shows resistance above price, confirming bearish pressure. I have blue arrows and “Target Point” levels marked below current price — indicating a downside projection. --- 🎯 Target Zones (as shown in my chart): 1. First Target Point: around $100,000 – $101,000 → This is my initial bearish target after the trendline break. 2. Second Target Point: around $94,000 – $95,000 → This is my extended target zone if the bearish trend continues. --- ⚠ Key Levels: TypeLevel (USD)Comment Resistance114,000 – 115,000Strong rejection area inside cloud Break Zone / EntryBelow 107,000Confirms bearish continuation Target 1100,000 – 101,000First take-profit zone Target 294,000 – 95,000Final target zone Stop-Loss115,000 – 116,000Above Ichimoku cloud --- 📉 Summary: Trend: Bearish Entry Idea: Sell below $107,000 daily close TP1: $100,000 TP2: $94,000 SL: $115,000trade active
RSI_Trading_point
تحلیل طلا (XAU/USD): پیشبینی ریزش قوی با الگوی مثلث نزولی!
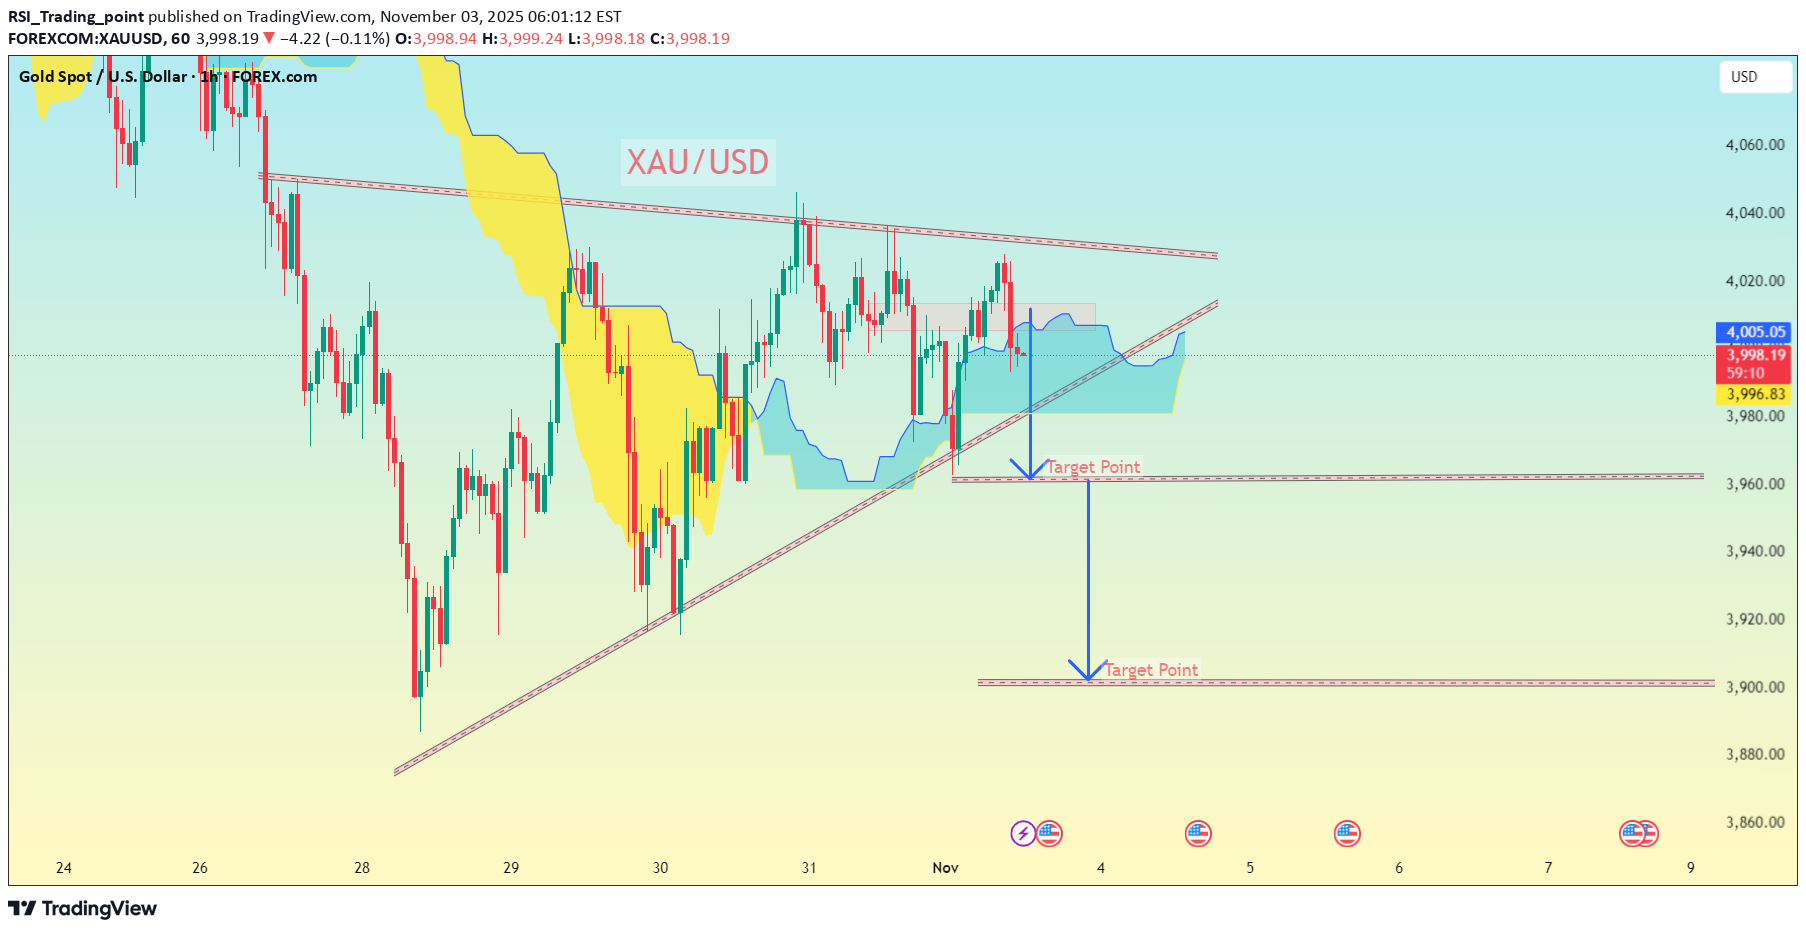
XAU/USD (Gold) chart carefully 👇 🧭 Timeframe: Im using 1-hour (1H) chart. 📊 Current Setup: I have a descending triangle or symmetrical triangle pattern forming. Price is around $4,000–$4,005. The support trendline (bottom) has been tested multiple times, showing potential weakness. Ichimoku Cloud is flat and price is below the mid-zone — a slightly bearish bias. 📉 Breakout Direction: The chart shows blue arrows pointing downward, meaning a bearish breakout is expected. 🎯 Target Levels (based on my chart’s marking): 1. First Target Point: around $3,975 – $3,980 (Short-term target after triangle breakdown.) 2. Second Target Point: around $3,920 – $3,925 (Extended bearish target if momentum continues.) ⚠ Key Levels to Watch: Resistance: $4,020 – $4,030 Break Zone (confirmation of sell): below $3,995 candle close (1H). Support/Buy Zone: $3,920 – $3,925 --- Summary: ActionTargetComment Sell below $3,995🎯 $3,975First take-profit Hold/sell continuation🎯 $3,920Final target zone Stop loss🔺 $4,030Above upper trendlinetrade active
Disclaimer
Any content and materials included in Sahmeto's website and official communication channels are a compilation of personal opinions and analyses and are not binding. They do not constitute any recommendation for buying, selling, entering or exiting the stock market and cryptocurrency market. Also, all news and analyses included in the website and channels are merely republished information from official and unofficial domestic and foreign sources, and it is obvious that users of the said content are responsible for following up and ensuring the authenticity and accuracy of the materials. Therefore, while disclaiming responsibility, it is declared that the responsibility for any decision-making, action, and potential profit and loss in the capital market and cryptocurrency market lies with the trader.