Technical analysis by RSI_Trading_point about Symbol PAXG: Sell recommendation (11/3/2025)

RSI_Trading_point
تحلیل طلا (XAU/USD): پیشبینی ریزش قوی با الگوی مثلث نزولی!
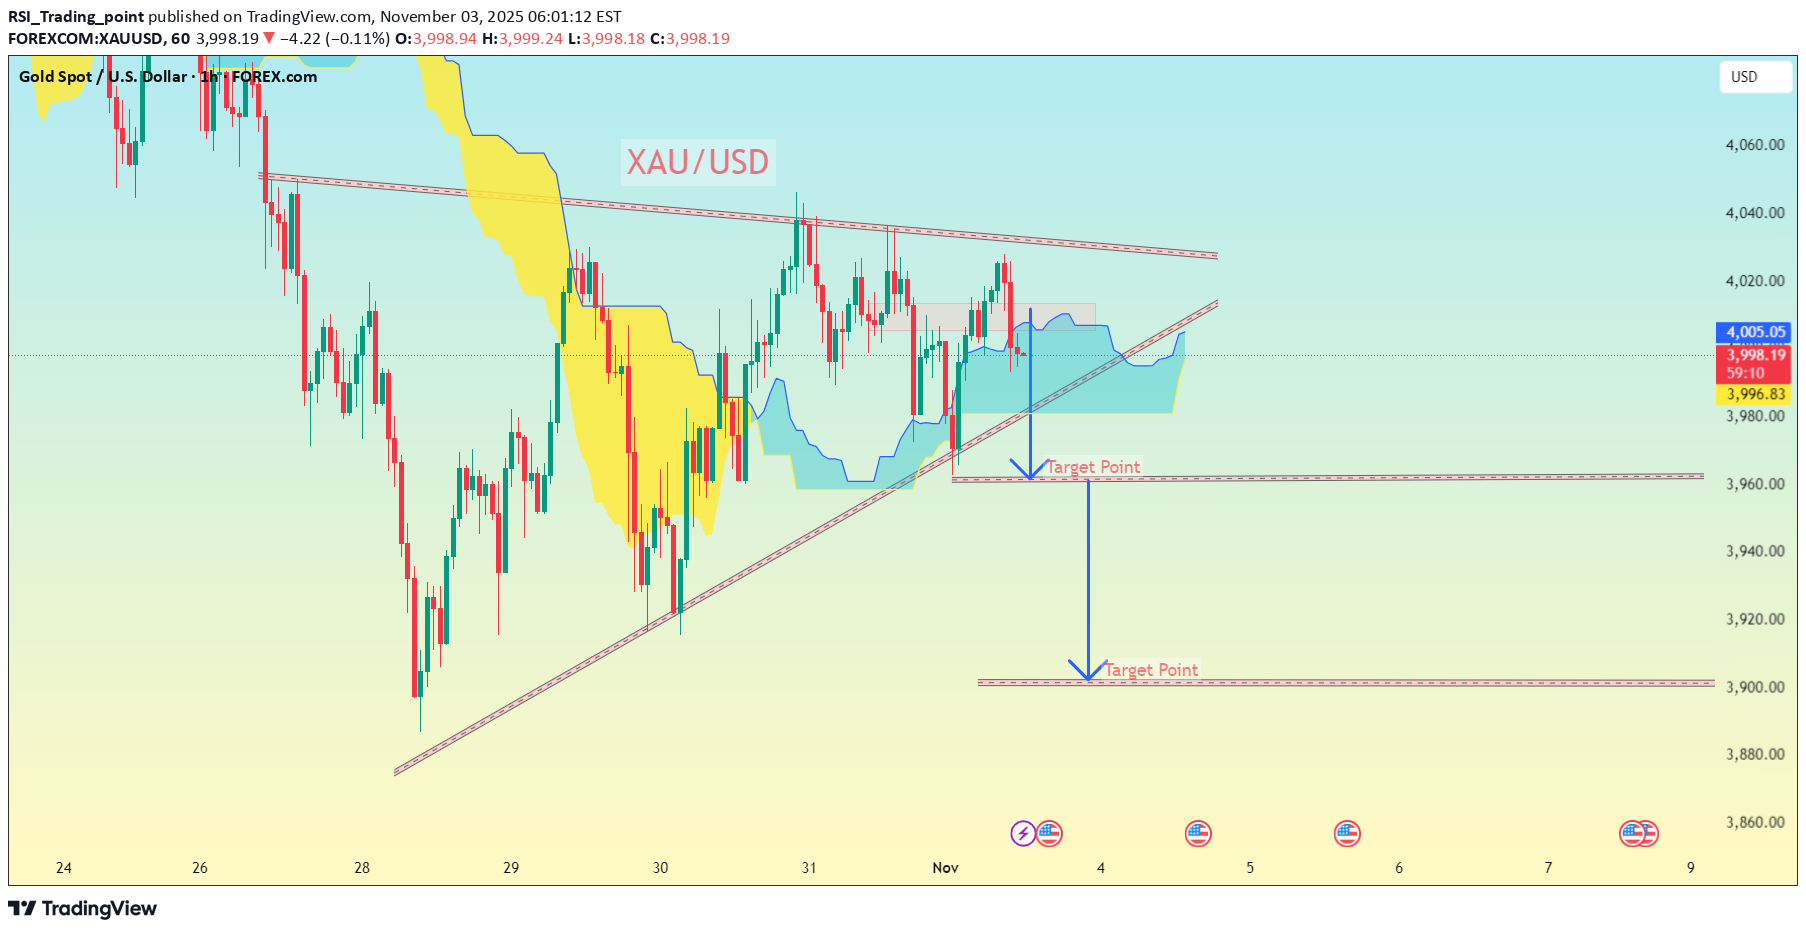
XAU/USD (Gold) chart carefully 👇 🧭 Timeframe: Im using 1-hour (1H) chart. 📊 Current Setup: I have a descending triangle or symmetrical triangle pattern forming. Price is around $4,000–$4,005. The support trendline (bottom) has been tested multiple times, showing potential weakness. Ichimoku Cloud is flat and price is below the mid-zone — a slightly bearish bias. 📉 Breakout Direction: The chart shows blue arrows pointing downward, meaning a bearish breakout is expected. 🎯 Target Levels (based on my chart’s marking): 1. First Target Point: around $3,975 – $3,980 (Short-term target after triangle breakdown.) 2. Second Target Point: around $3,920 – $3,925 (Extended bearish target if momentum continues.) ⚠ Key Levels to Watch: Resistance: $4,020 – $4,030 Break Zone (confirmation of sell): below $3,995 candle close (1H). Support/Buy Zone: $3,920 – $3,925 --- Summary: ActionTargetComment Sell below $3,995🎯 $3,975First take-profit Hold/sell continuation🎯 $3,920Final target zone Stop loss🔺 $4,030Above upper trendlinetrade active