Technical analysis by RSI_Trading_point about Symbol ETH: Sell recommendation (11/13/2025)

RSI_Trading_point
تحلیل فوری اتریوم: خطر سقوط به ۳۰۰۰ دلار پس از تست خط روند صعودی!
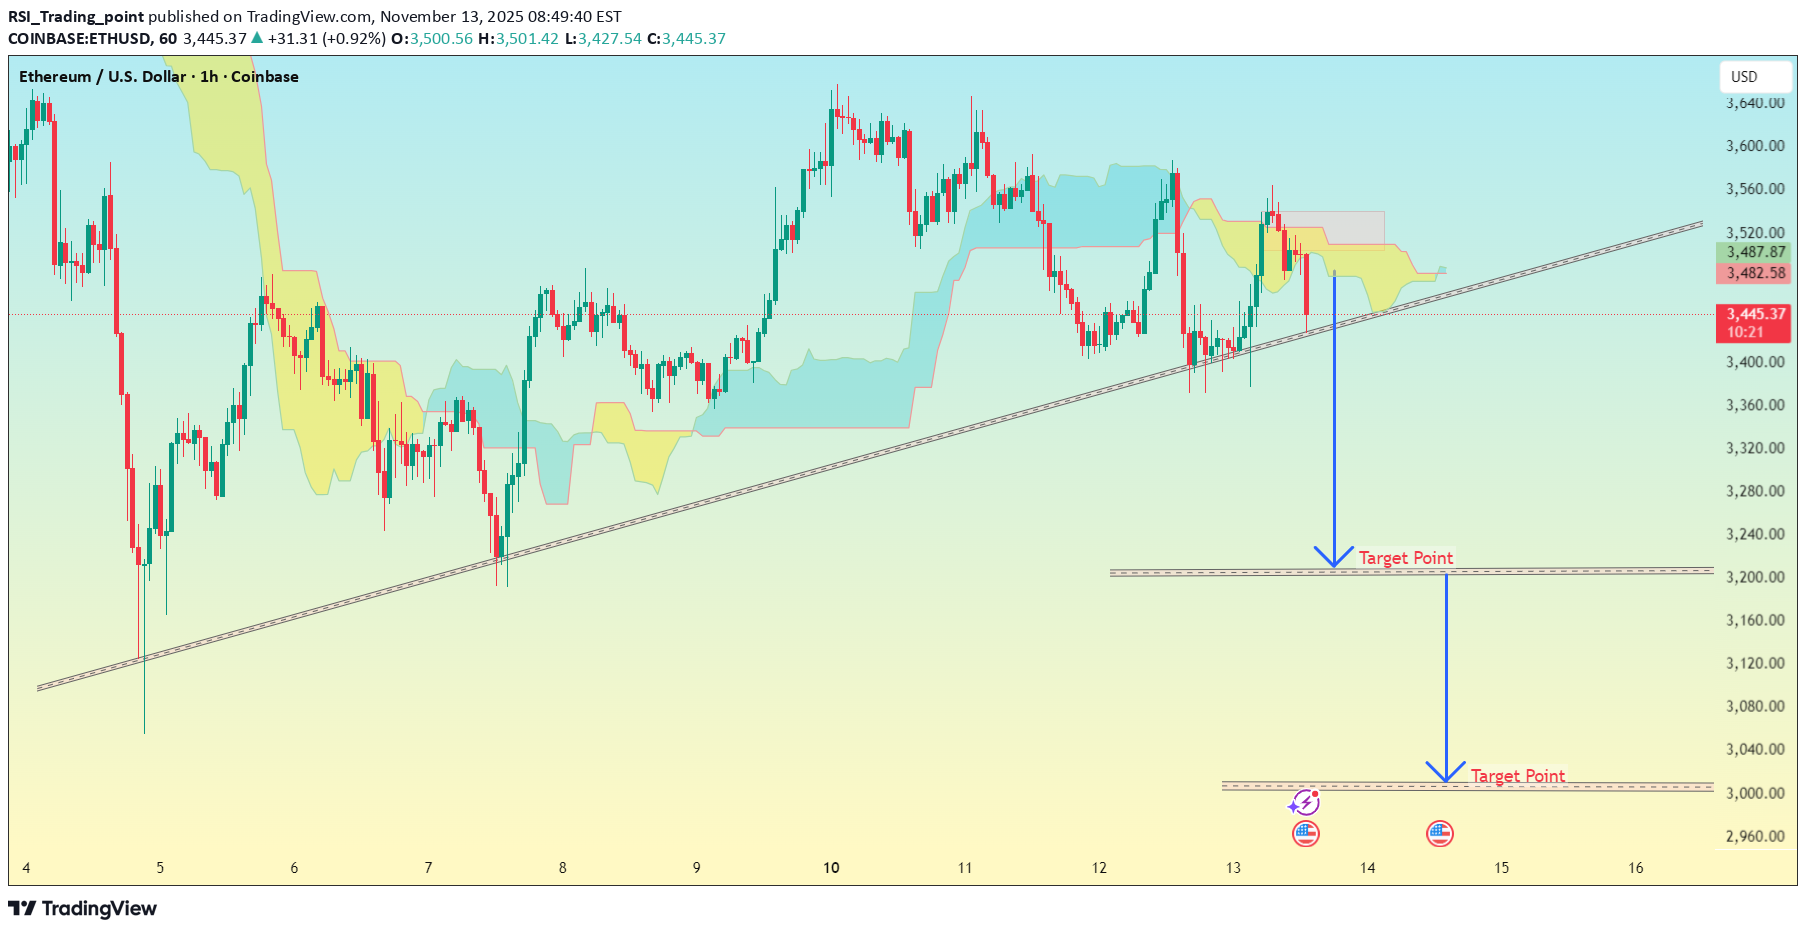
ETH/USD (1H timeframe) on Coinbase, and it’s clearly showing a raisin trendline test with two downside “Target Points” already drawn. Let’s break it down: --- 🔍 Chart Analysis Price is $3,441, sitting right on the ascending trendline. Ichimoku Cloud is turning bearish (price below the cloud). Trendline break looks likely — momentum is weak and candles are closing below the cloud. Two target zones (downside) are marked on my chart. --- 📉 Bearish Breakdown Scenario If ETH breaks and closes below the ascending trendline (~$3,440 area): First Target (TP1): around $3,230 – $3,250 → This aligns with previous horizontal support and midpoint of the last bounce. Second Target (TP2): around $3,000 – $3,050 → This is my deeper support zone — the next strong demand level on the chart. --- ⚠ Invalidation / Stop-Loss If ETH closes back above $3,520 – $3,540, that would invalidate the bearish move (trendline reclaim + cloud flip). --- 🧭 Trade Summary Entry (Breakdown): Below 3,440 TP1: 3,240 TP2: 3,020 SL: 3,540trade active