Technical analysis by RSI_Trading_point about Symbol BTC: Buy recommendation (11/13/2025)

RSI_Trading_point
تحلیل تکنیکال بیت کوین (4 ساعته): سیگنال صعودی قوی با اهداف 118,000 دلار!
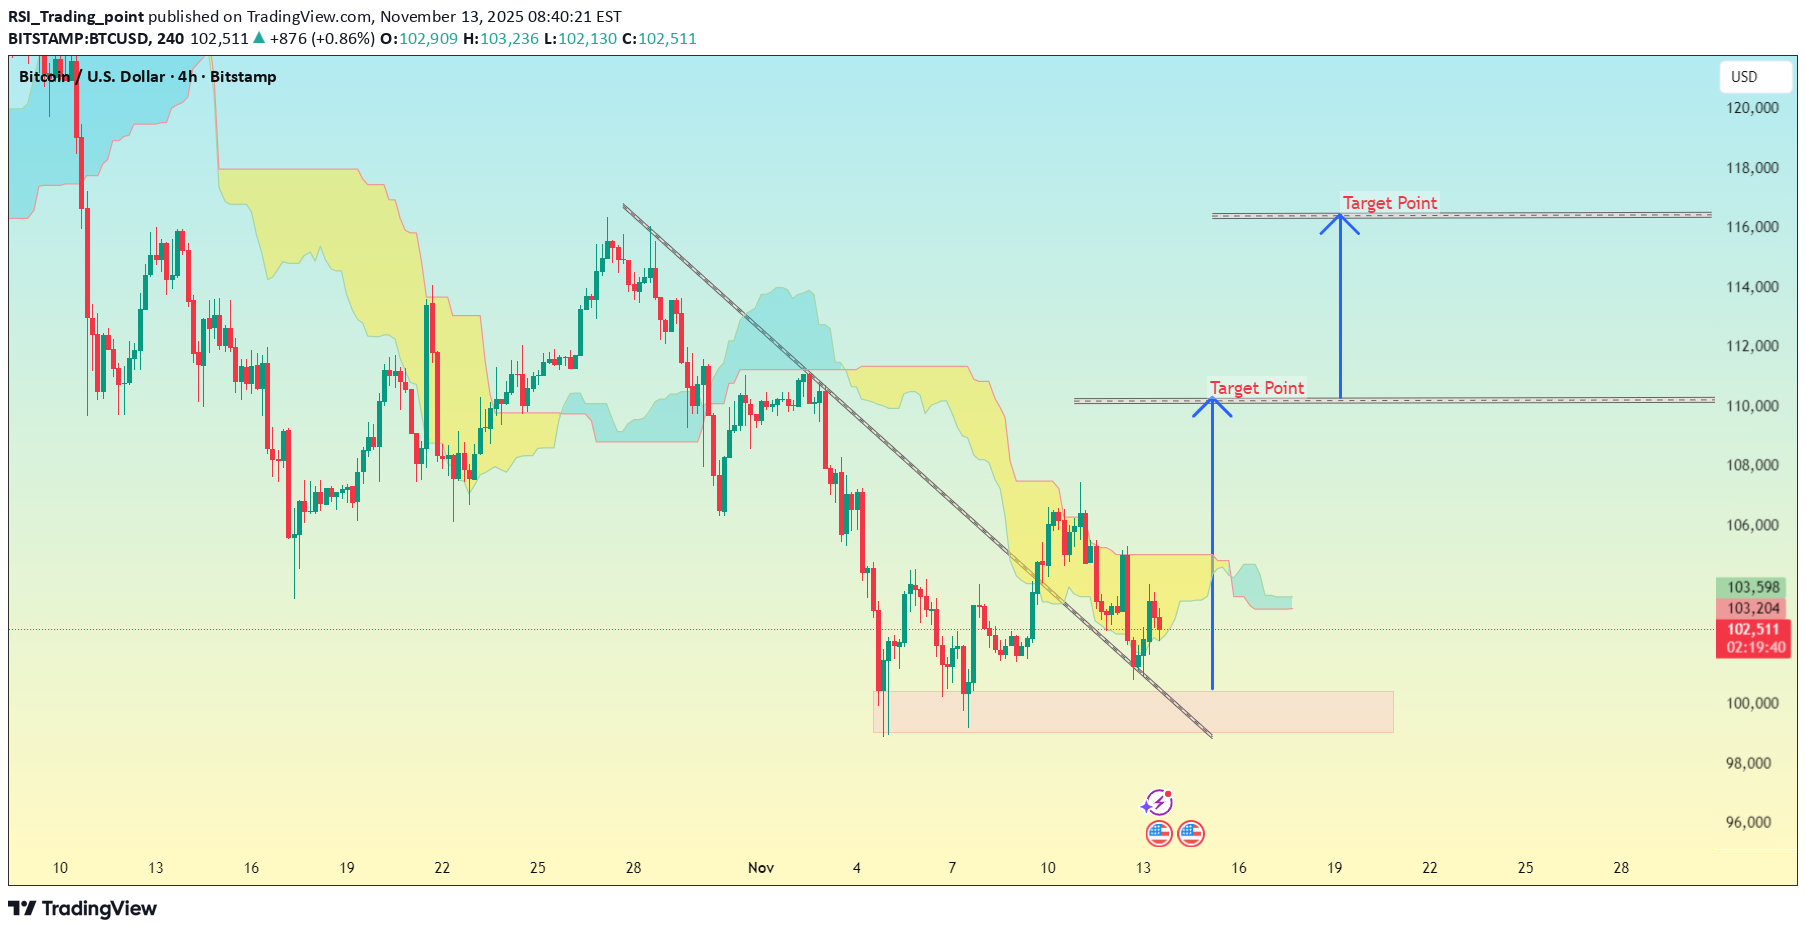
BTC/USD (4H timeframe) on Bitstamp, and the chart shows: A downtrend breakout from a descending trendline. Ichimoku Cloud turning bullish (price breaking into or above the cloud). A support zone around $100,000 – $101,000. Two target points already drawn on my chart. Based on the structure: 📈 Bullish Scenario If BTC confirms the breakout and stays above the descending trendline and cloud: First Target: around $110,000 – $111,000 Second Target: around $116,000 – $118,000 These match the levels marked on my chart and align with: Cloud breakout projection Prior supply/resistance zones Fibonacci 0.618–1.0 retracement zone (rough estimate) ⚠ Invalidation / Stop-Loss If BTC closes below the grey support box (~$100,000), it would invalidate the bullish setup — likely signaling more downside.active