Technical analysis by RSI_Trading_point about Symbol ETH: Buy recommendation (11/7/2025)

RSI_Trading_point
پیشبینی صعودی اتریوم (ETH/USD): رسیدن به هدف ۳۷۲۰ دلار ممکن است؟
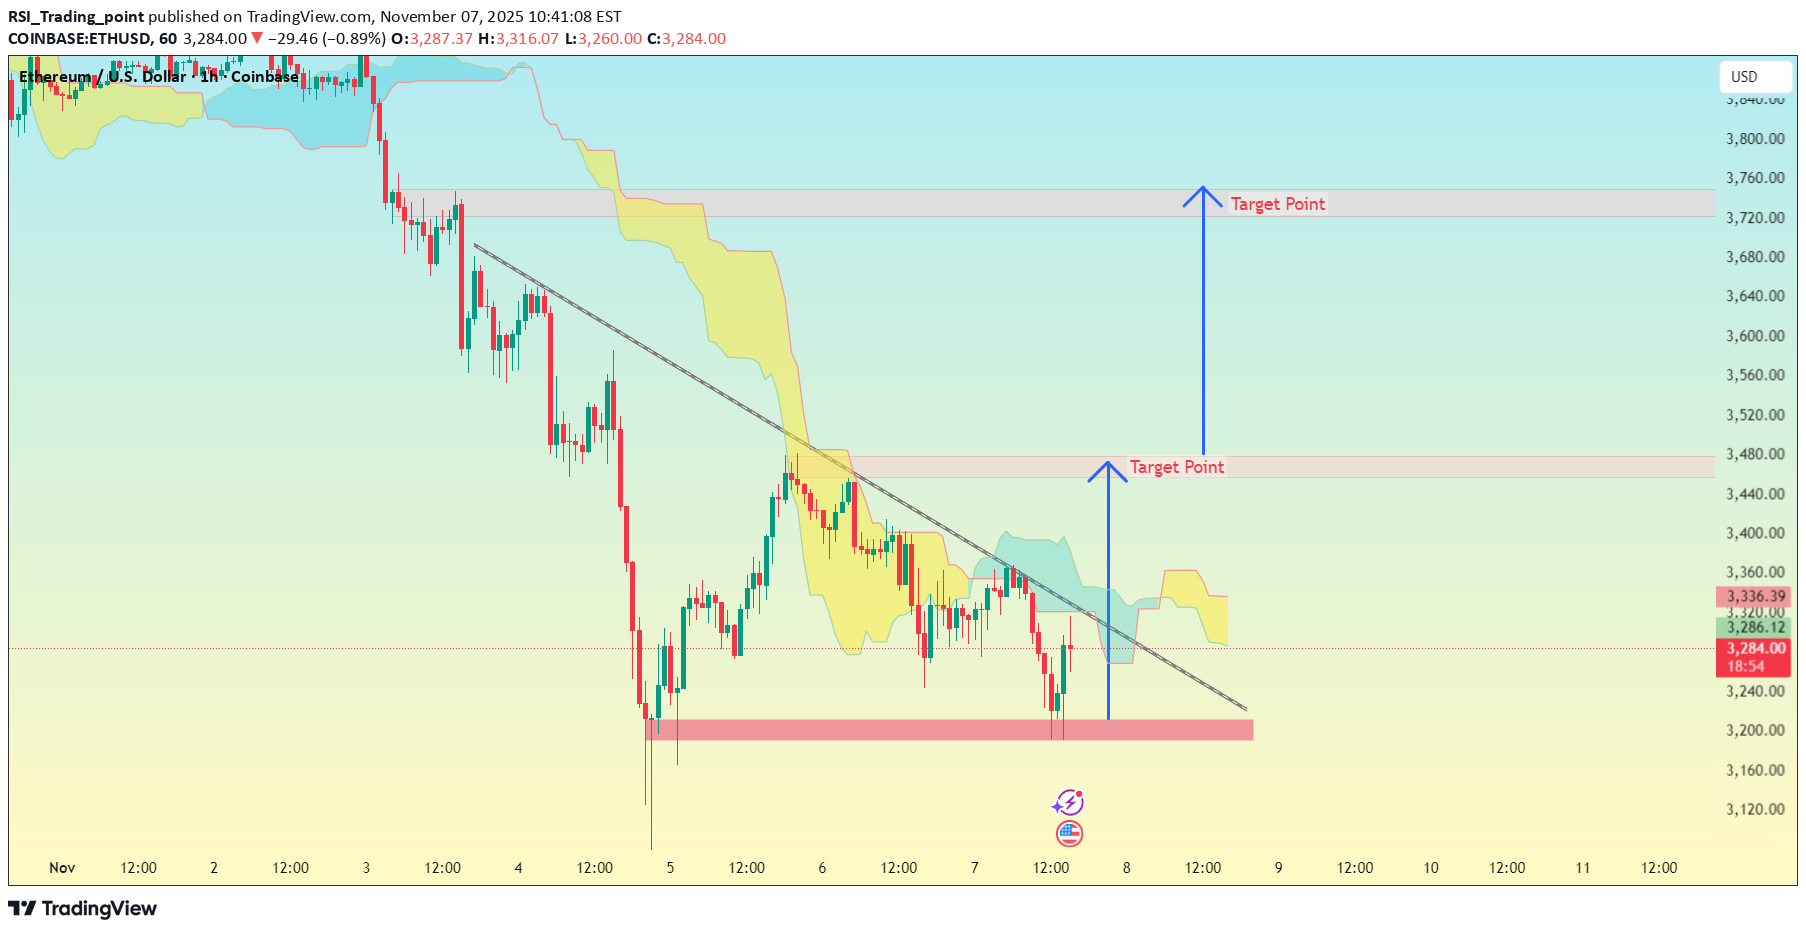
ETH/USD (Ethereum vs U.S. Dollar) on what seems to be the 2-hour timeframe. Here’s what’s visible: The chart shows a descending trendline (downtrend) and a horizontal support zone around the $3,200 area. My marked two “Target Points” above, suggesting a bullish reversal setup from that support. 🎯 Target Levels (approximate based on chart scale) 1. First Target Point: around $3,450 – $3,480 → This aligns with the first resistance zone and the projected move from the descending breakout. 2. Second Target Point: around $3,720 – $3,750 → This represents the measured move from the pattern height projected upward — the next major resistance. --- ⚙ Summary Current Price: ≈ $3,283 Support Zone: ≈ $3,200 1st Target: $3,450 2nd Target: $3,720 Bias: Bullish breakout expected if ETH/USD breaks above the descending trendline and confirms above the Ichimoku cloud.active