Technical analysis by RSI_Trading_point about Symbol ETH: Buy recommendation (11/4/2025)

RSI_Trading_point
پیشبینی انفجاری اتریوم (ETH): هدفهای جدید در برابر دلار آمریکا (تحلیل تکنیکال 4 ساعته)
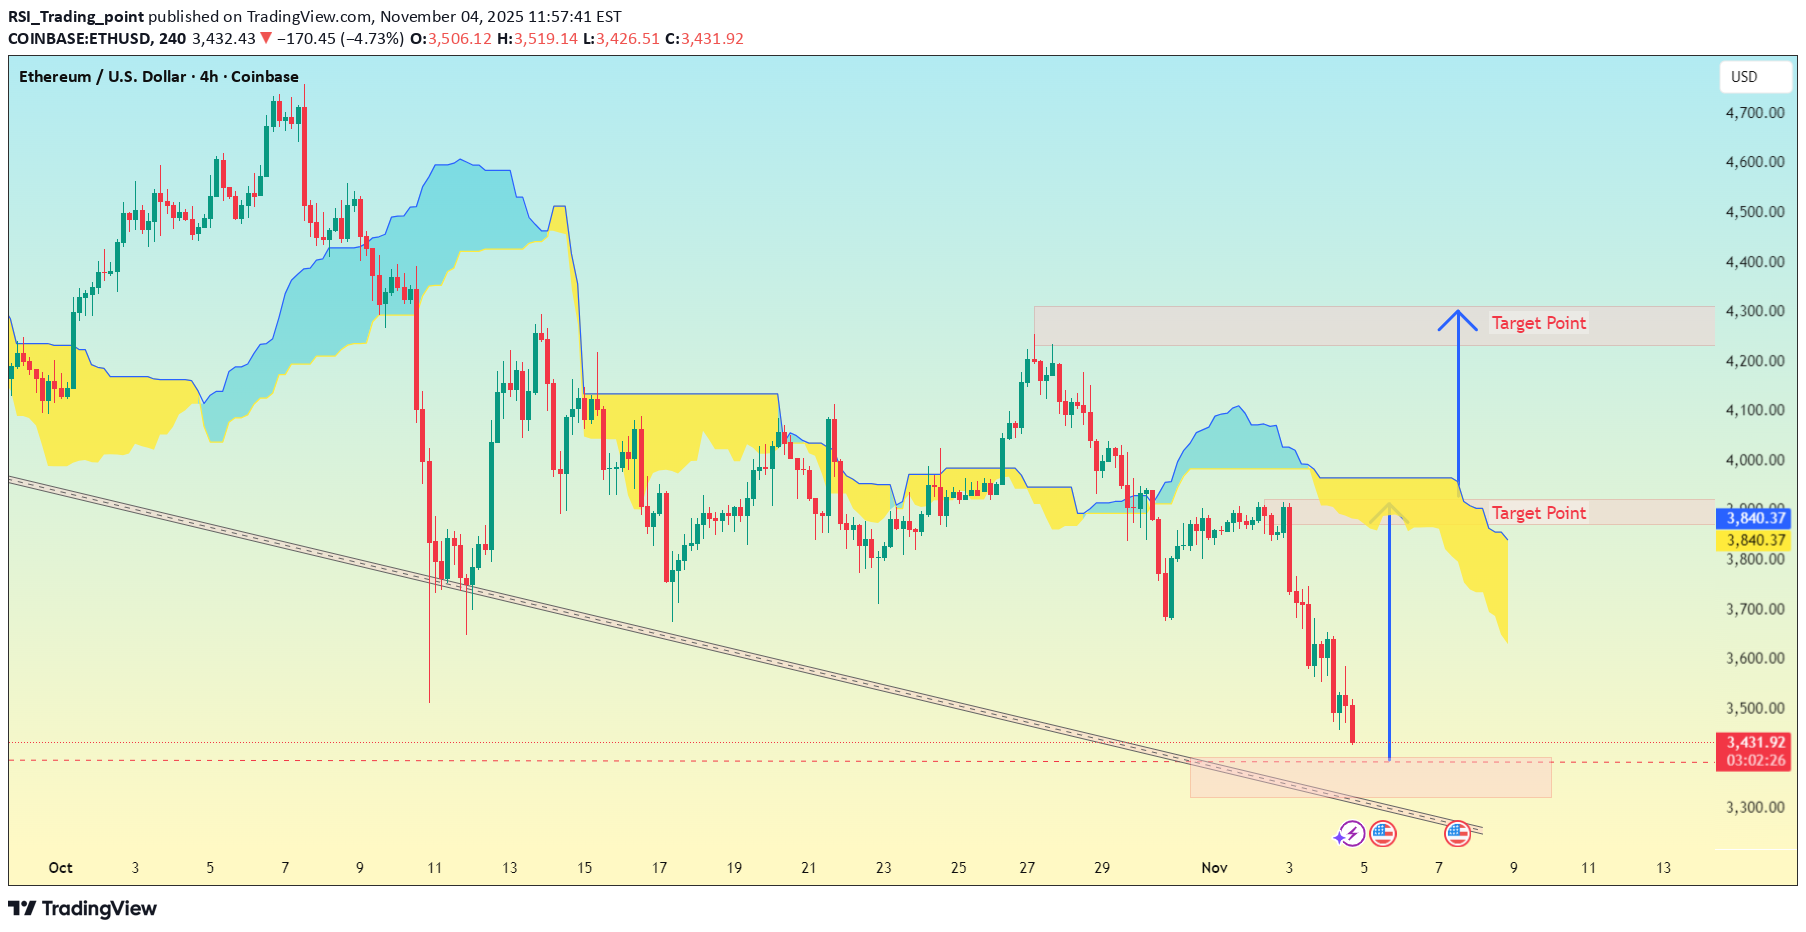
ETH/USD (Ethereum vs US Dollar) on the 4-hour timeframe, here's the analysis and target breakdown based on my setup: --- 🔍 Chart Observation Price is currently around $3,427. The market is in a downtrend, but it looks like it has reached a support zone (highlighted in pink at the bottom). My drawn an Ichimoku cloud, showing resistance above and potential reversal area below. A bullish rebound is expected from the support area, targeting the next resistance zones. --- 🎯 Target Points 1. First Target (Short-term) → $3,840 – $3,860 This aligns with the bottom edge of the Ichimoku cloud and your first “Target Point” label. A possible resistance area if ETH starts to rebound. 2. Second Target (Mid-term) → $4,250 – $4,300 This is the upper “Target Point” zone you marked. It’s near the top of the previous consolidation area, and a strong resistance if ETH continues bullish. --- 🧭 Trading Plan Summary Buy Zone (Support): $3,350 – $3,420 Target 1: $3,840 – $3,860 Target 2: $4,250 – $4,300 Stop Loss: Below $3,300 (to protect from deeper downside) --- ⚠ Note If price breaks below $3,300, bearish momentum could continue toward $3,150 – $3,200. If it holds above $3,400 and breaks through $3,600, that confirms bullish reversal strength. ---