Technical analysis by RSI_Trading_point about Symbol AAPLX: Buy recommendation (11/11/2025)

RSI_Trading_point
تحلیل تکنیکال اپل (AAPL): هدف قیمتی بعدی کجاست؟ (رشد +7% ممکن است؟)
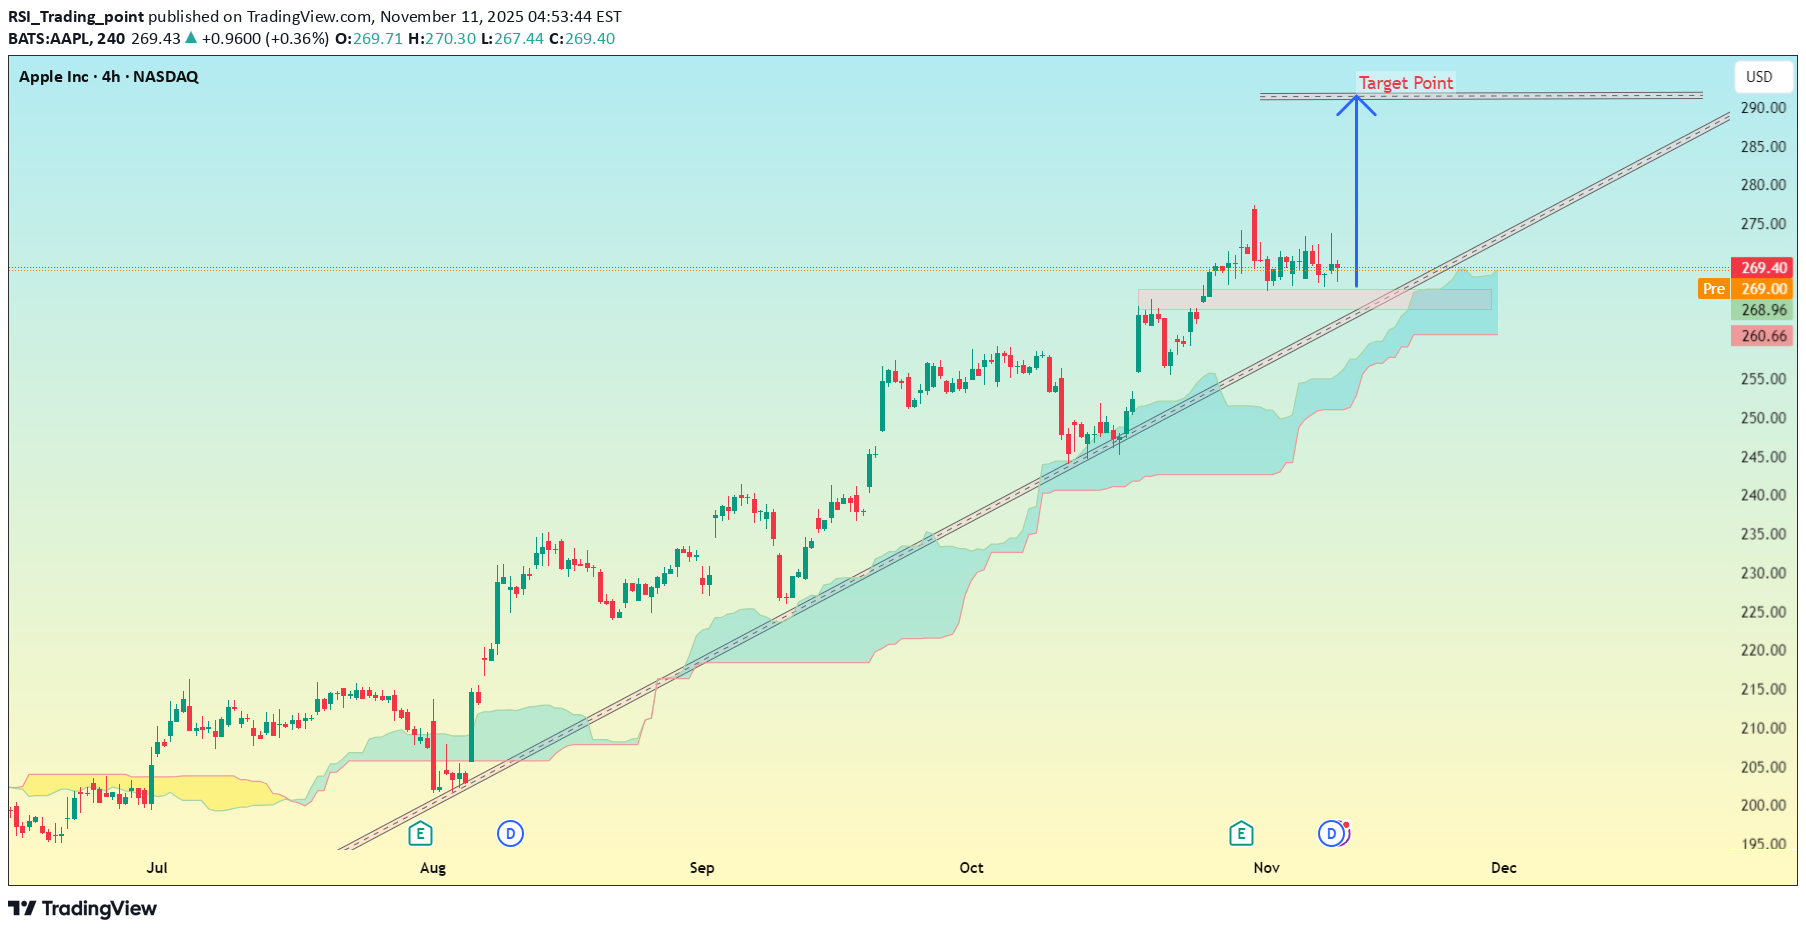
Apple Inc. (AAPL) 4H – NASDAQ chart: Here’s a detailed read of the setup my drawn 👇 --- 🧭 Chart Overview Current Price: ≈ $269.4 Trend: Strong uptrend (price holding above Ichimoku cloud & rising trendline) Support Zone: Around $265 – $266 (where price retested the trendline + cloud) Resistance/Target Box: Marked on my chart as Target Point near the upper trendline. --- 🎯 Target Analysis My blue arrow points to a resistance zone near the top of the ascending channel. The Target Point zone is around $285 – $288. → That’s roughly +6% to +7% upside from the current level. --- 📈 Summary TypeLevel (USD)Notes Entry (current)269–270Price retesting support/trendline Target285 – 288Channel top / bullish target Stop-loss (recommended)260 – 261Below trendline & Ichimoku cloud --- ⚠ Notes If AAPL closes below $260, this trendline support breaks, and momentum may shift bearish. But as long as it stays above $265, it looks strong toward $285+. Watch volume — a breakout above $275 with volume would confirm move to target.active