Technical analysis by RSI_Trading_point about Symbol BTC: Sell recommendation (11/3/2025)

RSI_Trading_point
تحلیل بیت کوین: هشدار جدی و هدفهای نزولی جدید (زیر ۱۰۷ هزار دلار)
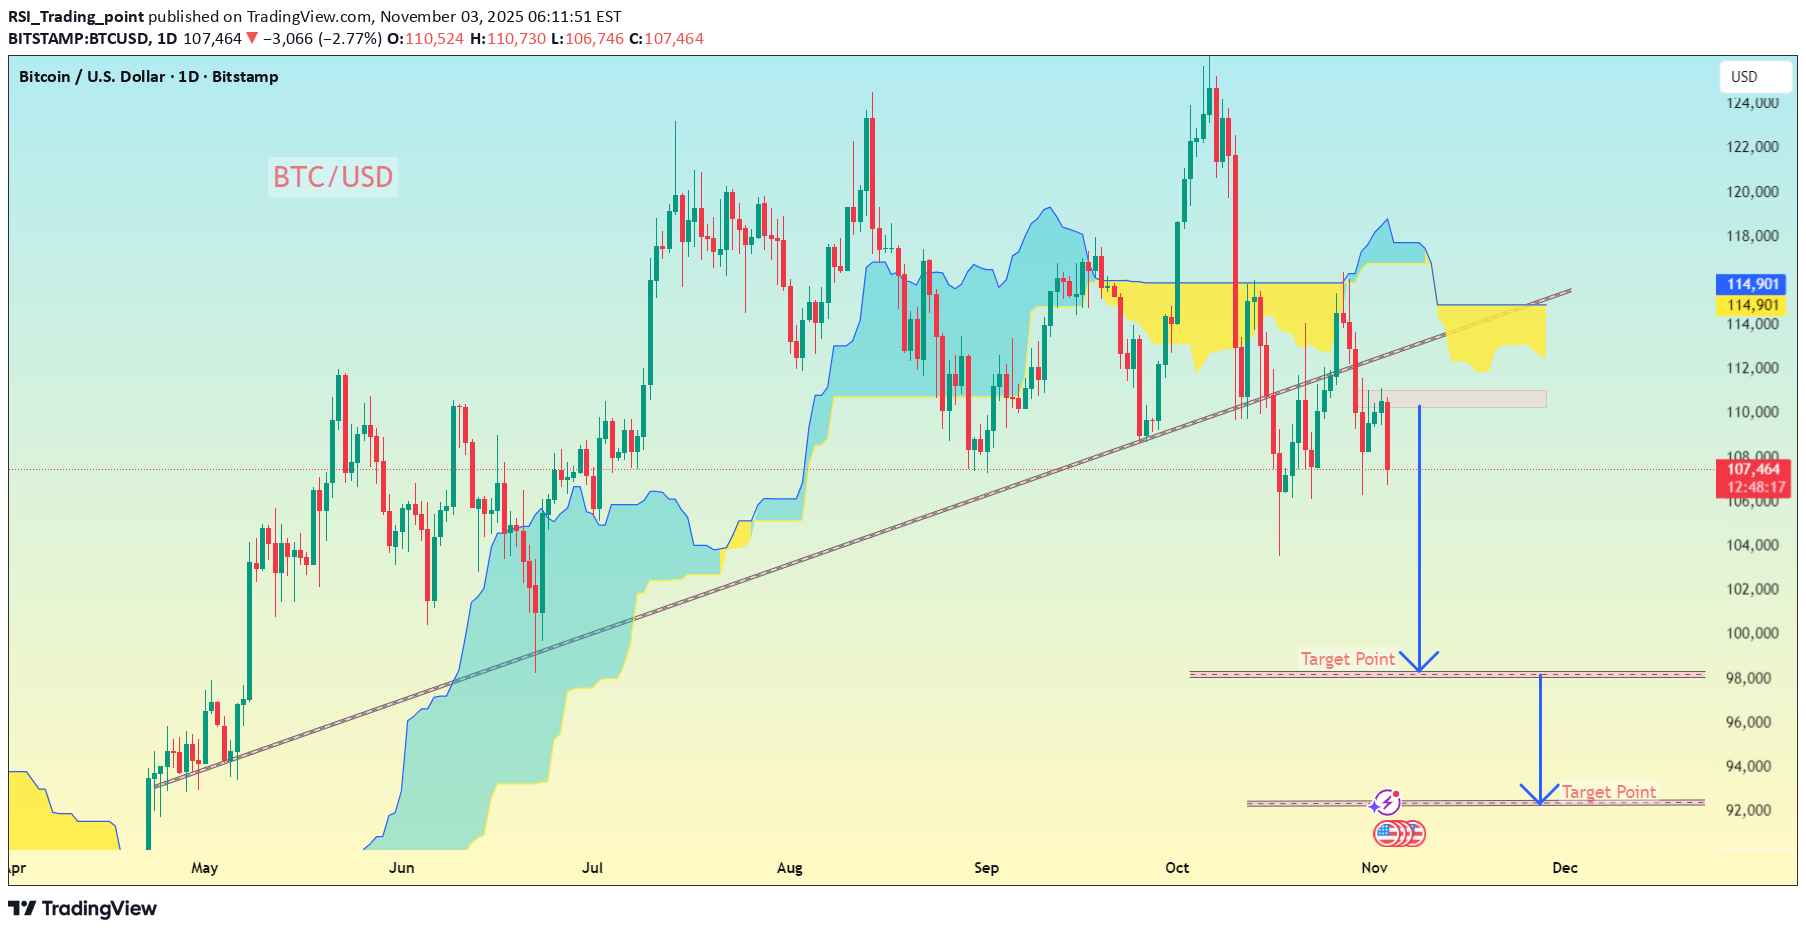
BTC/USD (Bitcoin vs USD) chart 👇 🧭 Timeframe: I'm using the 1-Day (D1) chart — so this is a medium-term setup, not intraday. --- 📊 Technical Overview: Price is currently around $107,400. A major ascending trendline (support) has been broken downward — bearish signal. Ichimoku Cloud shows resistance above price, confirming bearish pressure. I have blue arrows and “Target Point” levels marked below current price — indicating a downside projection. --- 🎯 Target Zones (as shown in my chart): 1. First Target Point: around $100,000 – $101,000 → This is my initial bearish target after the trendline break. 2. Second Target Point: around $94,000 – $95,000 → This is my extended target zone if the bearish trend continues. --- ⚠ Key Levels: TypeLevel (USD)Comment Resistance114,000 – 115,000Strong rejection area inside cloud Break Zone / EntryBelow 107,000Confirms bearish continuation Target 1100,000 – 101,000First take-profit zone Target 294,000 – 95,000Final target zone Stop-Loss115,000 – 116,000Above Ichimoku cloud --- 📉 Summary: Trend: Bearish Entry Idea: Sell below $107,000 daily close TP1: $100,000 TP2: $94,000 SL: $115,000trade active