
BitonGroup
@t_BitonGroup

What symbols does the trader recommend buying?
Purchase History
پیام های تریدر
Filter
BitonGroup
XAUUSD Video Analysis Brief – Weekly Forecast Summary (2025)

This video summarizes the key scenarios and technical outlook for Gold (XAUUSD) on the weekly timeframe, integrating both Fibonacci-based projections and macro fundamentals. Core Setup Gold is currently positioned near the 161.8% Fibonacci extension (~$3,276). A breakout toward $3,500 is possible before a potential corrective move. Scenario 1: Bullish Continuation Gold breaks above $3,435 → rallies to $4300 → continues toward major Fibonacci targets: TP: $4,320, which is the Fibonacci level 261.8% Scenario 2: Correction First Gold fails to hold above $3,435 → triggers a healthy correction to: TP1: $2,920 TP2: $2,650 If support 161.8% level holds in the correction zone, a renewed bullish phase is expected. Macro Alignment Central bank gold buying (notably BRICS) supports the long-term bid. Fed policy leaning dovish → tailwinds for gold. Inverse correlation with DXY: DXY below 98.95 → bullish for gold DXY above 100 → signals correction Effect on Altcoins If correction is risk-on driven, capital may rotate into altcoins. If triggered by macro stress or USD strength, alts may fall alongside gold. This analysis offers a multi-scenario framework to navigate the next major moves in gold, with key levels to watch for traders, investors, and macro analysts alike.Bull run seems startedabsolutely on the expected bullish prediction
BitonGroup
Gold (XAUUSD) Weekly TF 2025

Overview This analysis outlines the structural Fibonacci confluences, scenario planning, and macro-aligned projections for Gold (XAUUSD) on the weekly timeframe. It integrates multi-layered Fibonacci extensions and retracements, mapping out key support and resistance levels, and proposes a nuanced primary scenario that includes both intermediate rallies and corrective movements. Primary Scenario – Multi-Stage Movement Hypothesis We anticipate that gold may initially extend higher from the current level (~$3,325) to test the 127.2% Fibonacci extension at $3,435, with the possibility of a further intermediate peak near $3,500. This level marks a psychological and technical resistance zone and could act as a temporary top. Following this local peak, a corrective phase may unfold. This pullback could evolve into one of the two outlined correction scenarios: 1 TP Correction Scenario Support Target: ~$2,950 Basis: 100% Fib extension confluence and prior resistance turned support Expected Outcome: Price stabilizes at this level and resumes upward momentum 2 TP Correction Scenario Support Target: ~$2,650 Basis: Strong historical structure + 100% Fib confluence from a broader cycle Expected Outcome: This zone acts as a long-term demand accumulation area Upon completion of the corrective structure, we expect gold to reinitiate its primary bullish trend. Bullish Continuation Targets TP1: ~$4,050 (161.8% Fibonacci extension) TP2: ~$4,319 (261.8% Fibonacci extension) These targets align with macroeconomic conditions, central bank accumulation trends, and long-term structural cycles. Supporting Technicals RSI: Holding above 50, indicating preserved bullish momentum MACD: Positive crossover with widening histogram on weekly timeframe Price Action: Strong support zone between $3,280–$3,300 aligning with 161.8% Fib retracement of the recent minor wave Macro Fundamentals & Correlations Central Bank Gold Demand: Sustained net buying by BRICS nations, particularly China and Russia, supports the structural bid on gold Fed Policy: Market anticipates a prolonged pause or gradual rate cuts, favoring non-yielding assets like gold DXY & US10Y Yields: Any further decline in DXY or softening yields would add tailwinds to gold Crypto Correlation: During inflationary hedging or systemic risk periods, gold and crypto may correlate positively, especially with weakening USD Intermarket Relationships: Gold, DXY, and TOTAL (Crypto Market Cap) Gold vs. DXY (US Dollar Index) Gold historically maintains an inverse correlation with DXY. A rising DXY tends to apply downward pressure on gold prices, while a falling DXY enhances gold's upside momentum. Scenario Interactions: If DXY breaks below 98, this could validate the bullish scenario for gold toward $3,435–$4,050. If DXY rallies back above 100, it could trigger the correction scenarios ($2,950 or $2,650) in gold. Gold vs. TOTAL (Crypto Market Cap) Gold and TOTAL may show positive correlation during periods of USD weakening and global liquidity expansion. Scenario Interactions: If gold rallies toward $3,500 and TOTAL also breaks key resistance (e.g., $1.8T–$2T), this signals synchronized bullish risk appetite. If gold corrects while TOTAL continues to rise, it could indicate rotation of liquidity from defensive to risk-on assets. A simultaneous correction in both may occur if DXY strengthens aggressively or if macro shocks reduce global liquidity. These intermarket relationships should be monitored continuously to assess the evolving macro context and validate the chosen scenario. In the case of a gold correction toward $2,950 or $2,650, the impact on altcoins will hinge on the prevailing macroeconomic backdrop. If the correction stems from a healthy, technical rebalancing within a risk-on environment—without a concurrent surge in the U.S. dollar—it could signal a shift in capital from defensive assets like gold into more speculative plays, including altcoins. This type of capital rotation often benefits the crypto market, particularly if TOTAL (crypto market cap) holds or advances structurally. However, if the correction is caused by rising dollar strength, tightening financial conditions, or broader risk-off sentiment, altcoins may instead suffer alongside gold, as liquidity is withdrawn across the board. Therefore, the context and drivers behind gold’s correction are crucial in assessing its downstream effects on altcoin performance. From a philosophical lens, gold's cyclical ascent and retreat mirrors the rhythm of nature and human experience—expansion, contraction, and renewal. Just as rivers carve valleys before surging toward the ocean, the market too must surrender gains to gather force. A correction in gold is not merely a financial event, but a moment of recalibration—an inhale before the next exhale of momentum. It invites reflection: whether wealth seeks refuge or ventures into risk, whether fear contracts or ambition expands. In this interplay, altcoins may inherit the restless spirit of capital in search of yield, as gold, the ancient anchor of value, briefly pauses in its timeless journey. Conclusion We present a multi-phased path for gold where: An initial bullish breakout toward $3,435–$3,500 forms a short- to mid-term peak A subsequent correction brings gold to either $2,950 or $2,650, depending on macro triggers A renewed bull rally drives gold toward $4,050 and potentially $4,319 and beyond This scenario reflects both the cyclical nature of market structure and the macro-fundamental backing that continues to support long-term gold strength.the bullish momentum seems to be kicked offFirst Target AchievedAll Targets Achieved
BitonGroup
S&P 500 Index (SPX) Weekly TF – 2025
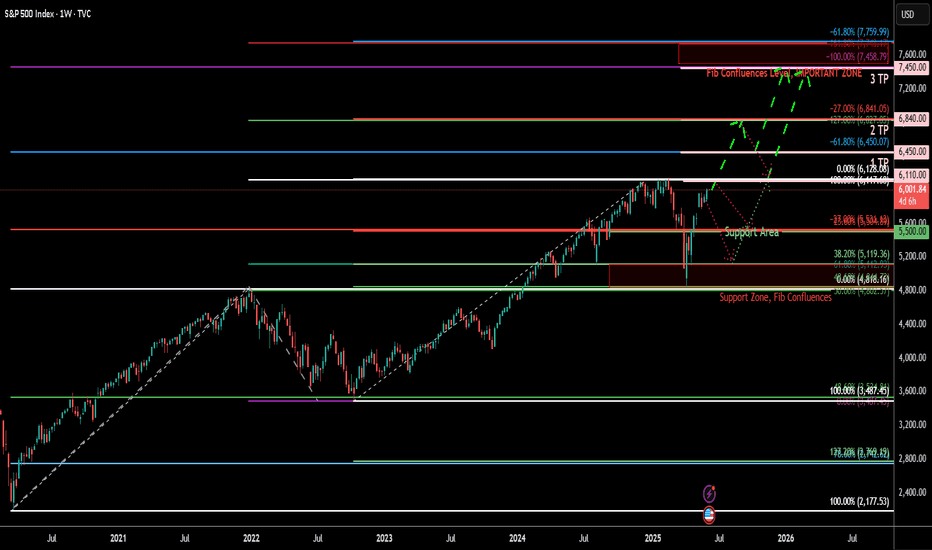
Chart Context: Tools Used: 3 Fibonacci Tools: 1. One **Fibonacci retracement** (from ATH to bottom) 2. Two **Trend-Based Fibonacci Extensions** * Key Levels and Zones: * **Support Zone** (Fib Confluence): \~4,820–5,100 * **Support Area (shallow pullback)**: \~5,500–5,600 * **Resistance & TP Zones:** * TP1: **6,450** (Fib confluence & -61.8%) * TP2: **6,840** (-27%) * TP3: **7,450–7,760** (Major Confluence) Technical Observations: * SPX is approaching a **critical resistance** near previous ATH (\~6,128) with projected upward trajectory. * The **green dashed path** suggests a rally continuation from current \~6,000 levels to TP1 (\~6,450), TP2 (\~6,840), and eventually TP3 (\~7,450–7,760), IF no major macro shock hits. * The **purple dotted path** suggests a potential retracement first to \~5,600 (shallow correction) or deeper into \~5,120 or even 4,820 zone before continuing the bullish rally. * The major support zone around **4,820–5,120** includes key Fib retracement levels (38.2% and 61.8%) from both extensions and historical breakout levels. Fundamental Context: * US economy shows **resilience** amid soft-landing narrative, though inflation remains sticky. * The **Federal Reserve** is expected to cut rates in **Q3–Q4 2025**, boosting equity valuations. * Liquidity expansion and dovish outlook support risk assets, including **equities and crypto**. * However, **AI-driven tech rally** may be overstretched; a correction could follow earnings disappointments or macro surprises (e.g., jobs or CPI shocks). Narrative Bias & Scenarios: **Scenario 1 – Correction Before Rally (Purple Path)** * If SPX faces macro pushback (e.g., high CPI, hawkish Fed), expect retracement to: * 5,600 = Fib -23.6% zone * 5,120–4,820 = Major Fib Confluence Zone * These would act as **accumulation zones**, setting up next leg up toward TP1 and beyond. * **Effect on Gold**: May rise temporarily due to risk-off move. * **Effect on Crypto**: Could stall or correct, especially altcoins. **Scenario 2 – Straight Rally (Green Path)** * If Fed confirms cuts and macro remains soft: * SPX breaks ATH (\~6,128) * Hits TP1 (\~6,450), TP2 (\~6,840) * Eventually reaches confluence at **TP3 (7,450–7,760)** * **Effect on Gold**: May struggle; investor preference for equities. * **Effect on Crypto**: Strong risk-on appetite, altseason continuation. Indicators Used: * 3 Fibonacci levels (retracement + 2 extensions) * Trendlines (macro and local) * Confluence mapping Philosophical/Narrative Layer: This phase of the market resembles a test of collective confidence. Equity markets nearing ATHs while monetary easing begins reflect a fragile optimism. The Fibonacci levels act as narrative checkpoints — psychological as much as mathematical. Will we rally on faith or fall for rebalancing? Bias & Strategy Implication: Bias: Bullish with caution * Strategy: * Await **confirmation breakout >6,128** for fresh long entries * Accumulate on dips in the **5,100–5,500** zone if correction unfolds * Use **TP1, TP2, TP3** as staged exits Related Reference Charts: * BTC.D Analysis – Bearish Bias: * TOTAL:Bullish Bias *TOTAL3 – Bullish Bias: * US10Y Yield – Falling Bias Impact:the First Target Achieved
BitonGroup
Ethereum / US Dollars (ETHUSDT) Short Selling with DCA 19/09/23
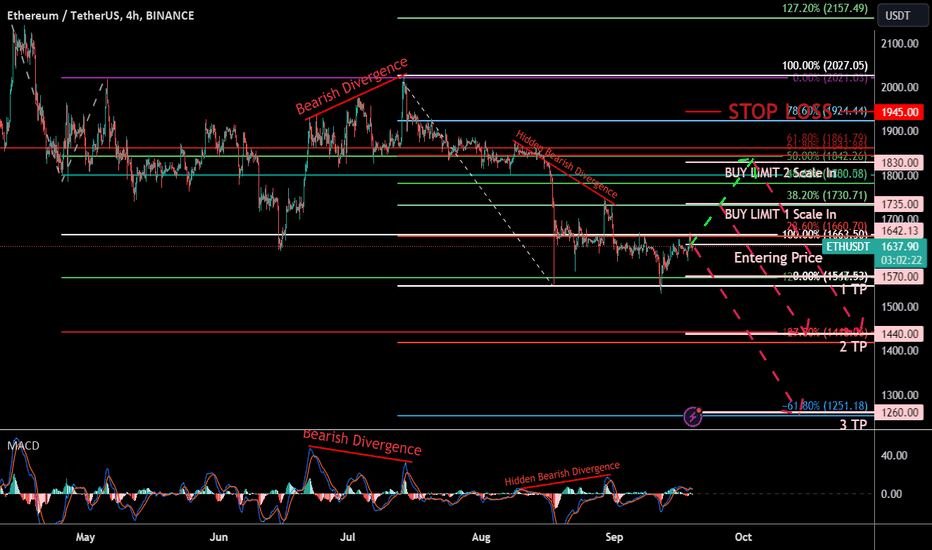
Ethereum / US Dollars (ETHUSDT) Short Selling with DCA 19/09/23 Technical Analysis: In this analysis, I adopt an all-encompassing approach that melds Fibonacci retracement and extension levels with Fibonacci Projection, confluence analysis, and the MACD indicator, with a distinct short sell bias for the 4 Hour Time frame as requested on the assignment, dated on 15/09/2023, 12:55 pm on LinkedIn message section. Additionally, I'll introduce a strategic Dollar-Cost Averaging (DCA) strategy with two scale-in levels. Please refer to the chart for a comprehensive visual analysis: please zoom out the chart for better comprehension. Key Technical Observations: Fibonacci Levels: My analysis meticulously places Fibonacci retracement and extension and projection levels on the chart, highlighting potential resistance zones and solidifying the short sell bias. MACD Divergence: Vigilance for MACD divergence patterns remains paramount. (Bearish Divergence) accompanied with (Hidden Bearish Divergence) bolsters the short sell bias. Strategic Entry Points: I identify key entry points for initiating short positions, at $1642 Spot Price at the time of publication capitalizing on price movements in harmony with the overall bias. DXY is very much bullish which is an other sign that the Total Crypto Market cap may fall and ultimately BTC will dip to the lower prices the above analysis can show the possibilities of DXY rally Technical Conditions: Take-Profit Levels (TPs): To maximize potential gains from the short sell bias, consider the following TP levels: 1st TP: $1570 2nd TP: $1440 3rd TP: $1260 Dollar-Cost Averaging (DCA): I advocate a DCA strategy for scaling into short positions. Start with a partial position at the initial entry point and progressively adding to the short position at the following DCA scale-in levels: Scale-In Level 1: DCA Price Level 1: $1735 Scale-In Level 2: DCA Price Level 2: $1830 Stop Loss: Prudent risk management includes placing a stop loss at $1945 which is above the 78.6% level of the minor reverse Fibonacci Retracement level, to safeguard against unexpected price reversals. Trading Scenario: Short Sell Bias: Given the confluence of Fibonacci resistance, a bearish and a hidden MACD divergence, and strategic entry points, my analysis strongly favors a short sell bias. Adaptability: Stay adaptable to market conditions, prepared to adjust your strategy in response to any unexpected developments. This analysis is grounded in historical data, technical indicators, and a clear bearish bias, complemented by a DCA strategy with two scale-in levels. As with any trading strategy, it's essential to conduct thorough research, adhere to your trading plan, and continuously refine your approach as we navigate the dynamic cryptocurrency markets. I eagerly await your insights and engaging discussions about this analysis, as we explore opportunities in bullish market scenarios!Comment: Edit: Typing Error Correction... Both the Scale in Levels are Sell Limit Orders and there is a typing mistake. *(Buy Limits are Typing Mistake(Errors)) Correct: Sell Limit 1: $1735 Sell Limit 2: $1830Comment: Fundamental Analysis - FOMC Meeting, September 20, 2023 Overview: The upcoming Federal Open Market Committee (FOMC) meeting scheduled for September 20, 2023, holds paramount significance for financial markets worldwide. One of the focal points of this event centers on the potential decision regarding an interest rate increase by the U.S. Federal Reserve. Interest Rate Decision: Market participants are on high alert for any indication of an interest rate hike during the meeting. The Federal Reserve's decision regarding interest rates carries profound implications for the U.S. economy and global financial markets. If an interest rate increase is announced, it signifies the central bank's response to various economic factors, including inflation, employment levels, and overall economic stability. Impact on the U.S. Dollar (DXY): An interest rate hike typically exerts upward pressure on the U.S. Dollar (USD). Consequently, this may lead to a strengthening of the U.S. Dollar Index (DXY), which measures the USD's performance against a basket of major world currencies. A stronger USD can have implications for global trade, foreign exchange markets, and various asset classes. Effect on Cryptocurrencies: In the realm of cryptocurrencies, a stronger USD historically correlates with downward pressure on digital asset prices. A robust USD can make it relatively more expensive for foreign investors to enter the cryptocurrency market, leading to decreased demand. However, it's essential to consider that cryptocurrency markets are influenced by multifaceted factors, including market sentiment, regulatory developments, and macroeconomic trends. Conclusion: The FOMC meeting on September 20, 2023, serves as a critical event for investors and traders across traditional and digital asset markets. Beyond the immediate reaction to interest rate decisions, it is vital to monitor the Federal Reserve's statements and outlook for insights into future monetary policy. The interplay between monetary policy, economic fundamentals, and market sentiment will shape the dynamics of financial markets in the days and weeks following this pivotal event.
BitonGroup
Zilliqa /US Dollars (ZILUSDT) Short Selling Chance19/02/2023

Zilliqa /US Dollars (ZILUSDT) Short Selling Chance19/02/2023 Technical Analysis: In this analysis, I adopt an all-encompassing approach that melds Fibonacci retracement and extension levels with Fibonacci Projection, confluence analysis, and the MACD indicator, with a distinct short sell bias for the 30 Minutes Time frame as requested on the assignment, dated on 15/09/2023, 12:55 pm on LinkedIn message section. Additionally, I'll introduce a strategic Dollar-Cost Averaging (DCA) strategy with two scale-in levels. Please refer to the chart for a comprehensive visual analysis: please zoom out the chart for better comprehension. Key Technical Observations: Fibonacci Levels: My analysis meticulously places Fibonacci retracement and extension and levels on the chart, highlighting potential resistance zones and solidifying the short sell bias. MACD Divergence: Vigilance for MACD divergence patterns remains paramount. (Bearish Divergence) accompanied with (Hidden Bearish Divergence) bolsters the short sell bias. Strategic Entry Points: I identify key entry points for initiating short positions, at $0.01620 Spot Price at the time of publication capitalizing on price movements in harmony with the overall bias. DXY is very much bullish which is an other sign that the Total Crypto Market cap may fall and ultimately BTC will dip to the lower prices the above analysis can show the possibilities of DXY rally Technical Conditions: Take-Profit Levels (TPs): To maximize potential gains from the short sell bias, consider the following TP levels: 1st TP: $0.01619 2nd TP: $0.01580 3rd TP: $0.01550 Dollar-Cost Averaging (DCA): I advocate a DCA strategy for scaling into short positions. Start with a partial position at the initial entry point and progressively adding to the short position at the following DCA scale-in levels: Scale-In Level 1: DCA Price Level 1: $0.01635 Scale-In Level 2: DCA Price Level 2: $0.01650 Stop Loss: Prudent risk management includes placing a stop loss at $0.017 which is above the 0% level of the minor reverse Fibonacci Retracement level, to safeguard against unexpected price reversals. Trading Scenario: Short Sell Bias: Given the confluence of Fibonacci resistance, a bearish and a hidden MACD divergence, and strategic entry points, my analysis strongly favors a short sell bias. Adaptability: Stay adaptable to market conditions, prepared to adjust your strategy in response to any unexpected developments. This analysis is grounded in historical data, technical indicators, and a clear bearish bias, complemented by a DCA strategy with two scale-in levels. As with any trading strategy, it's essential to conduct thorough research, adhere to your trading plan, and continuously refine your approach as we navigate the dynamic cryptocurrency markets. I eagerly await your insights and engaging discussions about this analysis, as we explore opportunities in bullish market scenarios!Comment: Fundamental Analysis : FOMC Meeting, September 20, 2023 Overview: The upcoming Federal Open Market Committee (FOMC) meeting scheduled for September 20, 2023, holds paramount significance for financial markets worldwide. One of the focal points of this event centers on the potential decision regarding an interest rate increase by the U.S. Federal Reserve. Interest Rate Decision: Market participants are on high alert for any indication of an interest rate hike during the meeting. The Federal Reserve's decision regarding interest rates carries profound implications for the U.S. economy and global financial markets. If an interest rate increase is announced, it signifies the central bank's response to various economic factors, including inflation, employment levels, and overall economic stability. Impact on the U.S. Dollar (DXY): An interest rate hike typically exerts upward pressure on the U.S. Dollar (USD). Consequently, this may lead to a strengthening of the U.S. Dollar Index (DXY), which measures the USD's performance against a basket of major world currencies. A stronger USD can have implications for global trade, foreign exchange markets, and various asset classes. Effect on Cryptocurrencies: In the realm of cryptocurrencies, a stronger USD historically correlates with downward pressure on digital asset prices. A robust USD can make it relatively more expensive for foreign investors to enter the cryptocurrency market, leading to decreased demand. However, it's essential to consider that cryptocurrency markets are influenced by multifaceted factors, including market sentiment, regulatory developments, and macroeconomic trends. Conclusion: The FOMC meeting on September 20, 2023, serves as a critical event for investors and traders across traditional and digital asset markets. Beyond the immediate reaction to interest rate decisions, it is vital to monitor the Federal Reserve's statements and outlook for insights into future monetary policy. The interplay between monetary policy, economic fundamentals, and market sentiment will shape the dynamics of financial markets in the days and weeks following this pivotal event.
BitonGroup
Shentu / US Dollars (CTKUSDT) Coin Analysis 11/09/2023

Shentu / US Dollars (CTKUSDT) Coin Analysis 11/09/2023 Fundamental Analysis: Shentu Chain is a security-focused delegated proof-of-stake blockchain designed for the secure execution of mission-critical applications, including DeFi, NFTs, and autonomous vehicles. The platform places a strong emphasis on cross-chain compatibility and operates as a Cosmos Hub with comprehensive compatibility for EVM (Ethereum Virtual Machine) and Hyperledger Burrow. It also supports eWASM and Ant Financial's AntChain. Shentu Chain offers a Security Oracle that delivers real-time monitoring of on-chain transactions across various protocols, proactively identifying and flagging potential malicious vulnerabilities before they can be exploited. Depending on their security score, audited blockchain projects from any protocol may qualify for ShentuShield membership, a decentralized reimbursement system designed to compensate users for crypto assets that are lost or stolen due to security issues. ShentuShield memberships are open to all community members of eligible blockchain projects, providing an added layer of security for crypto asset holders in case of unexpected events. Projects on Shentu Chain have the option to code in DeepSEA, an exceptionally secure programming language supported by prominent organizations such as the Ethereum Foundation, Qtum Foundation, and IBM. DeepSEA seamlessly interfaces with the Shentu Virtual Machine (SVM), which is fully compatible with EVM. SVM introduces innovative ways to access, verify, and incorporate risk-related information into smart contract decisions. The native digital utility token of Shentu Chain is CTK, which serves as the core utility for various on-chain functions, including operating the Security Oracle and ShentuShield systems, covering gas costs on the Shentu Chain, and participating in governance decisions within the network. ShentuShield is a decentralized membership system designed to facilitate reimbursements for lost or stolen cryptocurrency assets from any blockchain protocol. The decision-making process for reimbursements lies entirely in the hands of ShentuShield members, who can be blockchain projects or individual community supporters. Members have the option to participate in various capacities, either as Collateral Providers or Shield Purchasers. Collateral Providers contribute their own collateral, typically in the form of CTK tokens, and in return, they earn staking rewards on their staked CTK. They also receive a portion of the fees paid by Shield Purchasers. Shield Purchasers, on the other hand, set aside funds from the Pool to act as a reserve for potential reimbursements of their own cryptocurrency assets. In exchange for this protection, Shield Purchasers pay a fee in CTK, which directly benefits the Collateral Providers. The CTK fees collected from Shield Purchasers are used to compensate Collateral Providers in the event of a reimbursement request. This unique system fosters a collaborative ecosystem where participants collectively share the responsibility of safeguarding crypto assets and providing reimbursement support. It offers transparency through a list of publicly viewable and audited clients, ensuring accountability and trust within the community. The Security Oracle comprises a decentralized network of operators equipped with cutting-edge security technologies, responsible for assessing the trustworthiness of mission-critical smart contracts, particularly those employed in DeFi applications. As compensation for delivering real-time, updatable security scores, these operators are rewarded with CTK tokens. The Security Oracle is designed for interoperability, making it compatible with any protocol. This interoperability empowers users of various protocols to make informed decisions before engaging with smart contracts. Smart contracts that have integrated the Security Oracle can proactively identify and block potentially malicious transactions, thereby mitigating the risk of cryptocurrency asset loss. Although the Shentu Virtual Machine (SVM) is fully compatible with the Ethereum Virtual Machine (EVM), its architecture is inspired by the widely used x86-64 OS process model found in computers worldwide. There is also potential for future extensions to support arm64. The SVM introduces the capability to configure on-chain security parameters, allowing smart contracts to interact with one another in ways that align with their individual risk tolerances. Moreover, the SVM is designed to incorporate a smart contract sandbox, which isolates the operation of smart contracts, particularly those that haven't been adequately secured, from the broader system. This isolation enhances security and minimizes potential risks associated with unverified smart contracts. DeepSEA is a highly secure programming language and compiler toolchain that seamlessly integrates with the Shentu Virtual Machine (SVM), Ethereum Virtual Machine (EVM), eWASM, and Ant Financial's AntChain. DeepSEA has received research grants from Ethereum, IBM-Columbia, and Qtum to advance its exceptionally secure programming language. When developers use DeepSEA for coding, the language automatically generates mathematical proofs to demonstrate the alignment between the intended specification and the actual code. This automatic proof generation enables a more comprehensive level of formal verification and correctness in smart contract development, enhancing security and reliability. Technical Analysis: We have applied Fibonacci retracement tools, extending from $0 to $3.97 the so called last great bullish cycle. Within this analysis, we have identified potential support and resistance areas on the chart based on the retracement levels. In addition to the retracement levels, we have utilized Fibonacci projection tools to delineate additional potential support areas below the previous all-time low price. This projection is based on the most recent market cycle. Consequently, we have established two potential support levels at $0.45 and $0.2. Furthermore, we have outlined three potential price targets using the Fibonacci retracement levels from the ATH cycle. These targets are anticipated within the next few weeks to months and are as follows: First Target Price (1 TP): $0.85 Second Target Price (2 TP): $1.5 Third Target Price (3 TP): $2 These levels serve as key reference points for our analysis, guiding our expectations for future price movements. Sentiment Analysis: Considering the possibility of depreciation in the total market capitalization of cryptocurrencies and the price of Bitcoin (BTC) in the upcoming months, it is reasonable to consider employing a Dollar Cost Averaging (DCA) strategy for long positions at the specified support levels.
BitonGroup
dYdX / US Dollar (DYDXUSDT) Token Analysis 11/09/2023

dYdX / US Dollar (DYDXUSDT) Token Analysis 11/09/2023 Fundamental Analysis: DYDX (dYdX) is the governance token associated with the layer 2 protocol of the decentralized cryptocurrency exchange that shares its name. This token plays a crucial role in facilitating the operation of the layer 2 protocol and empowers traders, liquidity providers, and partners to actively participate in shaping the protocol's future as part of the community. Token holders enjoy various privileges, including the ability to propose changes to the dYdX layer 2 protocol. They also have opportunities for profit through activities such as token staking and trading fee discounts. Leveraging the StarkEx scalability engine from Starkware, the layer 2 solution on dYdX is specifically tailored for cross-margined perpetual trading. This scaling solution enhances transaction speed, eliminates gas costs, reduces trading fees, and lowers minimum trade sizes on the platform. As an open-source platform with smart contract capabilities, dYdX serves as a versatile ecosystem for users to engage in lending, borrowing, and trading various crypto assets. While the platform does support spot trading, its primary focus lies in derivatives and margin trading. Founded in 2017, dYdX secured over $10 million in seed venture capitalist funding and officially launched in 2019. The DXDY token's initial coin offering (ICO) took place on September 9th, 2021. dYdX stands as a cryptocurrency exchange that melds advanced financial tools with the principles of decentralization. The platform offers support for margin trading, a financial product that empowers investors to amplify their exposure to digital assets through leverage. dYdX offers two distinct margin trading options: isolated margin, allowing users to allocate specific funds for a trade, and cross-margin, which utilizes all assets held by a trader on the platform. Additionally, dYdX facilitates the trading of perpetuals, a type of futures contract without a predetermined expiry date. The exchange provides a maximum leverage of 25x on synthetic assets that have no expiration date. When users deposit funds into their dYdX accounts, they immediately begin earning interest, as their assets become part of a global lending pool dedicated to each cryptocurrency. dYdX ensures the security of lenders by requiring borrowers to maintain sufficient collateral in their accounts at all times. Borrowing on dYdX enables users to swiftly acquire any available asset on the platform by using their existing funds as collateral for the loan. Unlike automated market makers such as Uniswap, dYdX employs an order book architecture. dYdX's Layer 2 solution enhances network scalability by implementing zero-knowledge rollup technology, specifically zkSTARKS. This technology generates proofs while validating a batch of transactions off-chain. These proofs are then transmitted back to the blockchain, where they are verified by a smart contract. zkSTARKS allows for the offloading of resource-intensive computations from the mainnet without compromising decentralization. In addition to trading and liquidity provider rewards, dYdX introduces retroactive mining benefits, demonstrating gratitude to historical users and encouraging their continued participation on the Layer 2 protocol. Token holders can stake their assets in dYdX's safety and liquidity pools. The safety pool serves as a safeguard in case of a shortfall event, while the liquidity pool aims to attract high-quality market makers to the platform. DYDX is an ERC-20 token that has been deployed on the Ethereum mainnet. The layer 2 scaling solution utilized by dYdX is constructed on Starkware's ZK-STARKS technology, leveraging the Ethereum blockchain to validate transaction proofs. The DYDX token was initially made available for purchase in September 2021. Antonio Juliano, a seasoned programmer with a strong background in blockchain technology, serves as the Founder and CEO of dYdX. His foray into the cryptocurrency realm began in 2015 when he secured a position as a software engineer at Coinbase, a prominent cryptocurrency exchange platform. Holding a computer science degree from Princeton University, Antonio Juliano embarked on his entrepreneurial journey and established dYdX in early 2017. Zhuoxun Yin assumes the role of Head of Operations at dYdX. His prior experience includes positions at Nimble, a social sales and marketing CRM, and Bain & Company, a renowned consulting service. Zhuoxun Yin pursued his education at the University of Queensland, where he earned a bachelor's degree in commerce. Technical Analysis: We have applied Fibonacci retracement tools, extending from $0 to its all-time high (ATH) of $27.9. Within this analysis, we have identified potential support and resistance areas on the chart based on the retracement levels. In addition to the retracement levels, we have utilized Fibonacci projection tools to delineate additional potential support areas below the previous all-time low price. This projection is based on the most recent market cycle. Consequently, we have established three potential support levels at $1.4 or 95% and $1 Defined by Price Action and $0.5 defined by Projection of the past cycle. Furthermore, we have outlined three potential price targets using the Fibonacci retracement levels from the ATH cycle. These targets are anticipated within the next few weeks to months and are as follows: First Target Price (1 TP): $4.15 Second Target Price (2 TP): $6 Third Target Price (3 TP): $10.5 These levels serve as key reference points for our analysis, guiding our expectations for future price movements. Sentiment Analysis: Considering the possibility of depreciation in the total market capitalization of cryptocurrencies and the price of Bitcoin (BTC) in the upcoming months, it is reasonable to consider employing a Dollar Cost Averaging (DCA) strategy for long positions at the specified support levels.
BitonGroup
JOE / US Dollar (JOEUSDT) Token Analysis 11/09/2023

JOE / US Dollar (JOEUSDT) Token Analysis 11/09/2023 Fundamental Analysis: JOE (JOE) serves as the native token for Trader Joe, a decentralized exchange (DEX) operating on the Avalanche (AVAX) blockchain. Trader Joe offers a range of DeFi services, including swapping, staking, and yield farming. Since its launch in June 2021, the exchange has experienced rapid growth, attracting over $4 billion in total value locked (TVL). Trader Joe places a strong emphasis on a community-first approach and values innovation, speed, and security. The platform aims to provide a comprehensive DeFi experience, offering various services while prioritizing the safety of its users' assets. To achieve these goals, Trader Joe has laid out an ambitious roadmap for 2021, focusing on token-holder growth. This roadmap includes plans for enhanced staking, the addition of non-fungible-token (NFT) exchange listings, collateralization of the JOE token, and the introduction of leveraged trading features. Trader Joe offers a full suite of features akin to a modern decentralized exchange (DEX) and combines this with a user-friendly interface, ensuring swift and cost-effective transactions. Users have the option to participate in yield farms, providing liquidity and earning JOE (JOE) tokens as rewards, which can subsequently be staked and used for voting in governance proposals. In addition to its DEX functionality, Trader Joe operates a lending protocol known as Banker Joe, built upon the Compound (COMP) protocol. This non-custodial lending platform enables users to both borrow and lend funds. Furthermore, users can open leveraged positions, utilizing either their provided liquidity or borrowed funds. Trader Joe is committed to enhancing the utility and adoption of the JOE token. To achieve this, the project is working on several key additions, aiming to establish itself as the primary DeFi platform within the Avalanche ecosystem. These forthcoming features include the ability to use JOE as collateral for borrowing, the introduction of limit orders, and the inclusion of options and futures trading on the platform. Thanks to its rapid pace of innovation and distinctive comic book-inspired branding, Trader Joe has attracted substantial support from prominent figures within the DeFi community. Notable backers include Stani Kulechov, the founder of AAVE (AAVE), and Darren Lau, among others. Trader Joe operates on the Avalanche (AVAX) blockchain, which features a distinctive proprietary consensus mechanism. In this mechanism, all nodes engage in processing and validating transactions by utilizing a directed acyclic graph (DAG) protocol. At present, the management of the project's treasury is entrusted to its developers, Cryptofish and 0xMurloc. However, the Trader Joe community has plans to establish a multi-signature governance mechanism in the future. In the interim, token holders have the ability to vote on the development of the protocol through the Snapshot platform. Trader Joe was founded by two pseudonymous developers known as Cryptofish and 0xMurloc. Cryptofish is a self-described full-stack and smart contract engineer who played an early role in various Avalanche projects, including Snowball and Sherpa Cash. Prior to this, Cryptofish worked at Google and holds a Master's degree in Computer Science from a U.S. university. On the other hand, 0xMurloc is a full-stack developer with a background in launching several startups and serving as a Senior Product Lead at Grab. In addition to Cryptofish and 0xMurloc, the Trader Joe team comprises over a dozen other pseudonymous contributors who work across various areas, including software development, marketing, and community management. The total supply of JOE (JOE) amounts to 500 million tokens. Notably, JOE was introduced to the market without any pre-sale, private sale, or pre-listing allocations. The distribution of JOE tokens is structured as follows: 50% allocated to liquidity providers. 20% allocated to the project's treasury. 20% designated for the team, subject to a three-month cliff period. 10% reserved for future investors, also subject to a three-month cliff period. JOE tokens are being emitted over a 30-month period, and individuals staking JOE can earn 0.05% of all trades conducted on the platform. Furthermore, JOE tokens are designed to share a portion of the fees generated from lending interest and liquidations with the staking pool. It's important to note that the emission rates of JOE are programmed to progressively decrease over time and are set to conclude at the start of January 2024. Technical Analysis: We have applied Fibonacci retracement tools, extending from $0 to its all-time high (ATH) of $2.79. Within this analysis, we have identified potential support and resistance areas on the chart based on the retracement levels. In addition to the retracement levels, we have utilized Fibonacci projection tools to delineate additional potential support areas below the previous all-time low price. This projection is based on the most recent market cycle. Consequently, we have established two potential support levels at $0.13 and $0.07. Furthermore, we have outlined three potential price targets using the Fibonacci retracement levels from the ATH cycle. These targets are anticipated within the next few weeks to months and are as follows: First Target Price (1 TP): $0.6 Second Target Price (2 TP): $1.065 Third Target Price (3 TP): $1.4 These levels serve as key reference points for our analysis, guiding our expectations for future price movements. Sentiment Analysis: Considering the possibility of depreciation in the total market capitalization of cryptocurrencies and the price of Bitcoin (BTC) in the upcoming months, it is reasonable to consider employing a Dollar Cost Averaging (DCA) strategy for long positions at the specified support levels.
BitonGroup
Curve / US Dollars (CRVUSDT) Token Analysis 11/09/2023

Curve / US Dollars (CRVUSDT) Token Analysis 11/09/2023 Fundamental analysis: Curve functions as a decentralized exchange specializing in stablecoins, employing an automated market maker (AMM) to oversee liquidity management. Its journey began in January 2020, and Curve has since become closely associated with the decentralized finance (DeFi) movement, experiencing substantial growth in the latter part of 2020. In August, Curve introduced a decentralized autonomous organization (DAO) featuring CRV as its native token. This DAO leverages the Ethereum-based creation tool, Aragon, to establish connections among various smart contracts responsible for handling users' deposited liquidity. It's worth noting that governance within this DAO differs in terms of its weighting and other key aspects compared to Aragon. Curve has garnered significant attention by fulfilling its role as an Automated Market Maker (AMM) specifically designed for stablecoin trading. The introduction of the DAO and CRV token has added to its profitability, as CRV serves a governance function and is distributed to users based on their level of liquidity commitment and the duration of their ownership. The surge in DeFi trading has solidified Curve's position in the industry, as AMMs continue to handle substantial amounts of liquidity, leading to increased user profits. Consequently, Curve caters to a broad spectrum of DeFi participants, including those engaged in yield farming and liquidity mining, as well as individuals seeking to optimize returns while holding relatively stable and non-volatile stablecoins. The platform generates revenue by imposing a modest fee, which is then rewarded to liquidity providers. Curve entails the typical risks associated with depositing funds into smart contracts and engaging with Automated Market Makers (AMMs), primarily the risk of impermanent loss. Given that Curve exclusively deals with stablecoins, the likelihood of rapid market fluctuations is diminished. However, users may still experience losses when markets undergo rebalancing to align with cross-market price adjustments. While Curve has undergone audits, it's essential to recognize that these audits do not eliminate the inherent risks associated with exposure to a particular cryptocurrency. Curve (CRV) made its debut in August 2020, coinciding with the launch of the Curve DAO. Its primary role is to serve as a governance mechanism, provide incentives, facilitate fee payments, and offer a means for long-term earnings to liquidity providers. The total supply of CRV tokens amounts to 3.03 billion, with the majority (62%) allocated to liquidity providers. The remaining tokens are distributed as follows: 30% to shareholders, 3% to employees, and 5% to a community reserve. It's important to note that both shareholder and employee allocations are subject to a two-year vesting schedule. CRV did not undergo a premine, and the gradual unlocking of tokens indicates that approximately 750 million tokens should be in circulation one year after the initial launch. The founder and CEO of Curve is Michael Egorov, a Russian scientist with diverse experience in cryptocurrency-related ventures. In 2015, he co-founded NuCypher, where he assumed the role of CTO. NuCypher is a cryptocurrency company focused on developing privacy-preserving infrastructure and protocols. Egorov is also the brain behind LoanCoin, a decentralized bank and loans network. Curve's core team is integrated into the CRV allocation structure, entitling them to receive tokens over a two-year vesting period as per the initial launch plan. In August 2020, Egorov acknowledged that he had "overreacted" by locking up a significant number of CRV tokens in response to yearn.finance's voting power, resulting in him obtaining 71% of governance control in the process. Technical Analysis: As we observe, the price is currently trading within a range bounded by the Fibonacci retracement levels of 78.6% and 95%. Notably, there is a potential support level at $0.15. For the anticipated bullish cycles, we have established three potential price targets: First Target Price (1TP): $6.75 Second Target Price (2TP): $8.5 Third Target Price (3TP): $11 It's worth noting that there are multiple resistance levels marked on the chart, corresponding to the Fibonacci retracement levels. Sentiment Analysis: Considering the possibility of depreciation in the total market capitalization of cryptocurrencies and the price of Bitcoin (BTC) in the upcoming months, it is reasonable to consider employing a Dollar Cost Averaging (DCA) strategy for long positions at the specified support levels and current Price.
BitonGroup
Synthetix / US Dollar (SNX/USDT) Token Analysis 11/09/2023

Synthetix / US Dollar (SNX/USDT) Token Analysis 11/09/2023 Fundamental Analysis: Synthetix is in the process of constructing a decentralized liquidity provisioning protocol accessible for various purposes by any protocol. Its substantial liquidity and minimal fees act as the infrastructure for numerous exciting protocols on both the Optimism and Ethereum networks. A multitude of user-facing protocols within the Synthetix ecosystem, such as Kwenta (Spot and Futures), Lyra (Options), Polynomial (Automated Options), as well as 1inch & Curve (Atomic Swaps), harness Synthetix liquidity to empower their functionalities. Synthetix is developed on the Optimism and Ethereum mainnet platforms. The Synthetix Network is secured by collateral in the form of SNX, ETH, and LUSD, enabling the creation of synthetic assets known as Synths. These Synths mimic and generate returns based on underlying assets without necessitating direct possession of the assets themselves. This pooled collateralization paves the way for a variety of on-chain, composable financial instruments supported by liquidity sourced from Synthetix. Some of the most highly anticipated forthcoming releases from SNX include Perps V2, which seeks to enable cost-effective on-chain futures trading by leveraging off-chain oracles, and Synthetix V3, designed to rebuild the protocol in line with its original objective of becoming a fully permissionless derivatives protocol. You can find more information about Synthetix on their blog or by joining the SNX Discord community. The platform's mission is to expand the cryptocurrency realm by introducing non-blockchain assets, thereby granting access to a more expansive and robust financial market. Synthetix operates as a decentralized exchange (DEX) and serves as a platform for synthetic assets. Its architecture is designed to provide users with exposure to underlying assets through synths, eliminating the need to hold the actual assets themselves. This platform empowers users to autonomously trade and exchange synths, while also offering a staking pool where SNX token holders can stake their tokens and receive rewards in the form of a share of transaction fees from the Synthetix Exchange. To track the underlying assets, Synthetix employs smart contract price delivery protocols known as oracles. This approach ensures that users can seamlessly trade synths without encountering liquidity or slippage issues, and it eliminates the requirement for third-party intermediaries. SNX tokens play a crucial role as collateral for the minting of synthetic assets. Whenever synths are generated, SNX tokens are locked up within a smart contract. Since its inception, the protocol has transitioned to the Optimistic Ethereum mainnet to mitigate gas fees on the network and reduce oracle latency. The SNX token is compatible with Ethereum’s ERC20 standard. The Synthetix network is secured through proof-of-stake (PoS) consensus. Synthetix holders stake their SNX and earn returns from the network fees. Another way for SNX stakers to earn rewards is via the protocol’s inflationary monetary policy, known as staking rewards. The maximum supply of SNX is 323,506,696 coins, of which 269,871,212 SNX is in circulation as of September 2023. At the seed round and token sale stages, Synthetix sold more than 60 million tokens and was able to raise $30 million. Of the total 100,000,000 coins issued during the ICO, 20% was allocated to the team and advisors, 3% to bounties and marketing incentives, 5% to partnership incentives and 12% to the foundation. The network was initially launched in September 2017 by Kain Warwick under the name Havven (HAV). Approximately a year later, the company underwent a rebranding, adopting the name Synthetix. Kain Warwick, the founder of Synthetix, also holds a position as a non-executive director at the blueshyft retail network. Before establishing Synthetix, Warwick had been involved in various other cryptocurrency projects. Additionally, he is the founder of Pouncer, a live auction site exclusive to Australia. Peter McKean, serving as the project's CEO, boasts over two decades of experience in software development. Prior to his role at Synthetix, he worked as a programmer at ICL Fujitsu. Jordan Momtazi, the COO of Synthetix, brings to the team his expertise as a business strategist, market analyst, and sales leader, with a wealth of experience in blockchain, cryptocurrency, digital payments, and e-commerce systems. Justin J. Moses, the CTO, formerly held the position of director of engineering at MongoDB and served as the deputy practice head of engineering at Lab49. He also co-founded Pouncer. Technical Analysis: As we observe, the price has experienced a decline from its all-time high (ATH) of $29 and is currently fluctuating within the Fibonacci retracement levels of 88.6% and 95%. Within this range, there are two noteworthy price support zones at $0.8 and $0.3. We have identified three potential price targets: First Target Price (1TP): $28.8 Second Target Price (2TP): $36.5 Third Target Price (3TP): $46.5 Furthermore, we can regard the major Fibonacci retracement levels as potential resistance levels, which we have indicated on the chart. Sentiment Analysis: Considering the possibility of depreciation in the total market capitalization of cryptocurrencies and the price of Bitcoin (BTC) in the upcoming months, it is reasonable to consider employing a Dollar Cost Averaging (DCA) strategy for long positions at the specified support levels.
Disclaimer
Any content and materials included in Sahmeto's website and official communication channels are a compilation of personal opinions and analyses and are not binding. They do not constitute any recommendation for buying, selling, entering or exiting the stock market and cryptocurrency market. Also, all news and analyses included in the website and channels are merely republished information from official and unofficial domestic and foreign sources, and it is obvious that users of the said content are responsible for following up and ensuring the authenticity and accuracy of the materials. Therefore, while disclaiming responsibility, it is declared that the responsibility for any decision-making, action, and potential profit and loss in the capital market and cryptocurrency market lies with the trader.