
QI
BENQI
| تریدر | نوع سیگنال | حد سود/ضرر | زمان انتشار | مشاهده پیام |
|---|---|---|---|---|
No results found. | ||||
Price Chart of BENQI
سود 3 Months :
سیگنالهای BENQI
Filter
Sort messages by
Trader Type
Time Frame

traderisso
صعود قریبالوقوع: آیا بنکی آماده جهش بزرگ است؟
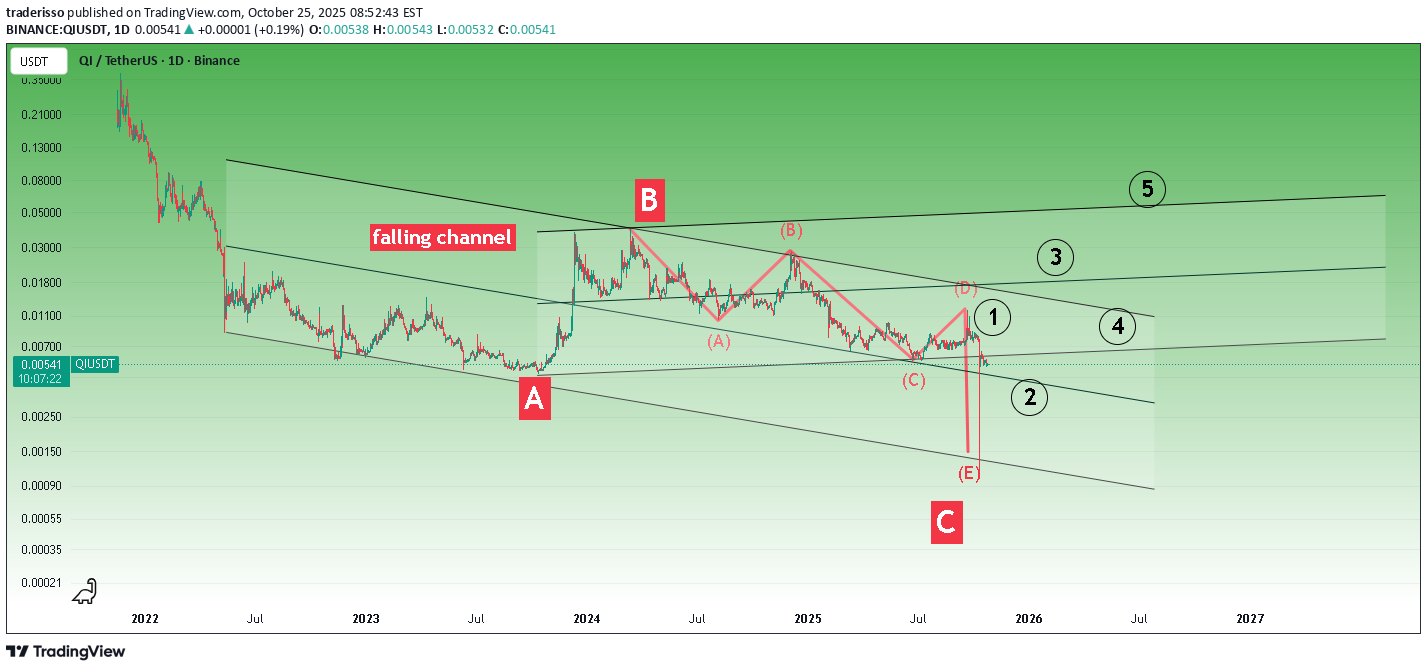
In the long term, ABC correction waves seem to have been completed, so an upward channel may form in the medium term. * The purpose of my graphic drawings is purely educational. * What i write here is not an investment advice. Please do your own research before investing in any asset. * Never take my personal opinions as investment advice, you may lose your money.According to the analysis, it is necessary to wait for the 2nd wave level to buy.

Literaryflavus
سرمایهگذاری 100 برابری با کوین BENQI: فرصت انفجاری یا ریسک بزرگ؟

The image is very positive, I cost around 0.008. It's retesting now, everything seems fine. My target is 100x if the bull comes, otherwise yarrix. YTD SAYS.

CryptoNuclear
QI/USDT at Historical Base: Accumulation or Breakdown Ahead?
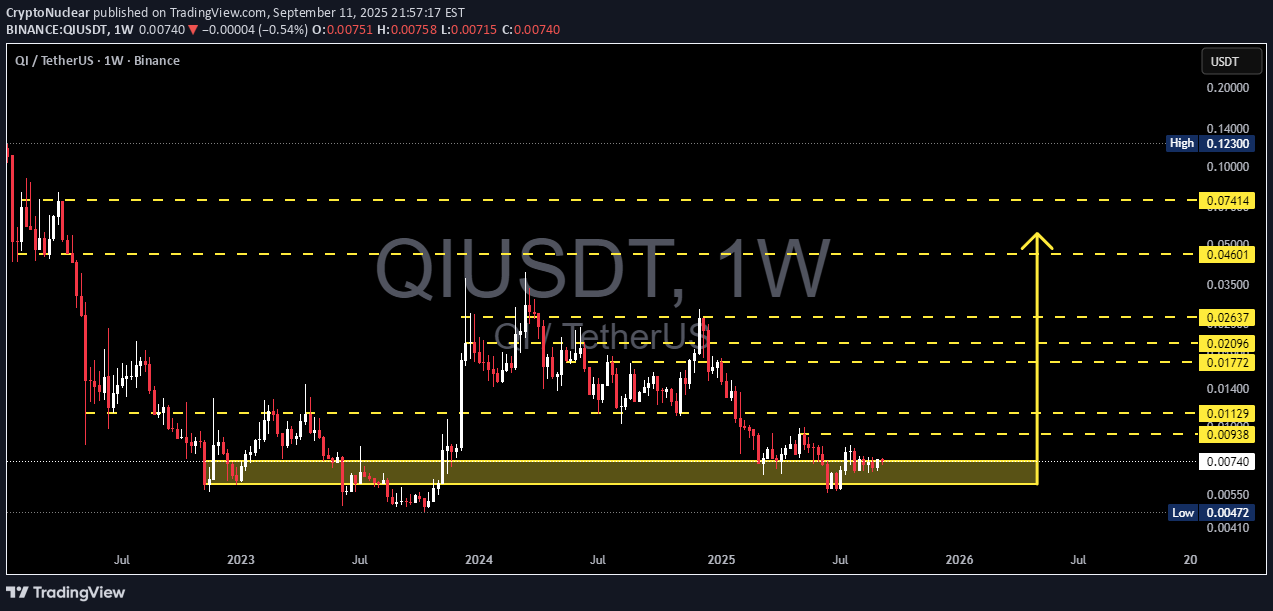
🧩 Overview The QI/USDT pair is currently sitting inside a historical support zone (0.0047 – 0.0074 USDT), a level that has been tested multiple times since 2023. After a multi-year downtrend, the chart is now showing signs of accumulation/sideways consolidation — often a precursor to a major move, either a bullish reversal or a bearish breakdown. Resistance levels are clearly marked by the yellow dashed lines, defining the roadmap QI must break through if it wants to escape this long consolidation. --- 🟢 Bullish Scenario 1. Weekly Breakout Confirmation The first major confirmation = a weekly close above 0.0094 – 0.01 USDT with strong volume. This would mark the first higher-high after a long accumulation phase. 2. Bullish Targets R1: 0.0113 USDT (conservative target, ~52% above current price). R2: 0.0177 USDT (~138%). R3: 0.0209 – 0.0263 USDT (~180% – 255%). Extended rally: 0.046 – 0.074 USDT if altcoin momentum accelerates. 3. Additional Bullish Signals Positive RSI divergence. Strong breakout volume. Large bullish weekly candle (Marubozu / small wick). --- 🔴 Bearish Scenario 1. Support Breakdown Weekly close below 0.0047 USDT = invalidation of the accumulation base. This could trigger continuation to 0.0041 or lower, an uncharted area on this chart. 2. False Breakout (Bull Trap) Price spikes above 0.0094 but fails to hold, falling back inside the box → trapping FOMO buyers. Often followed by a sharp sell-off back to the base zone. 3. Bearish Confirmation Increased selling volume at support. Strong rejection candle with long upper wicks. --- 📌 Market Structure & Pattern Macro: still bearish (lower highs from historical top). Micro: sideways accumulation at support. Pattern: classic base accumulation (early Wyckoff-like stage). If breakout confirms, this can flip into a major reversal setup. --- 🎯 Trading Strategy Conservative (Low Risk) Wait for weekly close above 0.0094. Enter on successful retest. SL: below 0.007 or retest low. TP: 0.0113 – 0.0177, partial exits on each resistance. Aggressive (High Risk) Scale-in inside 0.0047 – 0.0074. SL: tight below 0.0047. Huge R:R potential if breakout validates. Risk Management Limit risk to 1–3% of capital. Take profits in layers. Use trailing stops once price moves in favor. --- 📝 Conclusion This support zone is the ultimate decision point for QI. A breakout with volume = start of a strong bullish reversal. A breakdown below 0.0047 = bearish continuation with no strong support below. Patience is key — weekly close + volume confirmation are the signals to watch. --- #QI #QIUSDT #Crypto #Altcoin #TechnicalAnalysis #SupportResistance #Accumulation #BreakoutOrBreakdown #SwingTrading #WeeklyChart

behdark
QI Looks Super Bullish (3D)
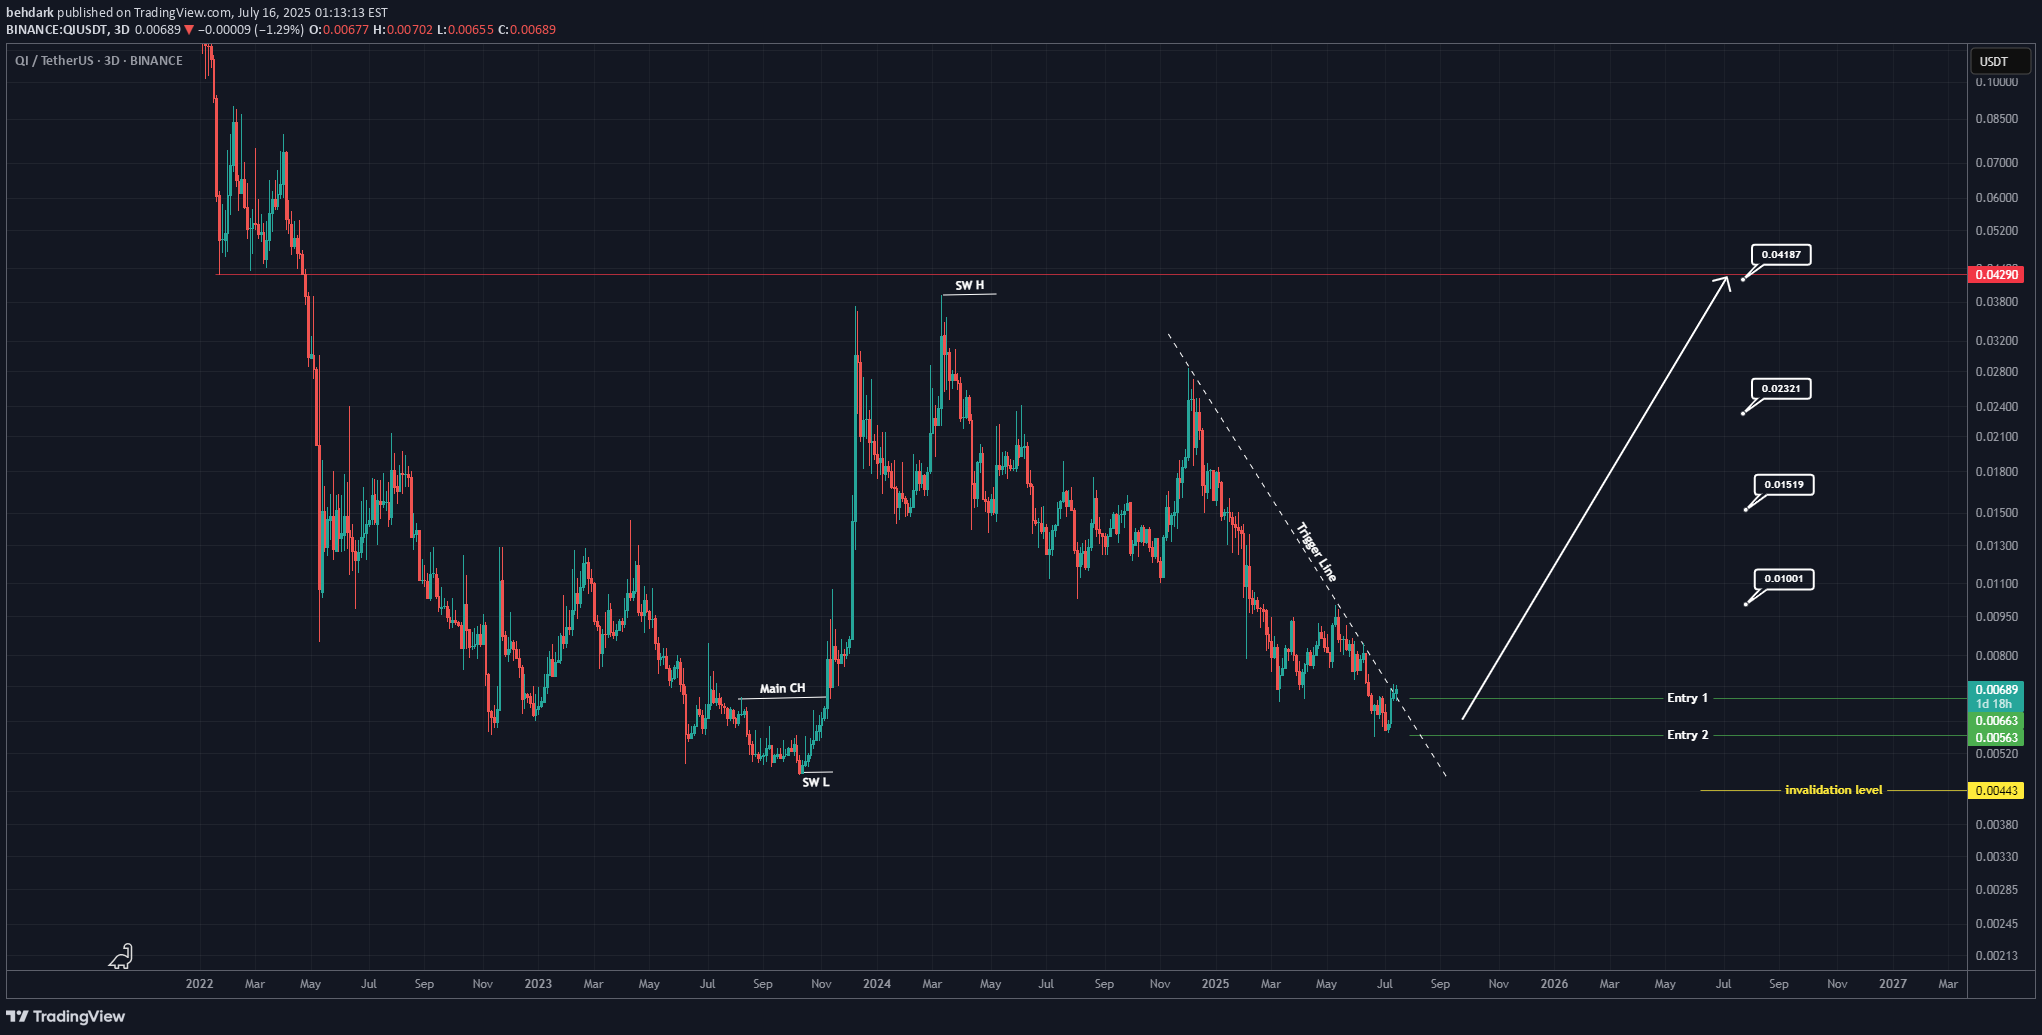
The price has reached a significant zone on the higher timeframes and has failed to create a lower low. Additionally, a major Change of Character (CH) has formed on the chart. There are signs indicating that the price is attempting to form a double bottom on the higher timeframes. We have identified two entry points for taking a spot position. The closure of a daily candle below the invalidation level will invalidate this analysis. For risk management, please don't forget stop loss and capital management When we reach the first target, save some profit and then change the stop to entry Comment if you have any questions Thank YouAfter hitting our Entry 1, it pumped over 81% and our first target was reached

ADmytrenko2
Potential 30% move in QIUSD

As can be seen, there is a double bottom that has formed in QIUSD. Also, Data Distribution has shown that the crypto coin is too overextended to the downside which means that it is primed for a reversal. Zero-Lag USI has shown the change of background to green which shows that it is time to enter.With BTC primed for a reversal, it looks like this did not make it to 30%, although was close to it. But we close the position with 22% gains.

sakicasignals
BenQI Bullishflag

READ CAREFULY PLEASE! as i checked BENQI formed bullishflag and in timeframe 1W so it can be about 2-3 weeks to blowup you guys have stoploss and everything in chart and i just opened my long

UmutTrades
QIUSDT – MASSIVE %284 VOLUME SPIKE!

🔥 Key Level Alert: The blue box is a huge resistance zone—we are at a critical decision point. Blind entries = bad trades. Smart entries = profits.📊 How I’m Approaching This:✅ Volume Surge = Increased Interest – But where is price heading?✅ Blue Box = Key Resistance – If we reject, I’ll look for LTF breakdowns + CDV confirmations to short.✅ Break & Retest? If we push above with volume and confirm on the retest, I’ll flip long instead.💡 Trading Like a Pro:I never insist on a short just because it "looks high." If the price breaks up with momentum, I adjust my bias and ride the trend. Flexibility is what separates winners from losers.🚀 Follow for next-level, no-nonsense trading insights. The market moves, I move smarter. 🔥I keep my charts clean and simple because I believe clarity leads to better decisions.My approach is built on years of experience and a solid track record. I don’t claim to know it all, but I’m confident in my ability to spot high-probability setups.If you would like to learn how to use the heatmap, cumulative volume delta and volume footprint techniques that I use below to determine very accurate demand regions, you can send me a private message. I help anyone who wants it completely free of charge.I have a long list of my proven technique below:🎯 ZENUSDT.P: Patience & Profitability | %230 Reaction from the Sniper Entry🐶 DOGEUSDT.P: Next Move🎨 RENDERUSDT.P: Opportunity of the Month💎 ETHUSDT.P: Where to Retrace🟢 BNBUSDT.P: Potential Surge📊 BTC Dominance: Reaction Zone🌊 WAVESUSDT.P: Demand Zone Potential🟣 UNIUSDT.P: Long-Term Trade🔵 XRPUSDT.P: Entry Zones🔗 LINKUSDT.P: Follow The River📈 BTCUSDT.P: Two Key Demand Zones🟩 POLUSDT: Bullish Momentum🌟 PENDLEUSDT.P: Where Opportunity Meets Precision🔥 BTCUSDT.P: Liquidation of Highly Leveraged Longs🌊 SOLUSDT.P: SOL's Dip - Your Opportunity🐸 1000PEPEUSDT.P: Prime Bounce Zone Unlocked🚀 ETHUSDT.P: Set to Explode - Don't Miss This Game Changer🤖 IQUSDT: Smart Plan⚡️ PONDUSDT: A Trade Not Taken Is Better Than a Losing One💼 STMXUSDT: 2 Buying Areas🐢 TURBOUSDT: Buy Zones and Buyer Presence🌍 ICPUSDT.P: Massive Upside Potential | Check the Trade Update For Seeing Results🟠 IDEXUSDT: Spot Buy Area | %26 Profit if You Trade with MSB 📌 USUALUSDT: Buyers Are Active + %70 Profit in Total🌟 FORTHUSDT: Sniper Entry +%26 Reaction🐳 QKCUSDT: Sniper Entry +%57 Reaction📊 BTC.D: Retest of Key Area Highly Likely*📊 XNOUSDT %80 Reaction with a Simple Blue Box!I stopped adding to the list because it's kinda tiring to add 5-10 charts in every move but you can check my profile and see that it goes on..

Crypto_alphabit
#QI (SPOT) IN( 0.01400- 0.01820) T.(0.13500) SL(0.01318)

QIUSDT #QI / USDTEntry( 0.01400- 0.01820)SL 1D close below 0.01318T1 0.03700T2 0.06300T3 0.09900T4 0.135001 Extra Targets(optional) in chart, if you like to continue in the trade with making stoploss very high.______________________________________________________________Golden Advices.********************* collect the coin slowly in the entry range.* Please calculate your losses before the entry.* Do not enter any trade you find it not suitable for you.* No FOMO - No Rush , it is a long journey.Useful Tags.****************My total poststradingview.com/ideas/crypto_alphabit/**********************************************************************************************#Manta #OMNI #DYM #AI #IO #XAI #ACE #NFP #RAD #WLD #ORDI #BLUR #SUI #VOXEL #AEVO #VITE #APE #RDNT #FLUX #NMR #VANRY #TRB #HBAR #DGB #XEC #ERN #ALT #IO #ACA #HIVE #ASTR #ARDR #PIXEL #LTO #AERGO #SCRT #ATA #HOOK #FLOW #KSM #HFT #MINA #DATA #SC #JOE #RDNT #IQ #CFX #BICO #CTSI #KMD #FXS #DEGO #FORTH #AST #PORTAL #CYBER #RIF #ENJ #ZIL #APT #GALA #STEEM #ONE #LINK #NTRN #COTI #RENDER #ICX #IMX #ALICE #PYR #PORTAL #GRT #GMT #IDEX #NEAR #ICP #ETH #QTUM #VET #QNT #API3 #BURGER #MOVR #SKL #BAND #ETHFI #SAND #IOTX #T #GTC #PDA #GMX #REZ #DUSK #BNX #SPELL #POWR #JOE #TIA #TFUEL #HOT #AVAX #WAXP #OGN #AXS #GALA #ONE #SYS #SCRT #DGB #LIT #QI

navid_aerospace
QIUSDT: %215 Volume Surge and Buyer Activity

QIUSDT: Significant Volume Surge and Buyer ActivityThere is a 215% increase in volume in QIUSDT, indicating heightened market activity. This suggests buyers are stepping into the market and adding pressure. However, given the dynamics of the market, I will focus on evaluating specific breakout opportunities.📌 Key Strategy:When the price approaches the blue box zones, these areas will serve as potential demand zones. I will closely monitor lower time frame upward breakouts from these regions to identify high-probability entries.🔑 Why the Blue Box Matters:It represents areas of increased buyer interest.Volume spikes coupled with price movements from these zones often yield strong reactions.I will remain cautious of false breakouts but will prioritize stable movements supported by volume for confirmation. Stay tuned for updates as this setup unfolds!I keep my charts clean and simple because I believe clarity leads to better decisions. My approach is built on years of experience and a solid track record. I don’t claim to know it all, but I’m confident in my ability to spot high-probability setups.My Previous Analysis🐶 DOGEUSDT.P: Next Move🎨 RENDERUSDT.P: Opportunity of the Month💎 ETHUSDT.P: Where to Retrace🟢 BNBUSDT.P: Potential Surge📊 BTC Dominance: Reaction Zone🌊 WAVESUSDT.P: Demand Zone Potential🟣 UNIUSDT.P: Long-Term Trade🔵 XRPUSDT.P: Entry Zones🔗 LINKUSDT.P: Follow The River📈 BTCUSDT.P: Two Key Demand Zones🟩 POLUSDT: Bullish Momentum🌟 PENDLEUSDT.P: Where Opportunity Meets Precision🔥 BTCUSDT.P: Liquidation of Highly Leveraged Longs🌊 SOLUSDT.P: SOL's Dip - Your Opportunity🐸 1000PEPEUSDT.P: Prime Bounce Zone Unlocked🚀 ETHUSDT.P: Set to Explode - Don't Miss This Game Changer🤖 IQUSDT: Smart Plan⚡️ PONDUSDT: A Trade Not Taken Is Better Than a Losing One💼 STMXUSDT: 2 Buying Areas🐢 TURBOUSDT: Buy Zones and Buyer Presence🌍 ICPUSDT.P: Massive Upside Potential | Check the Trade Update For Seeing Results🟠 IDEXUSDT: Spot Buy Area | %26 Profit if You Trade with MSB 📌 USUALUSDT: Buyers Are Active

CompoundingGain
$Qi

reclaim of 200 ema retest happening rsi curled up reclaim yellow line and teleport targets above likely depending on how much juice it hasgot a decent bag for old times sake .. dip to white line would be a gift
Disclaimer
Any content and materials included in Sahmeto's website and official communication channels are a compilation of personal opinions and analyses and are not binding. They do not constitute any recommendation for buying, selling, entering or exiting the stock market and cryptocurrency market. Also, all news and analyses included in the website and channels are merely republished information from official and unofficial domestic and foreign sources, and it is obvious that users of the said content are responsible for following up and ensuring the authenticity and accuracy of the materials. Therefore, while disclaiming responsibility, it is declared that the responsibility for any decision-making, action, and potential profit and loss in the capital market and cryptocurrency market lies with the trader.