
UmutTrades
@t_UmutTrades

What symbols does the trader recommend buying?
Purchase History
پیام های تریدر
Filter
UmutTrades
طلا (XAUUSD): منطقه دستکاری مشخص شد، منتظر تأییدیه 4 ساعته برای خرید!

I'm still bullish on Gold. I’ve already marked the manipulation and entry zones on gold. The setup is clear — now it’s about patience. I’ll be watching the 4-hour timeframe for confirmation, ideally supported by CDV strength around my entry zone. That divergence will tell me whether the buyers are truly stepping in or if it’s just another liquidity sweep. This isn’t about guessing tops or bottoms. The structure, manipulation pattern, and CDV reaction together create the high-probability window I want. Once those align, the 4H entry will be valid — not before.
UmutTrades
BNBUSDT | Red Box as Potential Hedge Zone

On BNB, I’m watching the red box resistance carefully. If price reaches that area and CDV gives the kind of signal I’m expecting, I’ll treat it as an opportunity. Not to flip my long-term view, but to hedge existing long positions with a tactical short. That way, I protect gains while still leaving room in case the broader move continues. This isn’t a blind short. I’ll only act if CDV divergence and footprint confirm selling pressure at the red box. Without those signs, I let it go. I keep my charts clean and simple because I believe clarity leads to better decisions. My approach is built on years of experience and a solid track record. I don’t claim to know it all, but I’m confident in my ability to spot high-probability setups. If you would like to learn how to use the heatmap, cumulative volume delta and volume footprint techniques that I use below to determine very accurate demand regions, you can send me a private message. I help anyone who wants it completely free of charge. I have a long list of my proven technique below: 🎯 ZENUSDT.P: Patience & Profitability | %230 Reaction from the Sniper Entry 🐶 DOGEUSDT.P: Next Move 🎨 RENDERUSDT.P: Opportunity of the Month 💎 ETHUSDT.P: Where to Retrace 🟢 BNBUSDT.P: Potential Surge 📊 BTC Dominance: Reaction Zone 🌊 WAVESUSDT.P: Demand Zone Potential 🟣 UNIUSDT.P: Long-Term Trade 🔵 XRPUSDT.P: Entry Zones 🔗 LINKUSDT.P: Follow The River 📈 BTCUSDT.P: Two Key Demand Zones 🟩 POLUSDT: Bullish Momentum 🌟 PENDLEUSDT.P: Where Opportunity Meets Precision 🔥 BTCUSDT.P: Liquidation of Highly Leveraged Longs 🌊 SOLUSDT.P: SOL's Dip - Your Opportunity 🐸 1000PEPEUSDT.P: Prime Bounce Zone Unlocked 🚀 ETHUSDT.P: Set to Explode - Don't Miss This Game Changer 🤖 IQUSDT: Smart Plan ⚡️ PONDUSDT: A Trade Not Taken Is Better Than a Losing One 💼 STMXUSDT: 2 Buying Areas 🐢 TURBOUSDT: Buy Zones and Buyer Presence 🌍 ICPUSDT.P: Massive Upside Potential | Check the Trade Update For Seeing Results 🟠 IDEXUSDT: Spot Buy Area | %26 Profit if You Trade with MSB 📌 USUALUSDT: Buyers Are Active + %70 Profit in Total 🌟 FORTHUSDT: Sniper Entry +%26 Reaction 🐳 QKCUSDT: Sniper Entry +%57 Reaction 📊 BTC.D: Retest of Key Area Highly Likely 📉 TIAUSDT : Still No Buyers, Bearish Outlook 🎭 BELUSDT : Manipulation Masterclass – Buyers in Control 📈 OGNUSDT: One of Today’s Top Volume Gainers +32.44% 🛑 GMTUSDT: Resistance & Strategy ⚠️ TRXUSDT: 150% Daily Volume Spike – No Buyers Yet 🔄 AAVEUSDT: Retracement Opportunity
UmutTrades
XAUUSD | First Line of Defense

XAUUSD | Watching the First Support On XAUUSD, I see the first major support around the blue box. That’s where I’ll be paying attention as price drifts lower. When we get there, I’ll be watching the 1-hour CDV closely. A positive divergence would suggest buyers are absorbing and could set up a tactical bounce. My track record speaks for itself: the win rate of my trades is listed below. Trading with me costs nothing. You can check my profile. I keep my charts clean and simple because I believe clarity leads to better decisions. My approach is built on years of experience and a solid track record. I don’t claim to know it all, but I’m confident in my ability to spot high-probability setups. If you would like to learn how to use the heatmap, cumulative volume delta and volume footprint techniques that I use below to determine very accurate demand regions, you can send me a private message. I help anyone who wants it completely free of charge. I have a long list of my proven technique below: 🎯 ZENUSDT.P: Patience & Profitability | %230 Reaction from the Sniper Entry 🐶 DOGEUSDT.P: Next Move 🎨 RENDERUSDT.P: Opportunity of the Month 💎 ETHUSDT.P: Where to Retrace 🟢 BNBUSDT.P: Potential Surge 📊 BTC Dominance: Reaction Zone 🌊 WAVESUSDT.P: Demand Zone Potential 🟣 UNIUSDT.P: Long-Term Trade 🔵 XRPUSDT.P: Entry Zones 🔗 LINKUSDT.P: Follow The River 📈 BTCUSDT.P: Two Key Demand Zones 🟩 POLUSDT: Bullish Momentum 🌟 PENDLEUSDT.P: Where Opportunity Meets Precision 🔥 BTCUSDT.P: Liquidation of Highly Leveraged Longs 🌊 SOLUSDT.P: SOL's Dip - Your Opportunity 🐸 1000PEPEUSDT.P: Prime Bounce Zone Unlocked 🚀 ETHUSDT.P: Set to Explode - Don't Miss This Game Changer 🤖 IQUSDT: Smart Plan ⚡️ PONDUSDT: A Trade Not Taken Is Better Than a Losing One 💼 STMXUSDT: 2 Buying Areas 🐢 TURBOUSDT: Buy Zones and Buyer Presence 🌍 ICPUSDT.P: Massive Upside Potential | Check the Trade Update For Seeing Results 🟠 IDEXUSDT: Spot Buy Area | %26 Profit if You Trade with MSB 📌 USUALUSDT: Buyers Are Active + %70 Profit in Total 🌟 FORTHUSDT: Sniper Entry +%26 Reaction 🐳 QKCUSDT: Sniper Entry +%57 Reaction 📊 BTC.D: Retest of Key Area Highly Likely
UmutTrades
EDUUSDT | 1H Setup With CDV Divergence
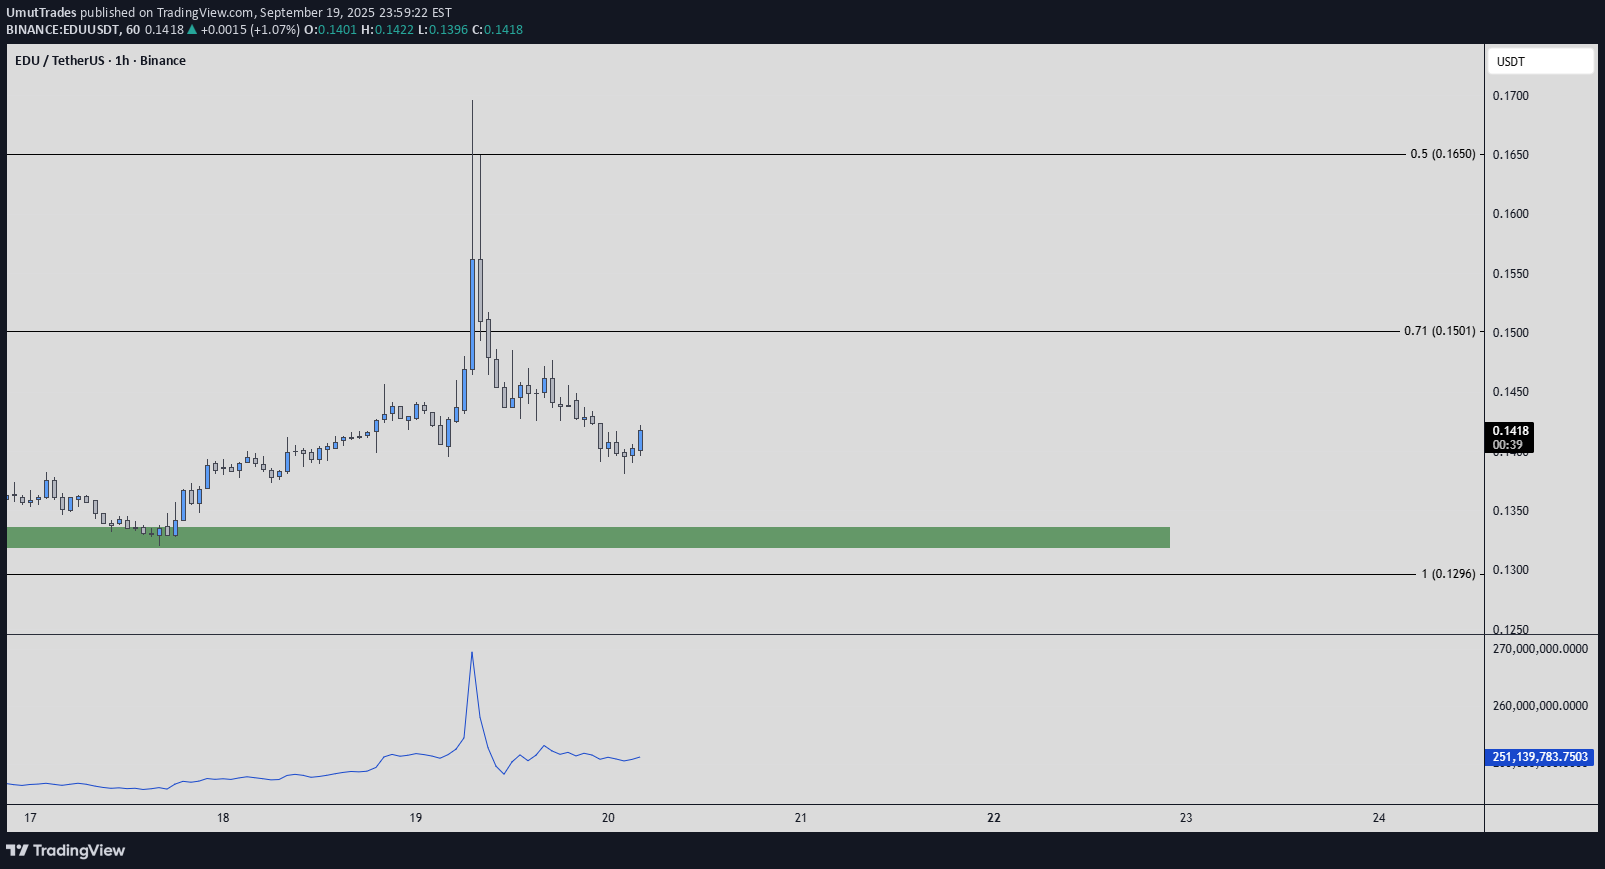
On EDUUSDT, the green box is not a bad level to try — but only with the right confirmation. I’d like to see a positive CDV divergence on the 1-hour chart before considering entry. That would suggest buyers are absorbing and quietly stepping in. Important note: this is a 1-hour analysis, which means it’s not a trend changer. At best, it’s a tactical entry with a possible 5–10% short-term reaction. The bigger trend remains intact, so I treat this only as a precise bounce setup with tight risk management. 📌I keep my charts clean and simple because I believe clarity leads to better decisions. 📌My approach is built on years of experience and a solid track record. I don’t claim to know it all but I’m confident in my ability to spot high-probability setups. 📌If you would like to learn how to use the heatmap, cumulative volume delta and volume footprint techniques that I use below to determine very accurate demand regions, you can send me a private message. I help anyone who wants it completely free of charge. 🔑I have a long list of my proven technique below: 🎯 ZENUSDT.P: Patience & Profitability | %230 Reaction from the Sniper Entry 🐶 DOGEUSDT.P: Next Move 🎨 RENDERUSDT.P: Opportunity of the Month 💎 ETHUSDT.P: Where to Retrace 🟢 BNBUSDT.P: Potential Surge 📊 BTC Dominance: Reaction Zone 🌊 WAVESUSDT.P: Demand Zone Potential 🟣 UNIUSDT.P: Long-Term Trade 🔵 XRPUSDT.P: Entry Zones 🔗 LINKUSDT.P: Follow The River 📈 BTCUSDT.P: Two Key Demand Zones 🟩 POLUSDT: Bullish Momentum 🌟 PENDLEUSDT.P: Where Opportunity Meets Precision 🔥 BTCUSDT.P: Liquidation of Highly Leveraged Longs 🌊 SOLUSDT.P: SOL's Dip - Your Opportunity 🐸 1000PEPEUSDT.P: Prime Bounce Zone Unlocked 🚀 ETHUSDT.P: Set to Explode - Don't Miss This Game Changer 🤖 IQUSDT: Smart Plan ⚡️ PONDUSDT: A Trade Not Taken Is Better Than a Losing One 💼 STMXUSDT: 2 Buying Areas 🐢 TURBOUSDT: Buy Zones and Buyer Presence 🌍 ICPUSDT.P: Massive Upside Potential | Check the Trade Update For Seeing Results 🟠 IDEXUSDT: Spot Buy Area | %26 Profit if You Trade with MSB 📌 USUALUSDT: Buyers Are Active + %70 Profit in Total 🌟 FORTHUSDT: Sniper Entry +%26 Reaction 🐳 QKCUSDT: Sniper Entry +%57 Reaction 📊 BTC.D: Retest of Key Area Highly Likely 📊 XNOUSDT %80 Reaction with a Simple Blue Box! 📊 BELUSDT Amazing %120 Reaction! 📊 Simple Red Box, Extraordinary Results 📊 TIAUSDT | Still No Buyers—Maintaining a Bearish Outlook 📊 OGNUSDT | One of Today’s Highest Volume Gainers – +32.44% 📊 TRXUSDT - I Do My Thing Again 📊 FLOKIUSDT - +%100 From Blue Box! 📊 SFP/USDT - Perfect Entry %80 Profit! I stopped adding to the list because it's kinda tiring to add 5-10 charts in every move but you can check my profile and see that it goes on..
UmutTrades
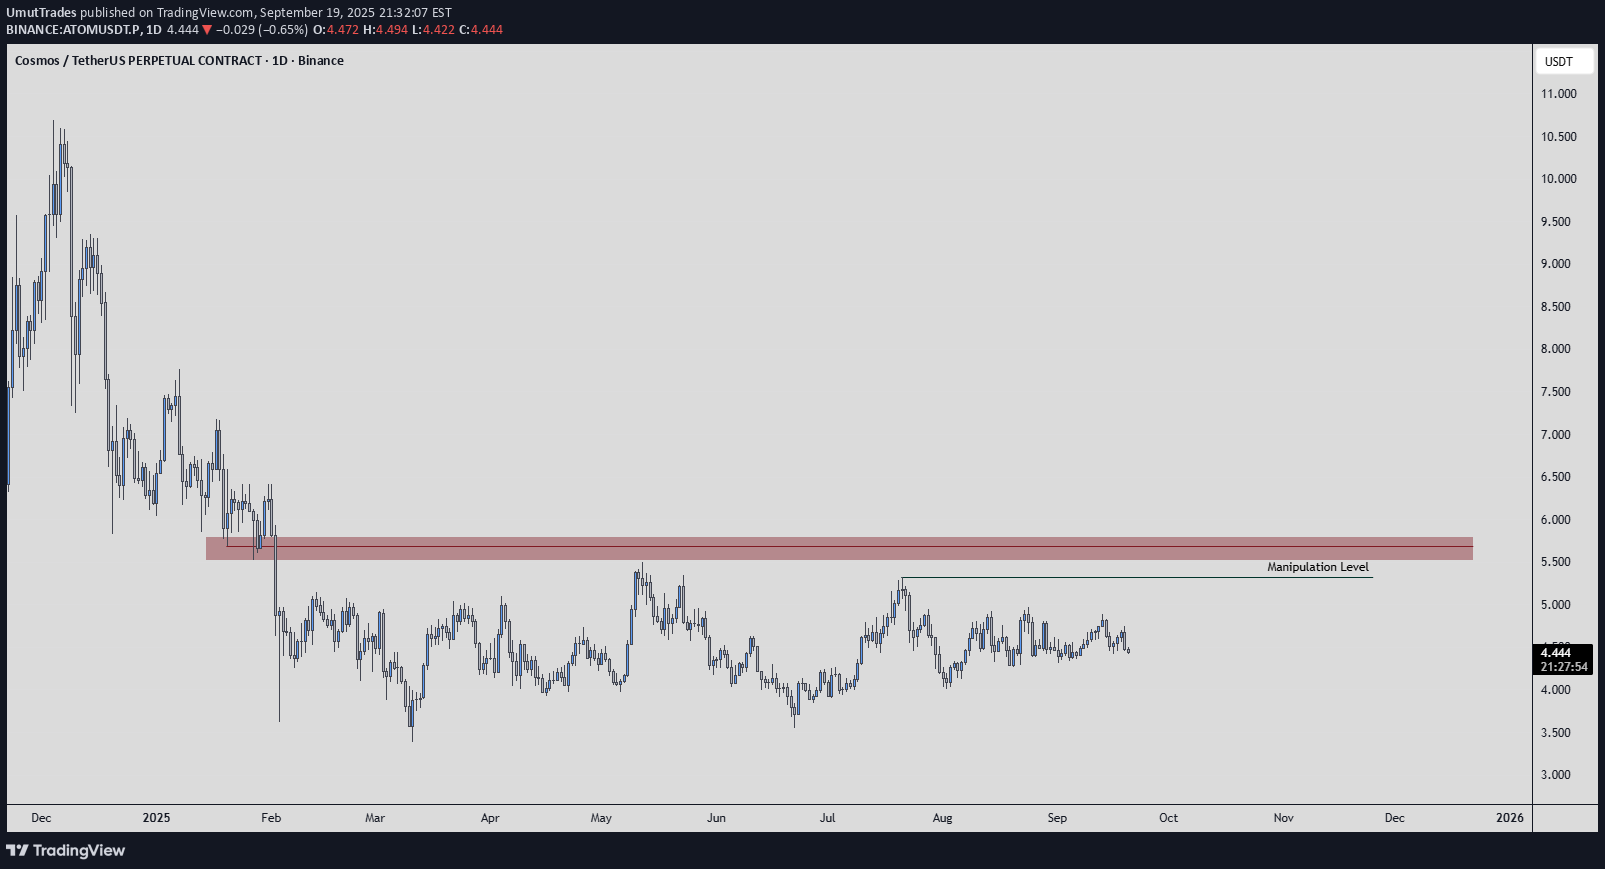
ATOMUSDT | Short From Red Box, Long-Term Setup
Resistance Zone; ATOMUSDT is facing heavy resistance at the red box, making it an attractive short entry zone. Structure shows sellers remain active here, and momentum hasn’t shifted yet. Risk Management; For risk management, I’m anchoring this setup with a stop at 7.9. That level is key a breakout and retest above it would invalidate the short idea and open the door for bullish continuation. Bias and Conditions; Until then, the bias stays short. CDV is not showing strong buyer commitment, and footprint still reflects selling pressure. As long as those conditions hold, the short idea has weight. Trade Style; This is a long-term play, not a quick scalp. Patience is required. 📌I keep my charts clean and simple because I believe clarity leads to better decisions. 📌My approach is built on years of experience and a solid track record. I don’t claim to know it all but I’m confident in my ability to spot high-probability setups. 📌If you would like to learn how to use the heatmap, cumulative volume delta and volume footprint techniques that I use below to determine very accurate demand regions, you can send me a private message. I help anyone who wants it completely free of charge. 🔑I have a long list of my proven technique below: 🎯 ZENUSDT.P: Patience & Profitability | %230 Reaction from the Sniper Entry 🐶 DOGEUSDT.P: Next Move 🎨 RENDERUSDT.P: Opportunity of the Month 💎 ETHUSDT.P: Where to Retrace 🟢 BNBUSDT.P: Potential Surge 📊 BTC Dominance: Reaction Zone 🌊 WAVESUSDT.P: Demand Zone Potential 🟣 UNIUSDT.P: Long-Term Trade 🔵 XRPUSDT.P: Entry Zones 🔗 LINKUSDT.P: Follow The River 📈 BTCUSDT.P: Two Key Demand Zones 🟩 POLUSDT: Bullish Momentum 🌟 PENDLEUSDT.P: Where Opportunity Meets Precision 🔥 BTCUSDT.P: Liquidation of Highly Leveraged Longs 🌊 SOLUSDT.P: SOL's Dip - Your Opportunity 🐸 1000PEPEUSDT.P: Prime Bounce Zone Unlocked 🚀 ETHUSDT.P: Set to Explode - Don't Miss This Game Changer 🤖 IQUSDT: Smart Plan ⚡️ PONDUSDT: A Trade Not Taken Is Better Than a Losing One 💼 STMXUSDT: 2 Buying Areas 🐢 TURBOUSDT: Buy Zones and Buyer Presence 🌍 ICPUSDT.P: Massive Upside Potential | Check the Trade Update For Seeing Results 🟠 IDEXUSDT: Spot Buy Area | %26 Profit if You Trade with MSB 📌 USUALUSDT: Buyers Are Active + %70 Profit in Total 🌟 FORTHUSDT: Sniper Entry +%26 Reaction 🐳 QKCUSDT: Sniper Entry +%57 Reaction 📊 BTC.D: Retest of Key Area Highly Likely 📊 XNOUSDT %80 Reaction with a Simple Blue Box! 📊 BELUSDT Amazing %120 Reaction! 📊 Simple Red Box, Extraordinary Results 📊 TIAUSDT | Still No Buyers—Maintaining a Bearish Outlook 📊 OGNUSDT | One of Today’s Highest Volume Gainers – +32.44% 📊 TRXUSDT - I Do My Thing Again 📊 FLOKIUSDT - +%100 From Blue Box! 📊 SFP/USDT - Perfect Entry %80 Profit! 📊 [ tradingview.com/chart/AAVEUSDT/RZ4eezbi-AAVEUSDT-Analysis-Retracement-Opportunity/]AAVEUSDT - WE DID IT AGAIN! I stopped adding to the list because it's kinda tiring to add 5-10 charts in every move but you can check my profile and see that it goes on..
UmutTrades
ATOMUSDT | Short From Red Box, Long-Term Setup
Resistance Zone ATOMUSDT is facing heavy resistance at the red box, making it an attractive short entry zone. Structure shows sellers remain active here, and momentum hasn’t shifted yet. Risk Management For risk management, I’m anchoring this setup with a stop at 7.9. That level is key — a breakout and retest above it would invalidate the short idea and open the door for bullish continuation. Bias and Conditions Until then, the bias stays short. CDV is not showing strong buyer commitment, and footprint still reflects selling pressure. As long as those conditions hold, the short idea has weight. Trade Style This is a long-term play, not a quick scalp. Patience is required. 📌I keep my charts clean and simple because I believe clarity leads to better decisions. 📌My approach is built on years of experience and a solid track record. I don’t claim to know it all but I’m confident in my ability to spot high-probability setups. 📌If you would like to learn how to use the heatmap, cumulative volume delta and volume footprint techniques that I use below to determine very accurate demand regions, you can send me a private message. I help anyone who wants it completely free of charge. 🔑I have a long list of my proven technique below: 🎯 ZENUSDT.P: Patience & Profitability | %230 Reaction from the Sniper Entry 🐶 DOGEUSDT.P: Next Move 🎨 RENDERUSDT.P: Opportunity of the Month 💎 ETHUSDT.P: Where to Retrace 🟢 BNBUSDT.P: Potential Surge 📊 BTC Dominance: Reaction Zone 🌊 WAVESUSDT.P: Demand Zone Potential 🟣 UNIUSDT.P: Long-Term Trade 🔵 XRPUSDT.P: Entry Zones 🔗 LINKUSDT.P: Follow The River 📈 BTCUSDT.P: Two Key Demand Zones 🟩 POLUSDT: Bullish Momentum 🌟 PENDLEUSDT.P: Where Opportunity Meets Precision 🔥 BTCUSDT.P: Liquidation of Highly Leveraged Longs 🌊 SOLUSDT.P: SOL's Dip - Your Opportunity 🐸 1000PEPEUSDT.P: Prime Bounce Zone Unlocked 🚀 ETHUSDT.P: Set to Explode - Don't Miss This Game Changer 🤖 IQUSDT: Smart Plan ⚡️ PONDUSDT: A Trade Not Taken Is Better Than a Losing One 💼 STMXUSDT: 2 Buying Areas 🐢 TURBOUSDT: Buy Zones and Buyer Presence 🌍 ICPUSDT.P: Massive Upside Potential | Check the Trade Update For Seeing Results 🟠 IDEXUSDT: Spot Buy Area | %26 Profit if You Trade with MSB 📌 USUALUSDT: Buyers Are Active + %70 Profit in Total 🌟 FORTHUSDT: Sniper Entry +%26 Reaction 🐳 QKCUSDT: Sniper Entry +%57 Reaction 📊 BTC.D: Retest of Key Area Highly Likely 📊 XNOUSDT %80 Reaction with a Simple Blue Box! 📊 BELUSDT Amazing %120 Reaction! 📊 Simple Red Box, Extraordinary Results 📊 TIAUSDT | Still No Buyers—Maintaining a Bearish Outlook 📊 OGNUSDT | One of Today’s Highest Volume Gainers – +32.44% 📊 TRXUSDT - I Do My Thing Again 📊 FLOKIUSDT - +%100 From Blue Box! 📊 SFP/USDT - Perfect Entry %80 Profit! 📊 [ tradingview.com/chart/AAVEUSDT/RZ4eezbi-AAVEUSDT-Analysis-Retracement-Opportunity/]AAVEUSDT - WE DID IT AGAIN! I stopped adding to the list because it's kinda tiring to add 5-10 charts in every move but you can check my profile and see that it goes on..
UmutTrades
TURBOUSDT | Green Box as Entry Zone
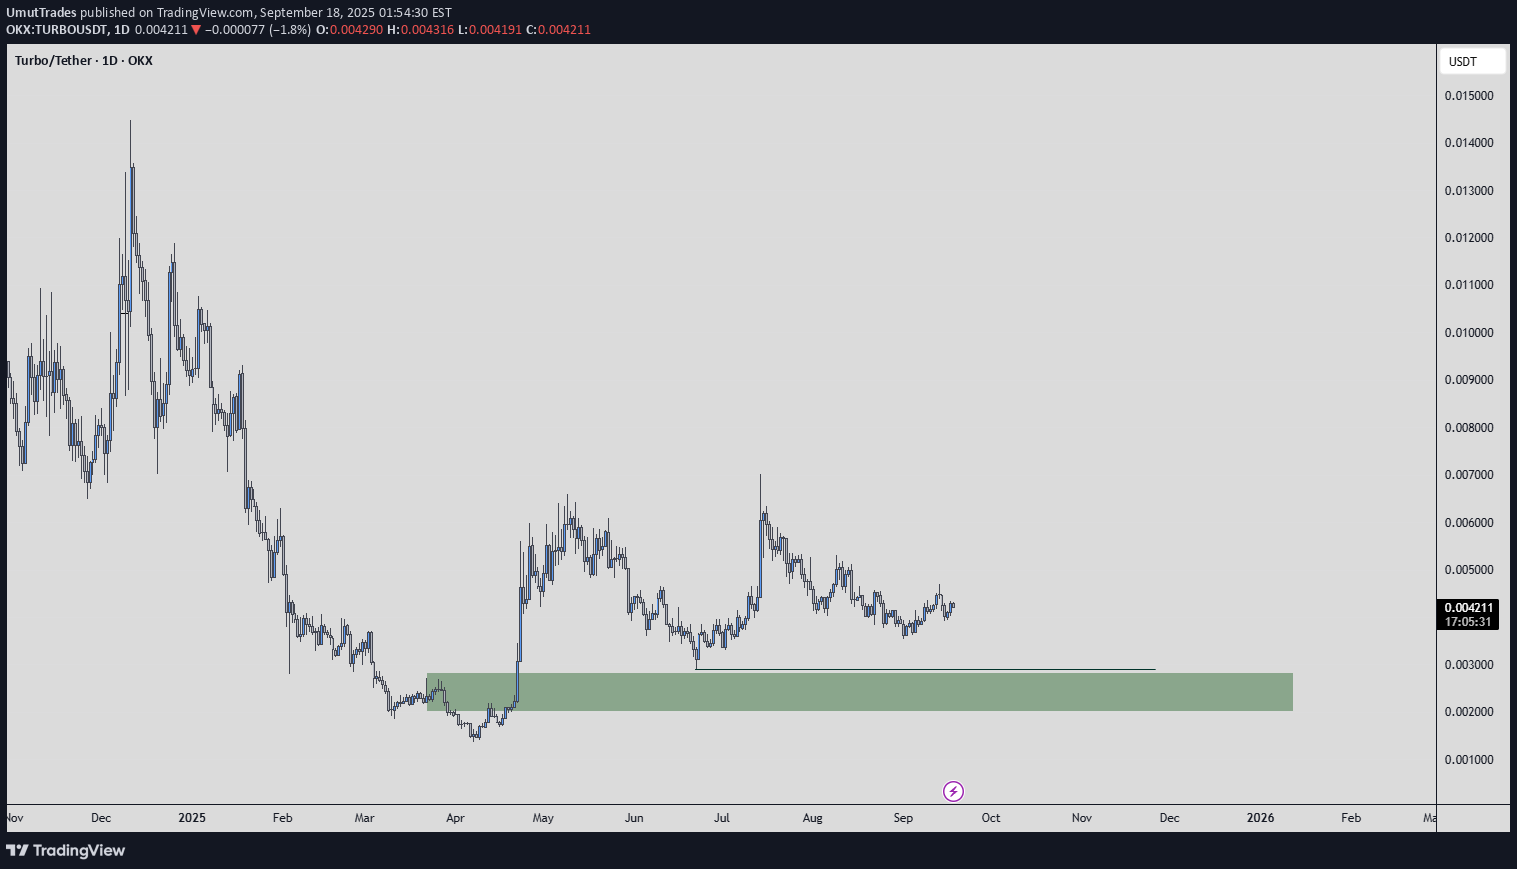
On TURBOUSDT, the green box marks a clean demand zone. Buyers have shown activity here before, and the structure suggests it can still offer solid entries. For confirmation, I’ll be watching: CDV holding steady or curling up Footprint absorption around the zone Low timeframe breakout to trigger momentum This is not about chasing, it’s about letting the market come to you. If the reaction is strong, a short-term bounce from this area is very possible. 📌I keep my charts clean and simple because I believe clarity leads to better decisions. 📌My approach is built on years of experience and a solid track record. I don’t claim to know it all but I’m confident in my ability to spot high-probability setups. 📌If you would like to learn how to use the heatmap, cumulative volume delta and volume footprint techniques that I use below to determine very accurate demand regions, you can send me a private message. I help anyone who wants it completely free of charge. 🔑I have a long list of my proven technique below: 🎯 ZENUSDT.P: Patience & Profitability | %230 Reaction from the Sniper Entry 🐶 DOGEUSDT.P: Next Move 🎨 RENDERUSDT.P: Opportunity of the Month 💎 ETHUSDT.P: Where to Retrace 🟢 BNBUSDT.P: Potential Surge 📊 BTC Dominance: Reaction Zone 🌊 WAVESUSDT.P: Demand Zone Potential 🟣 UNIUSDT.P: Long-Term Trade 🔵 XRPUSDT.P: Entry Zones 🔗 LINKUSDT.P: Follow The River 📈 BTCUSDT.P: Two Key Demand Zones 🟩 POLUSDT: Bullish Momentum 🌟 PENDLEUSDT.P: Where Opportunity Meets Precision 🔥 BTCUSDT.P: Liquidation of Highly Leveraged Longs 🌊 SOLUSDT.P: SOL's Dip - Your Opportunity 🐸 1000PEPEUSDT.P: Prime Bounce Zone Unlocked 🚀 ETHUSDT.P: Set to Explode - Don't Miss This Game Changer 🤖 IQUSDT: Smart Plan ⚡️ PONDUSDT: A Trade Not Taken Is Better Than a Losing One 💼 STMXUSDT: 2 Buying Areas 🐢 TURBOUSDT: Buy Zones and Buyer Presence 🌍 ICPUSDT.P: Massive Upside Potential | Check the Trade Update For Seeing Results 🟠 IDEXUSDT: Spot Buy Area | %26 Profit if You Trade with MSB 📌 USUALUSDT: Buyers Are Active + %70 Profit in Total 🌟 FORTHUSDT: Sniper Entry +%26 Reaction 🐳 QKCUSDT: Sniper Entry +%57 Reaction 📊 BTC.D: Retest of Key Area Highly Likely 📊 XNOUSDT %80 Reaction with a Simple Blue Box! 📊 BELUSDT Amazing %120 Reaction! 📊 Simple Red Box, Extraordinary Results 📊 TIAUSDT | Still No Buyers—Maintaining a Bearish Outlook 📊 OGNUSDT | One of Today’s Highest Volume Gainers – +32.44% 📊 TRXUSDT - I Do My Thing Again 📊 FLOKIUSDT - +%100 From Blue Box! 📊 SFP/USDT - Perfect Entry %80 Profit! 📊 [ tradingview.com/chart/AAVEUSDT/RZ4eezbi-AAVEUSDT-Analysis-Retracement-Opportunity/]AAVEUSDT - WE DID IT AGAIN! I stopped adding to the list because it's kinda tiring to add 5-10 charts in every move but you can check my profile and see that it goes on..
UmutTrades
WUSDT | Green Box as Intraday Entry
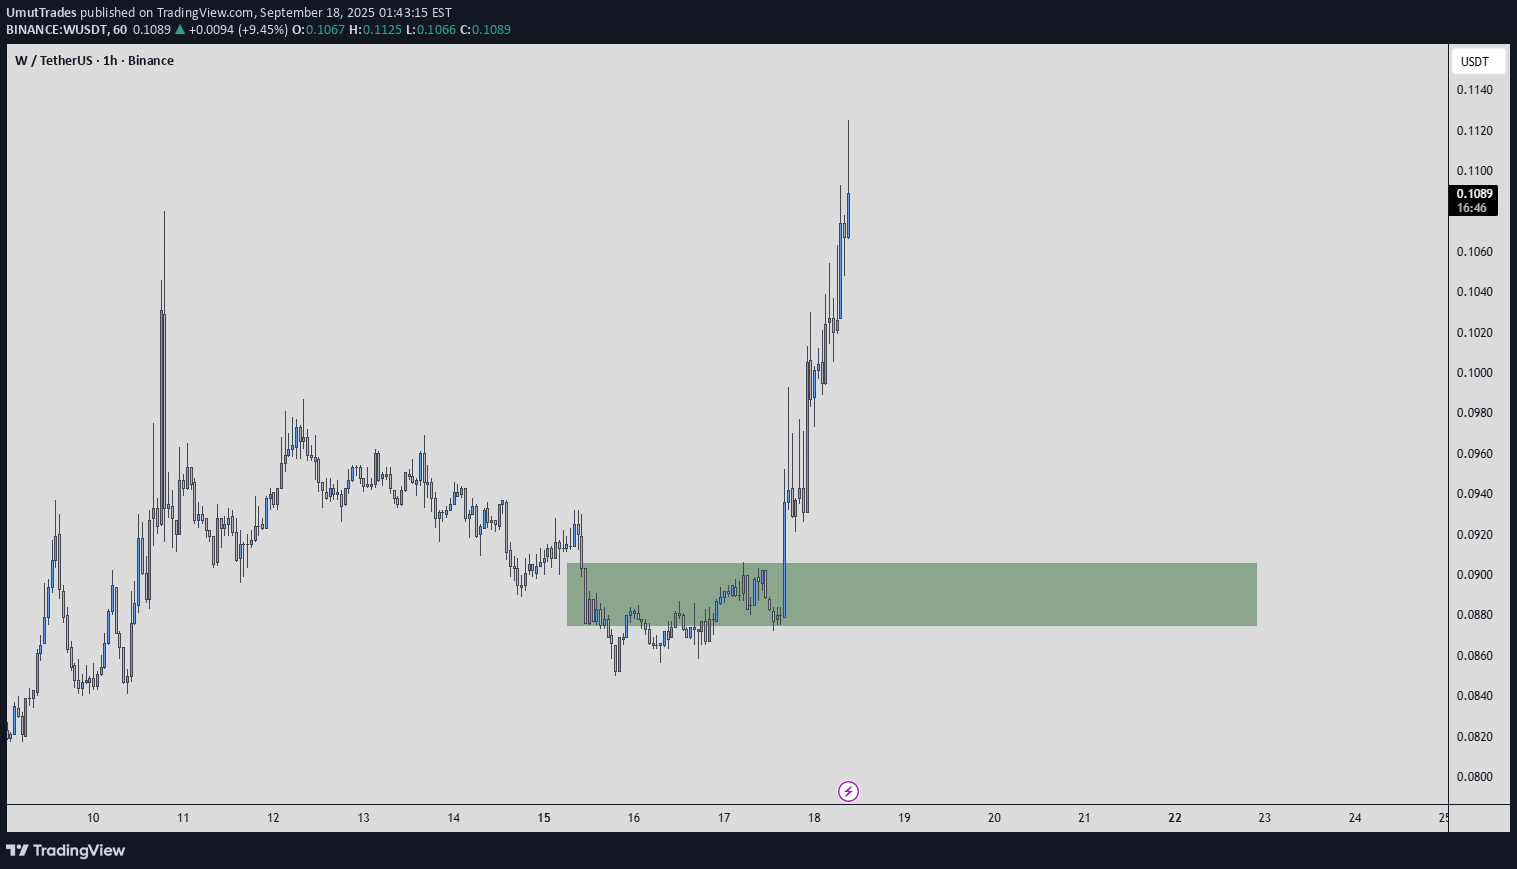
On WUSDT, the green box is a clear support zone identified on the 1-hour chart. It doesn’t shift the overall trend — but it does offer a tactical entry point. Here’s what I see: Buyers have shown activity in this area before, suggesting it can still act as demand. I expect a short-term reaction, in the range of 5–10%, if the zone holds. For conviction, I’ll be watching low timeframe breaks with CDV divergence and a touch of footprint absorption inside the zone. This is not a trend reversal signal, just a high-probability bounce setup for traders with tight risk management. 📌I keep my charts clean and simple because I believe clarity leads to better decisions. 📌My approach is built on years of experience and a solid track record. I don’t claim to know it all but I’m confident in my ability to spot high-probability setups. 📌If you would like to learn how to use the heatmap, cumulative volume delta and volume footprint techniques that I use below to determine very accurate demand regions, you can send me a private message. I help anyone who wants it completely free of charge. 🔑I have a long list of my proven technique below: 🎯 ZENUSDT.P: Patience & Profitability | %230 Reaction from the Sniper Entry 🐶 DOGEUSDT.P: Next Move 🎨 RENDERUSDT.P: Opportunity of the Month 💎 ETHUSDT.P: Where to Retrace 🟢 BNBUSDT.P: Potential Surge 📊 BTC Dominance: Reaction Zone 🌊 WAVESUSDT.P: Demand Zone Potential 🟣 UNIUSDT.P: Long-Term Trade 🔵 XRPUSDT.P: Entry Zones 🔗 LINKUSDT.P: Follow The River 📈 BTCUSDT.P: Two Key Demand Zones 🟩 POLUSDT: Bullish Momentum 🌟 PENDLEUSDT.P: Where Opportunity Meets Precision 🔥 BTCUSDT.P: Liquidation of Highly Leveraged Longs 🌊 SOLUSDT.P: SOL's Dip - Your Opportunity 🐸 1000PEPEUSDT.P: Prime Bounce Zone Unlocked 🚀 ETHUSDT.P: Set to Explode - Don't Miss This Game Changer 🤖 IQUSDT: Smart Plan ⚡️ PONDUSDT: A Trade Not Taken Is Better Than a Losing One 💼 STMXUSDT: 2 Buying Areas 🐢 TURBOUSDT: Buy Zones and Buyer Presence 🌍 ICPUSDT.P: Massive Upside Potential | Check the Trade Update For Seeing Results 🟠 IDEXUSDT: Spot Buy Area | %26 Profit if You Trade with MSB 📌 USUALUSDT: Buyers Are Active + %70 Profit in Total 🌟 FORTHUSDT: Sniper Entry +%26 Reaction 🐳 QKCUSDT: Sniper Entry +%57 Reaction 📊 BTC.D: Retest of Key Area Highly Likely 📊 XNOUSDT %80 Reaction with a Simple Blue Box! 📊 BELUSDT Amazing %120 Reaction! 📊 Simple Red Box, Extraordinary Results 📊 TIAUSDT | Still No Buyers—Maintaining a Bearish Outlook 📊 OGNUSDT | One of Today’s Highest Volume Gainers – +32.44% 📊 TRXUSDT - I Do My Thing Again 📊 FLOKIUSDT - +%100 From Blue Box! 📊 SFP/USDT - Perfect Entry %80 Profit! 📊 [ tradingview.com/chart/AAVEUSDT/RZ4eezbi-AAVEUSDT-Analysis-Retracement-Opportunity/]AAVEUSDT - WE DID IT AGAIN! I stopped adding to the list because it's kinda tiring to add 5-10 charts in every move but you can check my profile and see that it goes on..
UmutTrades
ZKUSDT | Range Defined by Blue and Red
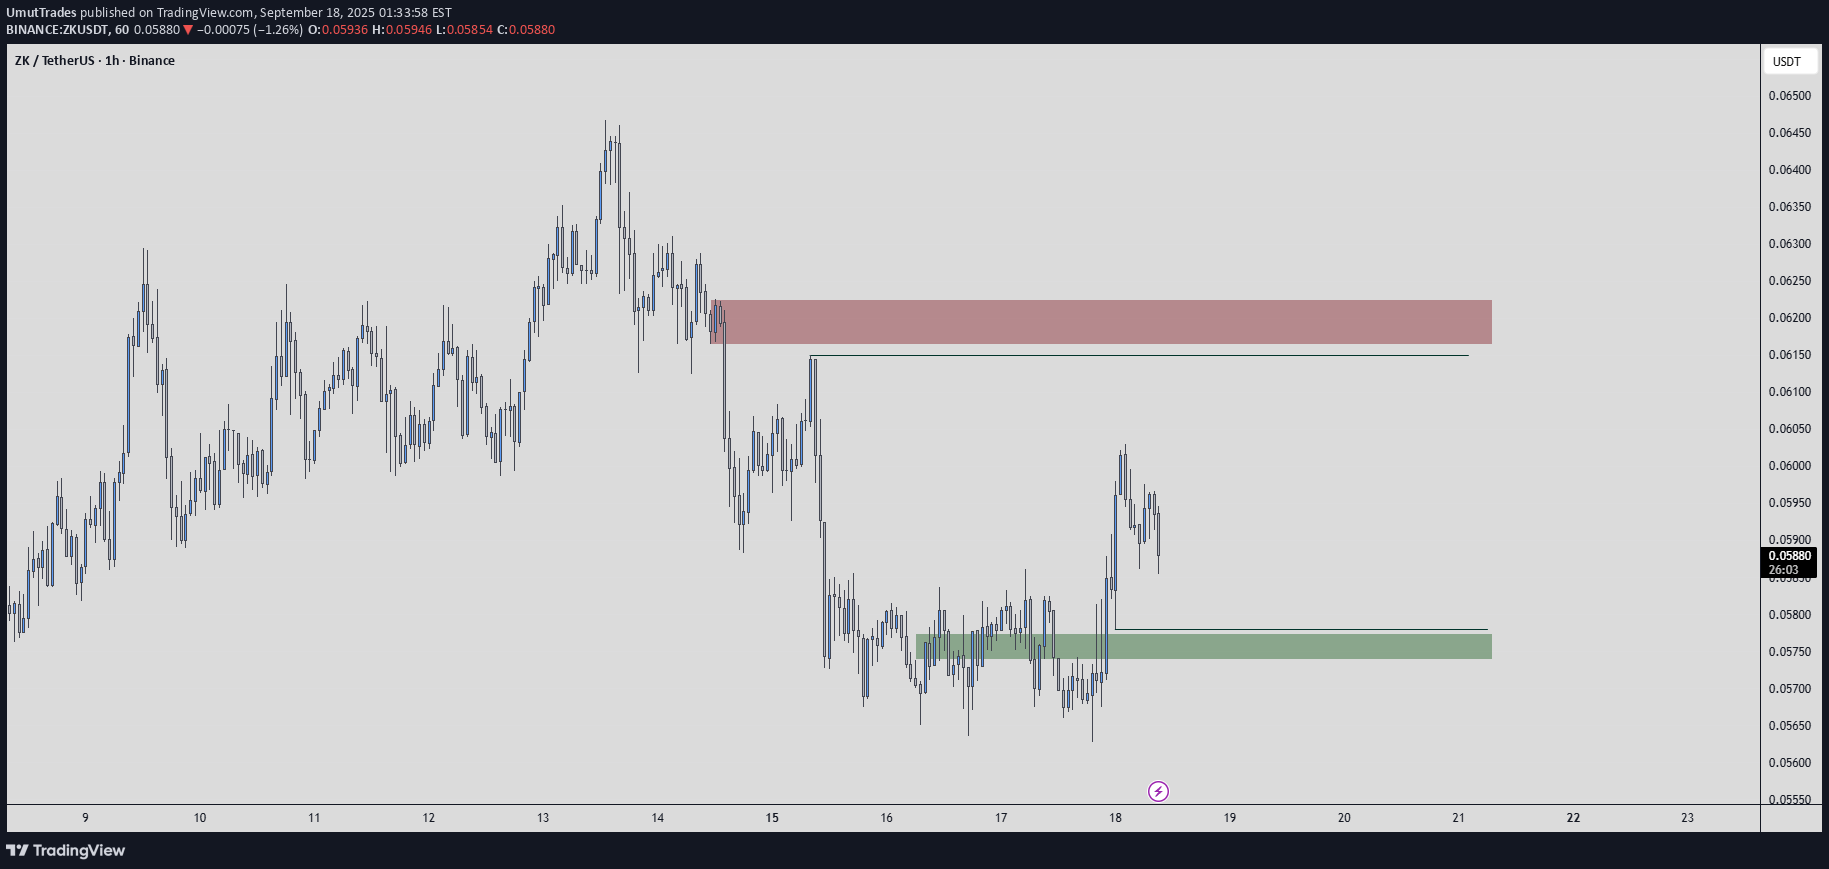
On ZKUSDT, the blue box is acting as demand support while the red box marks firm resistance. For now, the structure is capped within this range. I’m specifically watching the order flow: Volume footprint shows clear absorption inside the blue box buyers quietly stacking bids. CDV is still flat; I want to see it tilt upward before trusting the breakout. If price pushes through the red box with volume, and CDV confirms the move with positive divergence, then a retest of that level becomes a clean long setup. Until that happens, patience is the edge. Smart trades come from volume confirmation, not guessing the breakout. 📌I keep my charts clean and simple because I believe clarity leads to better decisions. 📌My approach is built on years of experience and a solid track record. I don’t claim to know it all but I’m confident in my ability to spot high-probability setups. 📌If you would like to learn how to use the heatmap, cumulative volume delta and volume footprint techniques that I use below to determine very accurate demand regions, you can send me a private message. I help anyone who wants it completely free of charge. 🔑I have a long list of my proven technique below: 🎯 ZENUSDT.P: Patience & Profitability | %230 Reaction from the Sniper Entry 🐶 DOGEUSDT.P: Next Move 🎨 RENDERUSDT.P: Opportunity of the Month 💎 ETHUSDT.P: Where to Retrace 🟢 BNBUSDT.P: Potential Surge 📊 BTC Dominance: Reaction Zone 🌊 WAVESUSDT.P: Demand Zone Potential 🟣 UNIUSDT.P: Long-Term Trade 🔵 XRPUSDT.P: Entry Zones 🔗 LINKUSDT.P: Follow The River 📈 BTCUSDT.P: Two Key Demand Zones 🟩 POLUSDT: Bullish Momentum 🌟 PENDLEUSDT.P: Where Opportunity Meets Precision 🔥 BTCUSDT.P: Liquidation of Highly Leveraged Longs 🌊 SOLUSDT.P: SOL's Dip - Your Opportunity 🐸 1000PEPEUSDT.P: Prime Bounce Zone Unlocked 🚀 ETHUSDT.P: Set to Explode - Don't Miss This Game Changer 🤖 IQUSDT: Smart Plan ⚡️ PONDUSDT: A Trade Not Taken Is Better Than a Losing One 💼 STMXUSDT: 2 Buying Areas 🐢 TURBOUSDT: Buy Zones and Buyer Presence 🌍 ICPUSDT.P: Massive Upside Potential | Check the Trade Update For Seeing Results 🟠 IDEXUSDT: Spot Buy Area | %26 Profit if You Trade with MSB 📌 USUALUSDT: Buyers Are Active + %70 Profit in Total 🌟 FORTHUSDT: Sniper Entry +%26 Reaction 🐳 QKCUSDT: Sniper Entry +%57 Reaction 📊 BTC.D: Retest of Key Area Highly Likely 📊 XNOUSDT %80 Reaction with a Simple Blue Box! 📊 BELUSDT Amazing %120 Reaction! 📊 Simple Red Box, Extraordinary Results 📊 TIAUSDT | Still No Buyers—Maintaining a Bearish Outlook 📊 OGNUSDT | One of Today’s Highest Volume Gainers – +32.44% 📊 TRXUSDT - I Do My Thing Again 📊 FLOKIUSDT - +%100 From Blue Box! 📊 SFP/USDT - Perfect Entry %80 Profit! 📊 [ tradingview.com/chart/AAVEUSDT/RZ4eezbi-AAVEUSDT-Analysis-Retracement-Opportunity/]AAVEUSDT - WE DID IT AGAIN! I stopped adding to the list because it's kinda tiring to add 5-10 charts in every move but you can check my profile and see that it goes on..
UmutTrades
COTIUSDT – One Bullet, Not All-In

The blue box looks like a solid area to risk 1R — but let’s keep our feet on the ground. This isn’t about predicting tops or bottoms. It’s about testing structure with confirmation. 🟦 A single, well-managed attempt is okay — but in case a Q3 correction kicks in, this setup could still get stopped out. So instead of going heavy on leverage, I lean toward spot entries here. Spot buys also good! All risk-on markets typically experience significant corrections in the third quarter of the year and struggle to recover from this correction until the end of the year. 🧭 Execution Flow 🔔 Alert on the blue box 🕐 Drop to 1H 📈 Look for breakout with rising CDV ✅ One controlled entry — no overexposure. 📌I keep my charts clean and simple because I believe clarity leads to better decisions. 📌My approach is built on years of experience and a solid track record. I don’t claim to know it all but I’m confident in my ability to spot high-probability setups. 📌If you would like to learn how to use the heatmap, cumulative volume delta and volume footprint techniques that I use below to determine very accurate demand regions, you can send me a private message. I help anyone who wants it completely free of charge. 🔑I have a long list of my proven technique below: 🎯 ZENUSDT.P: Patience & Profitability | %230 Reaction from the Sniper Entry 🐶 DOGEUSDT.P: Next Move 🎨 RENDERUSDT.P: Opportunity of the Month 💎 ETHUSDT.P: Where to Retrace 🟢 BNBUSDT.P: Potential Surge 📊 BTC Dominance: Reaction Zone 🌊 WAVESUSDT.P: Demand Zone Potential 🟣 UNIUSDT.P: Long-Term Trade 🔵 XRPUSDT.P: Entry Zones 🔗 LINKUSDT.P: Follow The River 📈 BTCUSDT.P: Two Key Demand Zones 🟩 POLUSDT: Bullish Momentum 🌟 PENDLEUSDT.P: Where Opportunity Meets Precision 🔥 BTCUSDT.P: Liquidation of Highly Leveraged Longs 🌊 SOLUSDT.P: SOL's Dip - Your Opportunity 🐸 1000PEPEUSDT.P: Prime Bounce Zone Unlocked 🚀 ETHUSDT.P: Set to Explode - Don't Miss This Game Changer 🤖 IQUSDT: Smart Plan ⚡️ PONDUSDT: A Trade Not Taken Is Better Than a Losing One 💼 STMXUSDT: 2 Buying Areas 🐢 TURBOUSDT: Buy Zones and Buyer Presence 🌍 ICPUSDT.P: Massive Upside Potential | Check the Trade Update For Seeing Results 🟠 IDEXUSDT: Spot Buy Area | %26 Profit if You Trade with MSB 📌 USUALUSDT: Buyers Are Active + %70 Profit in Total 🌟 FORTHUSDT: Sniper Entry +%26 Reaction 🐳 QKCUSDT: Sniper Entry +%57 Reaction 📊 BTC.D: Retest of Key Area Highly Likely 📊 XNOUSDT %80 Reaction with a Simple Blue Box! 📊 BELUSDT Amazing %120 Reaction! 📊 Simple Red Box, Extraordinary Results 📊 TIAUSDT | Still No Buyers—Maintaining a Bearish Outlook 📊 OGNUSDT | One of Today’s Highest Volume Gainers – +32.44% 📊 TRXUSDT - I Do My Thing Again 📊 FLOKIUSDT - +%100 From Blue Box! 📊 SFP/USDT - Perfect Entry %80 Profit! 📊 [ tradingview.com/chart/AAVEUSDT/RZ4eezbi-AAVEUSDT-Analysis-Retracement-Opportunity/]AAVEUSDT - WE DID IT AGAIN! I stopped adding to the list because it's kinda tiring to add 5-10 charts in every move but you can check my profile and see that it goes on..
Disclaimer
Any content and materials included in Sahmeto's website and official communication channels are a compilation of personal opinions and analyses and are not binding. They do not constitute any recommendation for buying, selling, entering or exiting the stock market and cryptocurrency market. Also, all news and analyses included in the website and channels are merely republished information from official and unofficial domestic and foreign sources, and it is obvious that users of the said content are responsible for following up and ensuring the authenticity and accuracy of the materials. Therefore, while disclaiming responsibility, it is declared that the responsibility for any decision-making, action, and potential profit and loss in the capital market and cryptocurrency market lies with the trader.