
behdark
@t_behdark

What symbols does the trader recommend buying?
Purchase History
پیام های تریدر
Filter
behdark
سناریوی صعودی اتریوم: اصلاح پیچیده در آستانه انفجار بزرگ!

📊 Ethereum (ETH) – Updated Bullish Scenario Amid Complex Correction Before anything else, pay attention to the time frame; the time frame is daily. Based on the latest available market data and the prolonged range-bound price action near the local lows, it is reasonable to restructure Ethereum’s primary scenario. While the overall bias remains bullish, both price targets and timing expectations have been adjusted to better align with the current market structure. 🔍 Market Structure & Neo Wave Perspective From the point marked by the red arrow on the chart, Ethereum entered a bearish corrective phase. However, this move does not suggest a trend reversal. Instead, it strongly resembles a complex double correction within a larger bullish structure. First correction: A clear ABC corrective pattern Second correction: A contracting triangle These two corrective structures are connected via an X wave, forming a classic W-X-Y corrective formation This type of structure is commonly observed in higher-timeframe consolidations before strong impulsive continuations. 🔺 Triangle Breakdown (A–B–C–D–E) Current price behavior suggests that Ethereum is trading inside the D wave of the corrective triangle: The slow, overlapping, and corrective upward movements strongly indicate that the market is not impulsive, confirming we are still within a correction. Price action around the red zone is likely to mark the completion of wave D. Following this, a final pullback for wave E is expected, which typically acts as a bear trap before trend continuation. 🟩 Green Zone & Bullish Continuation Scenario As price approaches the green box area, conditions may become ideal for: Completion of wave E End of the entire corrective triangle Initiation of the next impulsive bullish leg Once wave E is completed, Ethereum is expected to resume its primary bullish trend, with upside targets at: 🎯 $3,500 🎯 $3,800 These levels align with previous structural highs and Fibonacci extensions from the corrective base. ⚠️ Invalidation Level & Risk Management This bullish scenario remains valid as long as price holds above the invalidation level. A daily candle close below this level would invalidate the wave count and require a full reassessment of the market structure. 🧠 Final Thoughts Market sentiment may feel weak during wave E, but historically this is where smart money positions itself Patience is key during complex corrections The structure favors trend continuation rather than reversal 📌 As always, risk management is essential, and this analysis reflects a probabilistic scenario—not financial advice. If you have a coin or altcoin you want analyzed, first hit the like button and then comment its name so I can review it for you. This is not a trade setup, as it has no precise stop-loss, stop, or target. I do not publish my trade setups here.
behdark
بیت کوین در آستانه انفجار صعودی؟ تحلیل مثلث صعودی 12 ساعته و هدف 106,000 دلاری!

Since we marked the red arrow on the chart the price has entered a bearish phase This phase appears to be a complex correction likely a double structure as we can observe an ABC plus X wave followed by a triangle formation We are currently at the end of the second corrective wave with only one wave Wave E of this triangle remaining Once Wave E completes within the green zone the price may enter a bullish phase In this scenario the recovery will only begin after the completion of Wave E This means that all movements from the current low until now have been part of corrective action and the bearish phase Therefore we can anticipate Bitcoins recovery target to reach around 106000 dollars It is expected that the price will find support moving from the red zone toward the green zone after which stronger bullish movements could follow Targets have been clearly marked on the chart for reference Important A daily candle close below the invalidation level will negate this analysis and suggest a different market scenario If you have a coin or altcoin you want analyzed, first hit the like button and then comment its name so I can review it for you. This is not a trade setup, as it has no precise stop-loss, stop, or target. I do not publish my trade setups here.A nice reaction to the drawn red zone
behdark
SUI is on the verge of another rally (4H)

From the point where we marked the green arrow on the chart, a bullish phase has started on SUI. This area acted as a key reaction zone where buyers stepped in decisively, shifting market sentiment from corrective to bullish. Based on the current price structure, it appears that we are developing an ABC corrective pattern. In this structure, Wave B has formed as a triangle, which is a common consolidation pattern before continuation. The triangle suggests decreasing volatility and balance between buyers and sellers before the next impulsive move. At the moment, price action indicates that we are still inside Wave B, with one final sub-wave remaining wave “e” of the triangle. Once this last leg of the triangle is completed, the corrective phase should be fully exhausted. After the completion of this final wave, the market is expected to resume its bullish move in the form of Wave C, which typically unfolds as a strong impulsive rally. This next move should bring expansion in both momentum and volume compared to the corrective structure we are currently seeing. To manage risk and execution efficiently, two entry zones have been clearly marked on the chart, and positions should be built using a DCA (Dollar-Cost Averaging) approach rather than a single entry. This allows better positioning in case of short-term volatility during the end of Wave B. The projected targets for Wave C are also outlined on the chart, based on classical Elliott Wave projections and prior market structure. These levels represent logical areas where partial or full profit-taking can be considered. ⚠️ Invalidation: This analysis will be invalidated if a candle closes below the marked invalidation level. A confirmed close below that level would indicate that the current wave structure is no longer valid and that the market may be transitioning into a different scenario. As always, this setup is based on technical structure and probability, not certainty. Proper risk management is essential. If you have a coin or altcoin you want analyzed, first hit the like button and then comment its name so I can review it for you. This is not a trade setup, as it has no precise stop-loss, stop, or target. I do not publish my trade setups here.
behdark
Is Bitcoin on the verge of a bullish move? (4H)

This analysis is an update to the previous one, which you can find in the related analyses section. The previous analysis is still valid, and Wave D of this diametric pattern needs to complete. Since trading volume was low and it was the end of the year, this move has taken longer. I had marked a red line in the previous analysis, noting that as long as this line isn’t convincingly broken, the price cannot recover. In the past, every time the price approached this line, it was quickly rejected but now, after moving above this red line, it hasn’t been rejected yet. We’ve marked Bitcoin’s targets on the chart. Let’s see how it plays out. If you have a coin or altcoin you want analyzed, first hit the like button and then comment its name so I can review it for you. This is not a trade setup, as it has no precise stop-loss, stop, or target. I do not publish my trade setups here.It has reached the first target.
behdark
DOGE Bullish Structure in Play (4H)
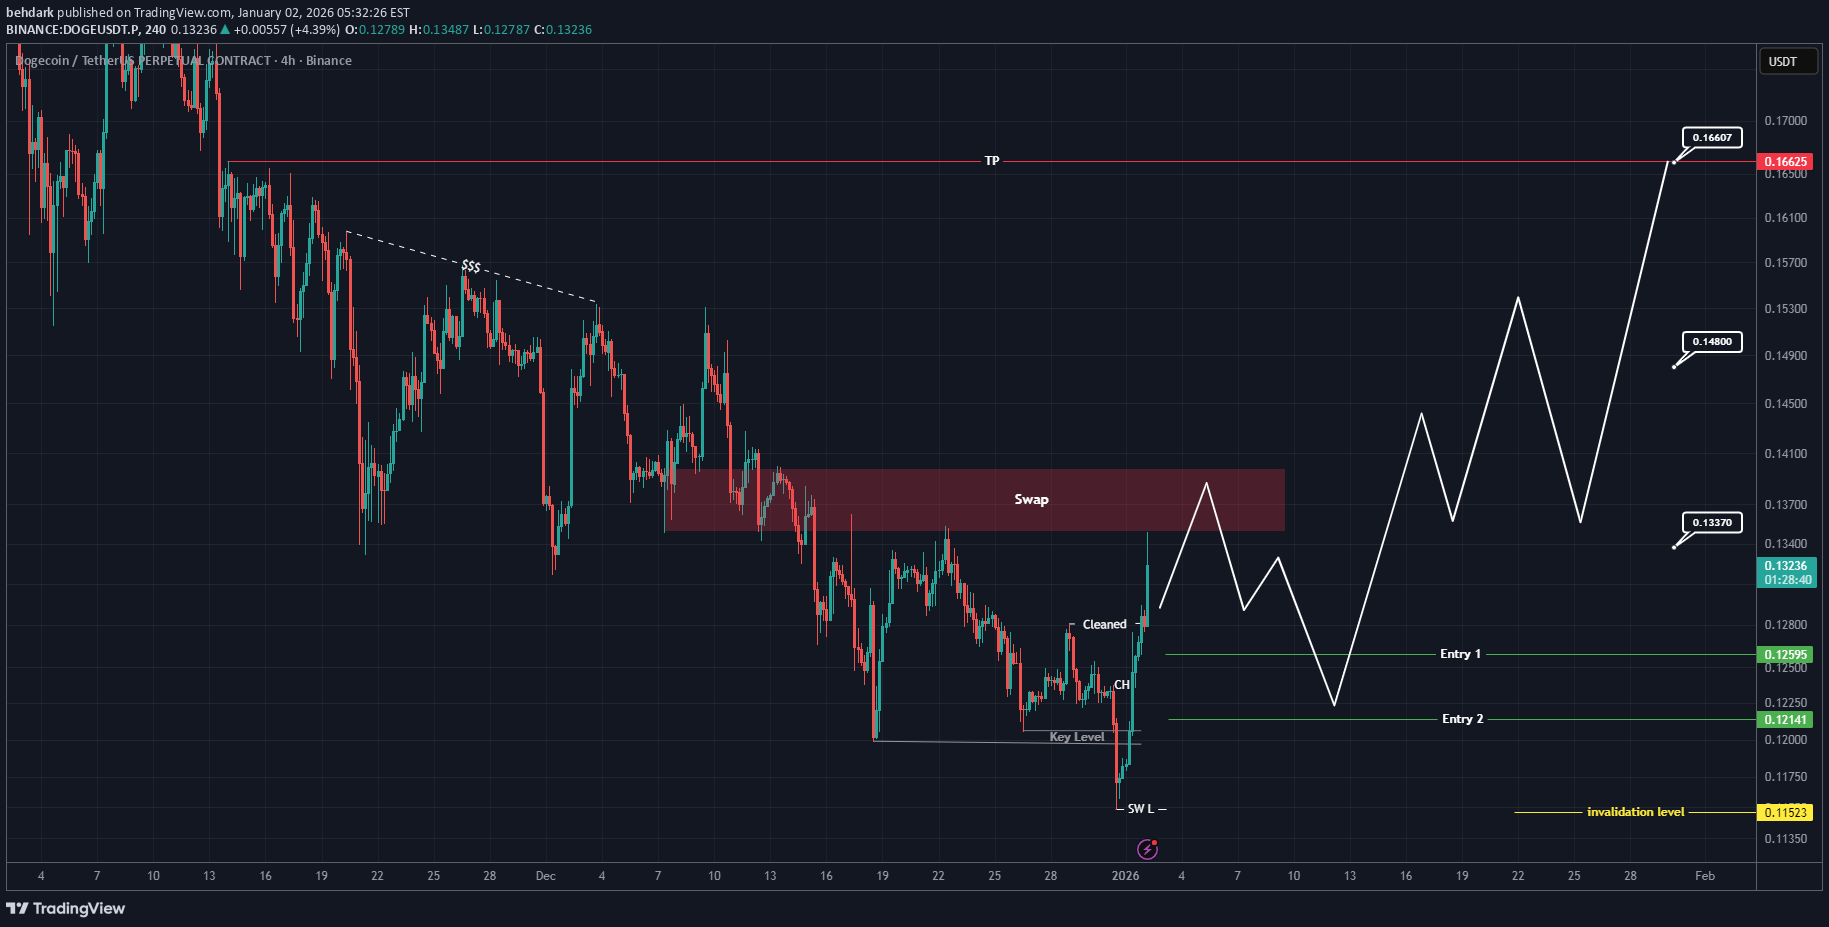
Market makers have aggressively dumped and pumped the price in sharp moves. They don’t want you to easily ride profitable waves; instead, they aim to stop you out or lure you into entering at a point where, after getting in, you’ll feel psychological pressure. The goal is to make you uncomfortable so that during the next bullish move, you exit the trade prematurely before the real bullish expansion begins due to stress or doubt. That’s why patience is essential when entering a position. You need to wait and select optimal entry zones. Even if the price moves higher and doesn’t give you a clean entry, that is still far better than chasing the market emotionally and then suffering psychological pressure afterward. You need to think more strategically. The natural behavior of candles and price action is constant movement up and down. The key is to enter positions intelligently, not emotionally. At the moment, the price is trading above key levels, and we’ve recently seen a strong bullish move with solid momentum on the chart. In addition, there is a bullish CH (Change of Character) present. Both the price structure and momentum clearly support buy/long positions. There is also a liquidity pool above the current price action, which DOGE can potentially sweep. For this reason, we are looking for buy/long opportunities around support zones. We have identified two potential entry points for buy/long positions, where we should enter using a DCA (Dollar Cost Averaging) approach directly on the chart. The targets have already been clearly marked on the chart as well. If you have a coin or altcoin you want analyzed, first hit the like button and then comment its name so I can review it for you. This is not a trade setup, as it has no precise stop-loss, stop, or target. I do not publish my trade setups here.
behdark
ZETA Looks Bullish (4H)
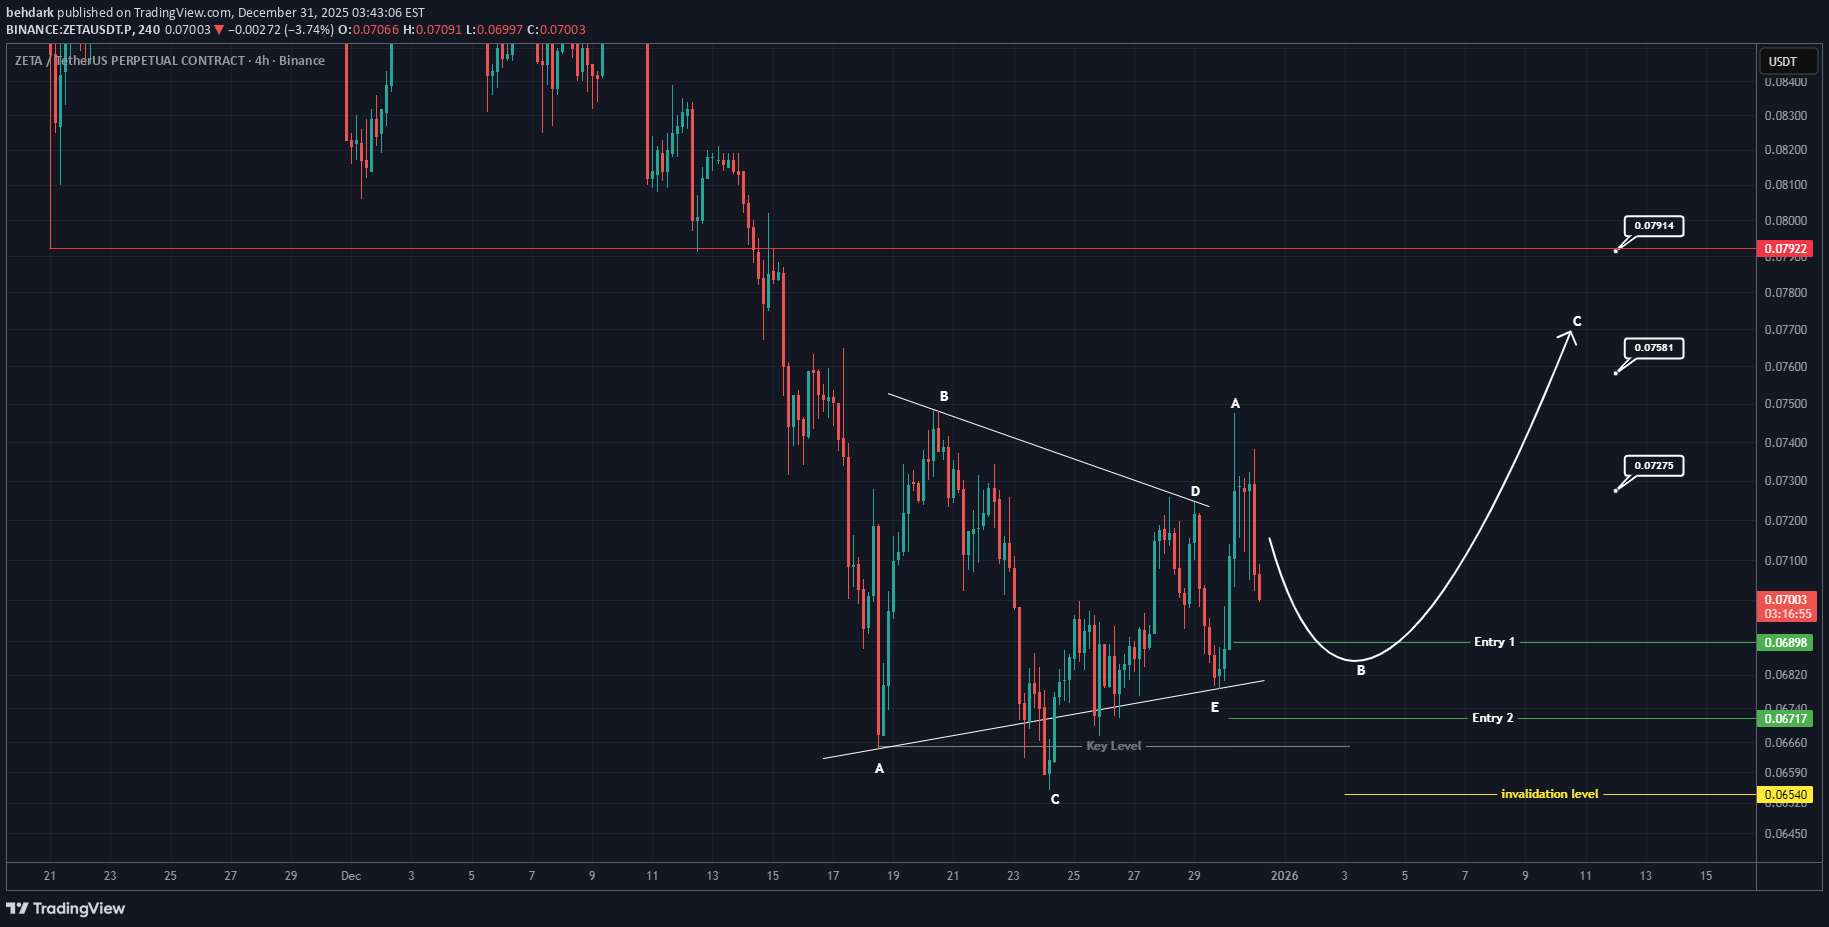
It appears that a triangle pattern has reached its completion, followed by the formation of a bullish impulse wave, which can be labeled as wave A. After this upward move, the price has entered a corrective phase, which can be considered wave B. Once wave B is completed, we expect another bullish move in the form of wave C for ZETA. This structure suggests a continuation of the overall bullish trend. The target levels have been clearly marked on the chart based on this wave structure. There are two identified entry zones, and the position should be built gradually using a DCA (Dollar-Cost Averaging) strategy. A daily candle close below the invalidation level will invalidate this outlook and cancel the bullish scenario. If you have a coin or altcoin you want analyzed, first hit the like button and then comment its name so I can review it for you. This is not a trade setup, as it has no precise stop-loss, stop, or target. I do not publish my trade setups here.The price has pumped over 10% above our average entry and has reached the first target.
behdark
TRB Analysis (4H)
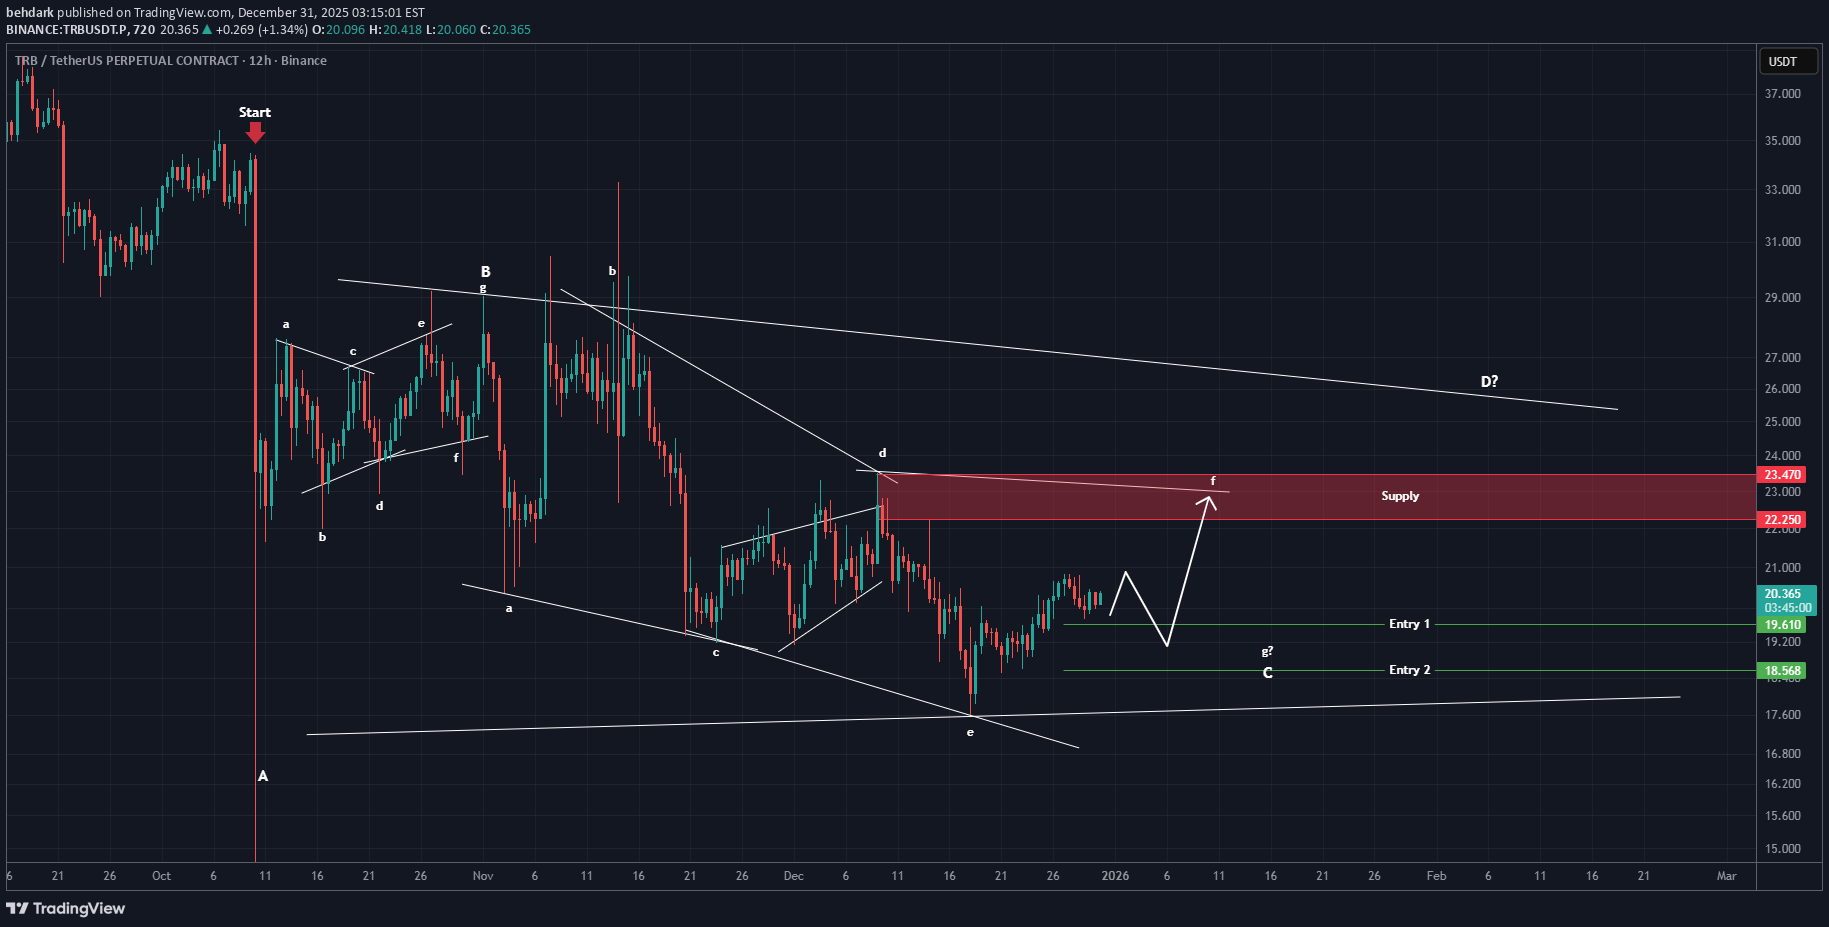
From the point where we placed the red arrow on the chart, it appears that a triangle or a more complex pattern is forming on the TRB chart. At the moment, we seem to be in wave C, which is either a diametric or a symmetrical pattern. Looking more closely, we are in wave f of wave C. We have marked two green entry points where the position should be entered using DCA. The targets have been marked on the chart. A daily candle close below the invalidation level will invalidate this analysis If you have a coin or altcoin you want analyzed, first hit the like button and then comment its name so I can review it for you. This is not a trade setup, as it has no precise stop-loss, stop, or target. I do not publish my trade setups here.
behdark
Bitcoin Setups: Smart Entry for Buy and Sell Positions (3H)
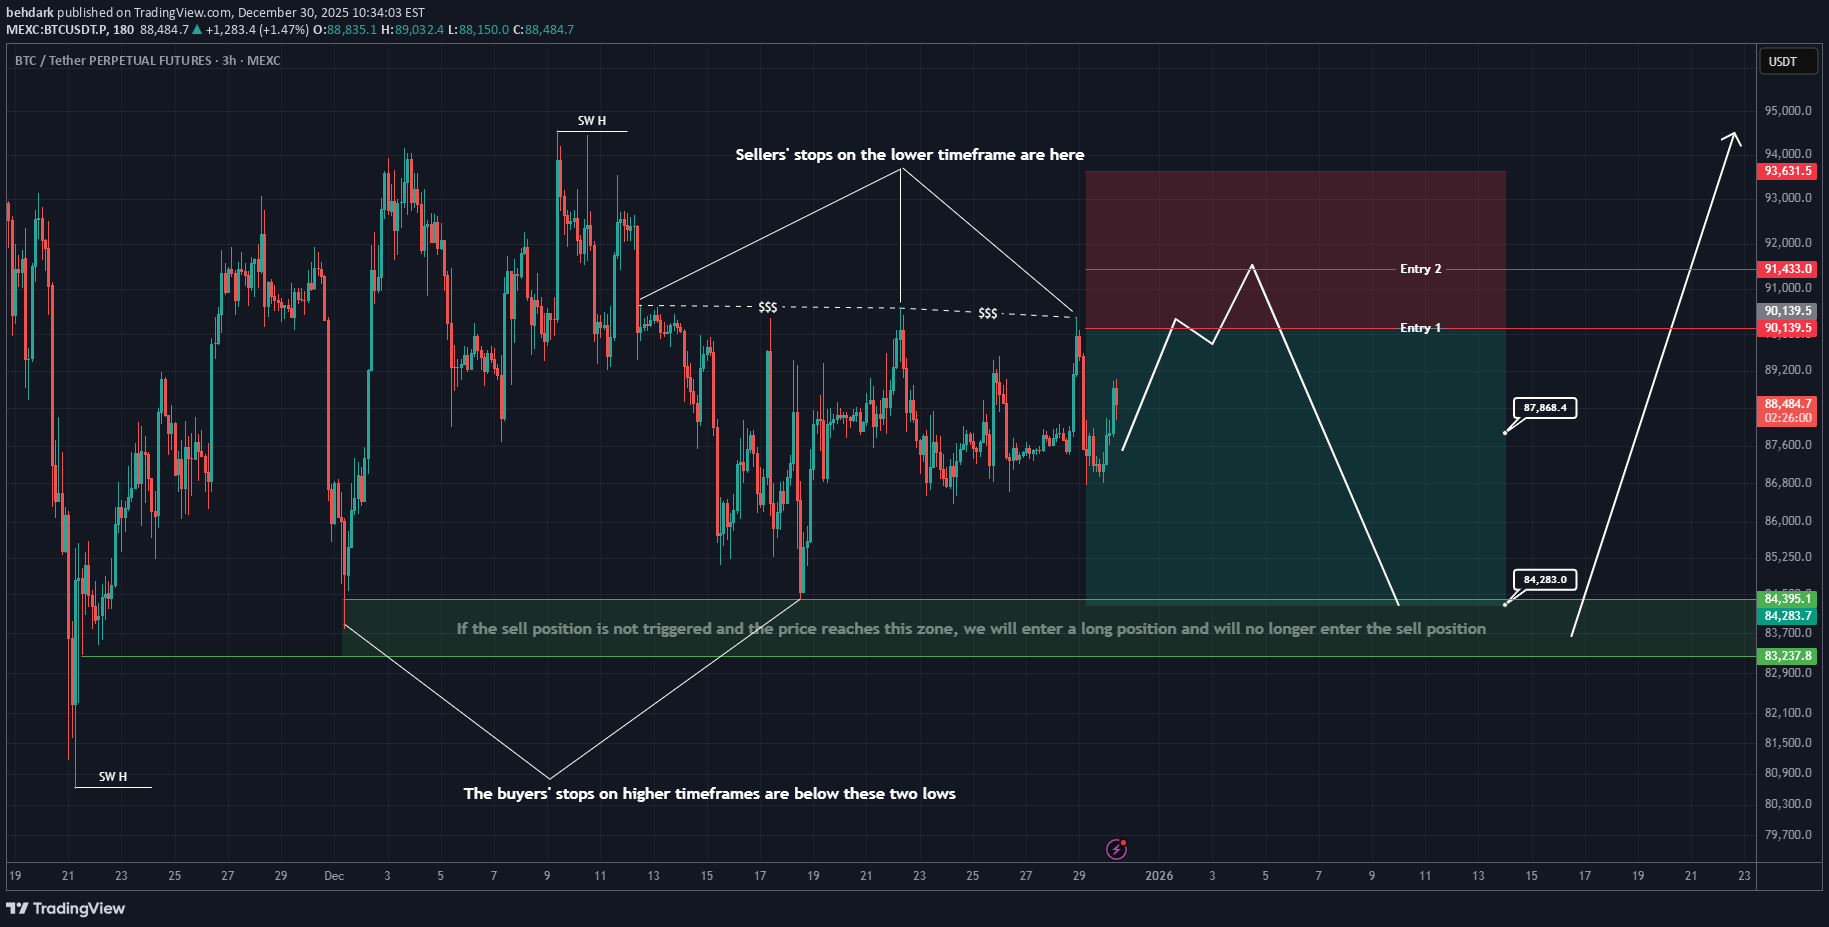
Bitcoin Market Analysis: How Market Makers Banks and Governments Manipulate Price and Capture Liquidity Market makers large financial institutions and even government entities often influence Bitcoin’s price movements to serve their own trading strategies. Their goal is to manipulate the market in a way that allows them to fill their own orders efficiently and enter positions at more favorable prices. Understanding this behavior is crucial for retail traders who want to avoid being caught on the wrong side of these movements. As we have observed Bitcoin has been consolidating for over a month moving sideways within a specific range. During this period it repeatedly hits buyers’ and sellers’ stop orders creating temporary spikes or drops before continuing its range bound movement. These price actions are often small and controlled but they are deliberate. The key question we need to ask is why is this happening The answer lies in thinking like market makers rather than retail traders. In this low volatility phase the main focus should be on identifying where liquidity resides. Market makers target areas where stop orders are clustered these are points where they can collect liquidity to fuel their next large move. On lower timeframes we’ve identified a critical stop zone between 90,154 and 91,600 dollars. This range represents a high probability area to look for sell short setups as market makers often attempt to trigger these stops to gather liquidity. Why is it unlikely for price to break significantly above this zone at this moment On higher timeframes the long stops have not yet been triggered meaning sufficient liquidity has not been collected. Banks and institutional players are still filling their orders. Until this accumulation process is complete strong bullish moves are less likely. Entering positions should always be strategic and aligned with proper risk to reward management. On our chart we’ve marked a setup that respects this principle. It is positioned where sellers’ stops are likely to be triggered allowing us to enter in alignment with market makers and institutional flows. This approach increases the probability of a successful trade while minimizing unnecessary risk. Equally important is integrating trader psychology into your analysis. Technical analysis alone is rarely enough. The majority of trading success approximately 70 to 80 percent comes from understanding market psychology not just price patterns. Recognizing how other traders are likely to react to stops liquidity pools and market maker movements is essential to staying ahead in the market. In summary successful trading in Bitcoin requires a combination of technical awareness liquidity analysis and psychological insight. Always think like the market makers anticipate where liquidity is concentrated and enter trades with calculated risk to reward setups. By doing so you can align yourself with the larger players instead of constantly reacting to their manipulations. If the price does not reach the red zone and our sell position is not triggered, and then it reaches the green zone without hitting our sell zone, we will no longer enter the sell position. In this case, we will look for a buy/long in the green zone We have two entry points for the position, allowing you to enter the sell position using DCA. There are also two targets; after hitting the first target, take some profit and move your stop to break even. If you have a coin or altcoin you want analyzed, first hit the like button and then comment its name so I can review it for you. This is not a trade setup, as it has no precise stop-loss, stop, or target. I do not publish my trade setups here.
behdark
تحلیل سوشی (4 ساعته): سیگنال صعود قوی بعد از تله خرسی! دو نقطه ورود طلایی برای موج C
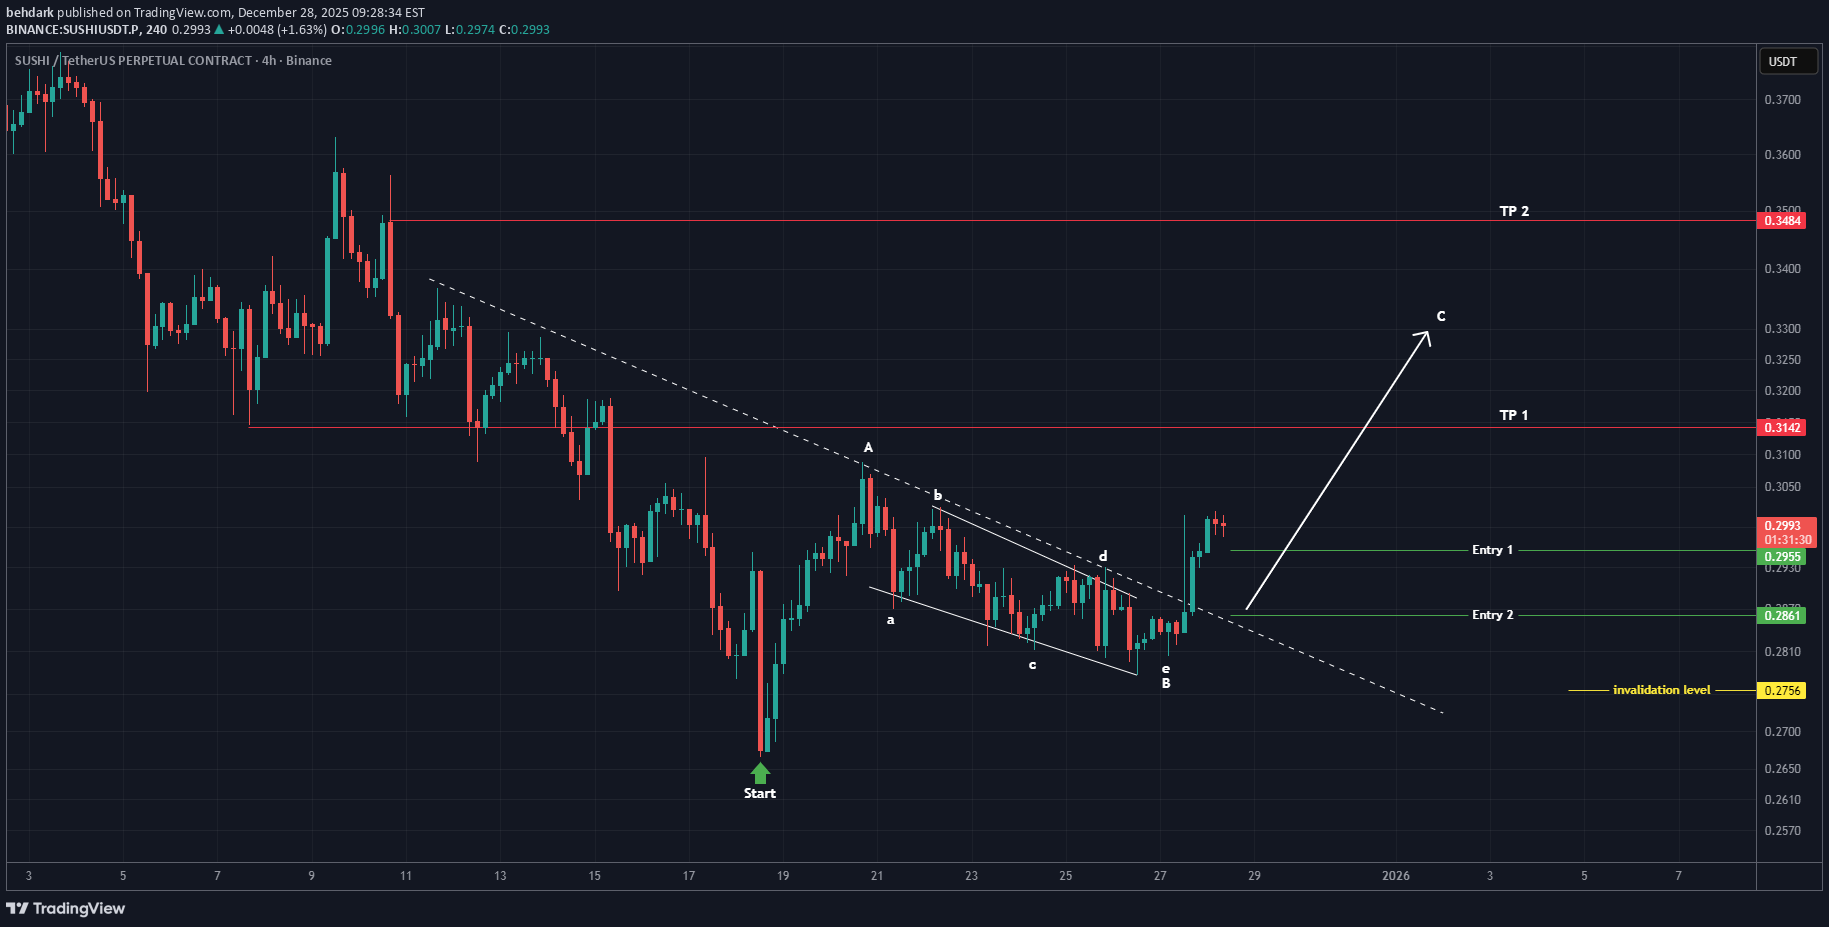
At the lowest price on the chart, if you look closely, a red candle with very strong momentum has formed, but the price quickly reversed. The origin of this candle was a bearish move, which means it was a fake move designed to collect orders. Since the origin of this candle has been engulfed, we usually see strong moves in the opposite direction of this candle. Since we placed the green arrow on the chart, a bullish phase with good momentum has started. It seems we have an ABC pattern, or possibly a more complex one, and we are in the early stages of wave C. Wave C has more room to expand and can continue its upward movement. However, entering a position should be done at optimal points. We have identified two entry points and will enter using a DCA (Dollar-Cost Averaging) approach. There are two main targets on the chart, and we suggest closing a portion of the position at the first target. A daily candle closing below the invalidation level would negate this analysis.
behdark
TWT Analysis (4H)
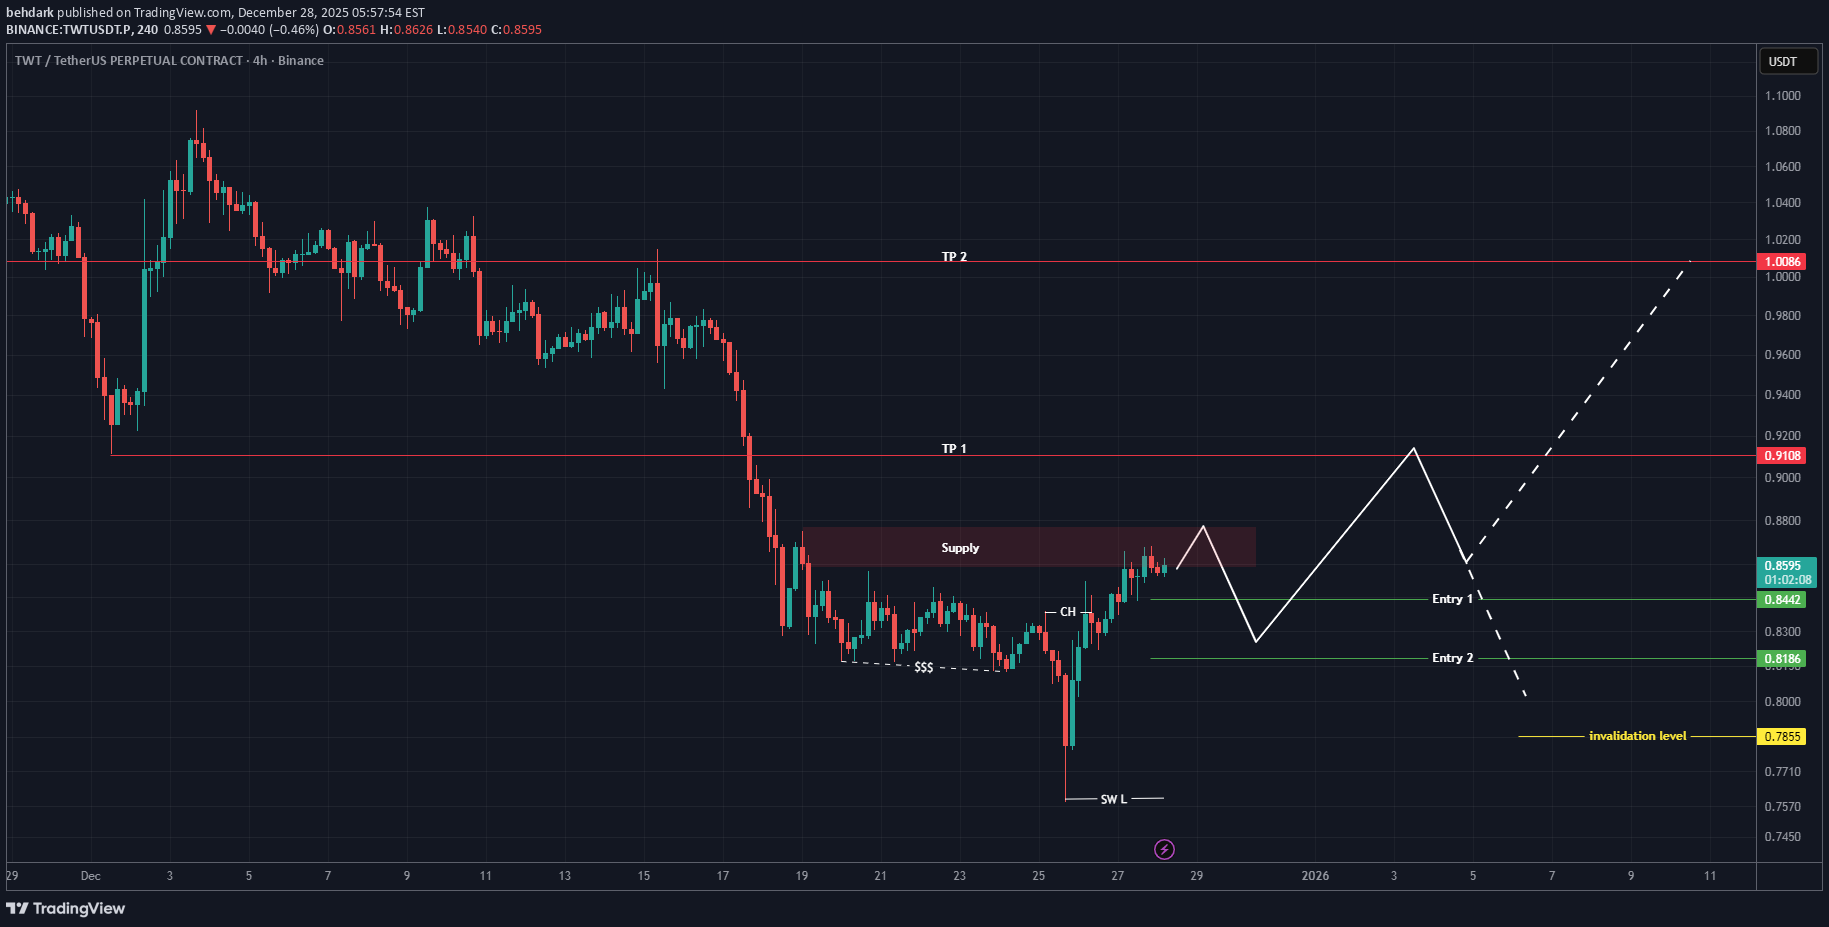
The price has made deep drops, and it appears that market makers have collected sufficient liquidity to change the trend. After the drops, the price ranged at the bottom for a period, which seems to have been sufficient as an accumulation phase for an upward move on the hourly timeframe. Market makers also appear to have filled their orders. The mid-term bearish trendline has been broken. The bearish C wave appears to be a diametric and has already ended. A proper pullback to the broken trendline has not yet occurred. A pullback is expected soon, after which the price is expected to enter the C wave. We have marked two entry points on the chart where positions should be entered using a DCA approach. Targets have been specified on the chart. A daily candle close below the invalidation level will invalidate this analysis. Trading is not hard or complicated if you have a professional coach. If you have a coin or altcoin you want analyzed, first hit the like button and then comment its name so I can review it for you. This is not a trade setup, as it has no precise stop-loss, stop, or target. I do not publish my trade setups here.The price moved according to the plan.
Disclaimer
Any content and materials included in Sahmeto's website and official communication channels are a compilation of personal opinions and analyses and are not binding. They do not constitute any recommendation for buying, selling, entering or exiting the stock market and cryptocurrency market. Also, all news and analyses included in the website and channels are merely republished information from official and unofficial domestic and foreign sources, and it is obvious that users of the said content are responsible for following up and ensuring the authenticity and accuracy of the materials. Therefore, while disclaiming responsibility, it is declared that the responsibility for any decision-making, action, and potential profit and loss in the capital market and cryptocurrency market lies with the trader.