
XEC
ای کش
| تریدر | نوع سیگنال | حد سود/ضرر | زمان انتشار | مشاهده پیام |
|---|---|---|---|---|
نتیجه ای یافت نشد. | ||||
نمودار قیمت ای کش
سود ۳ ماهه :
سیگنالهای ای کش
فیلتر
مرتب سازی پیام براساس
نوع پیام
نوع تریدر
فیلتر زمان

DragonCaoB
سیگنال فروش فوری XEC: آماده سقوط به زیر محدوده مقاومتی!
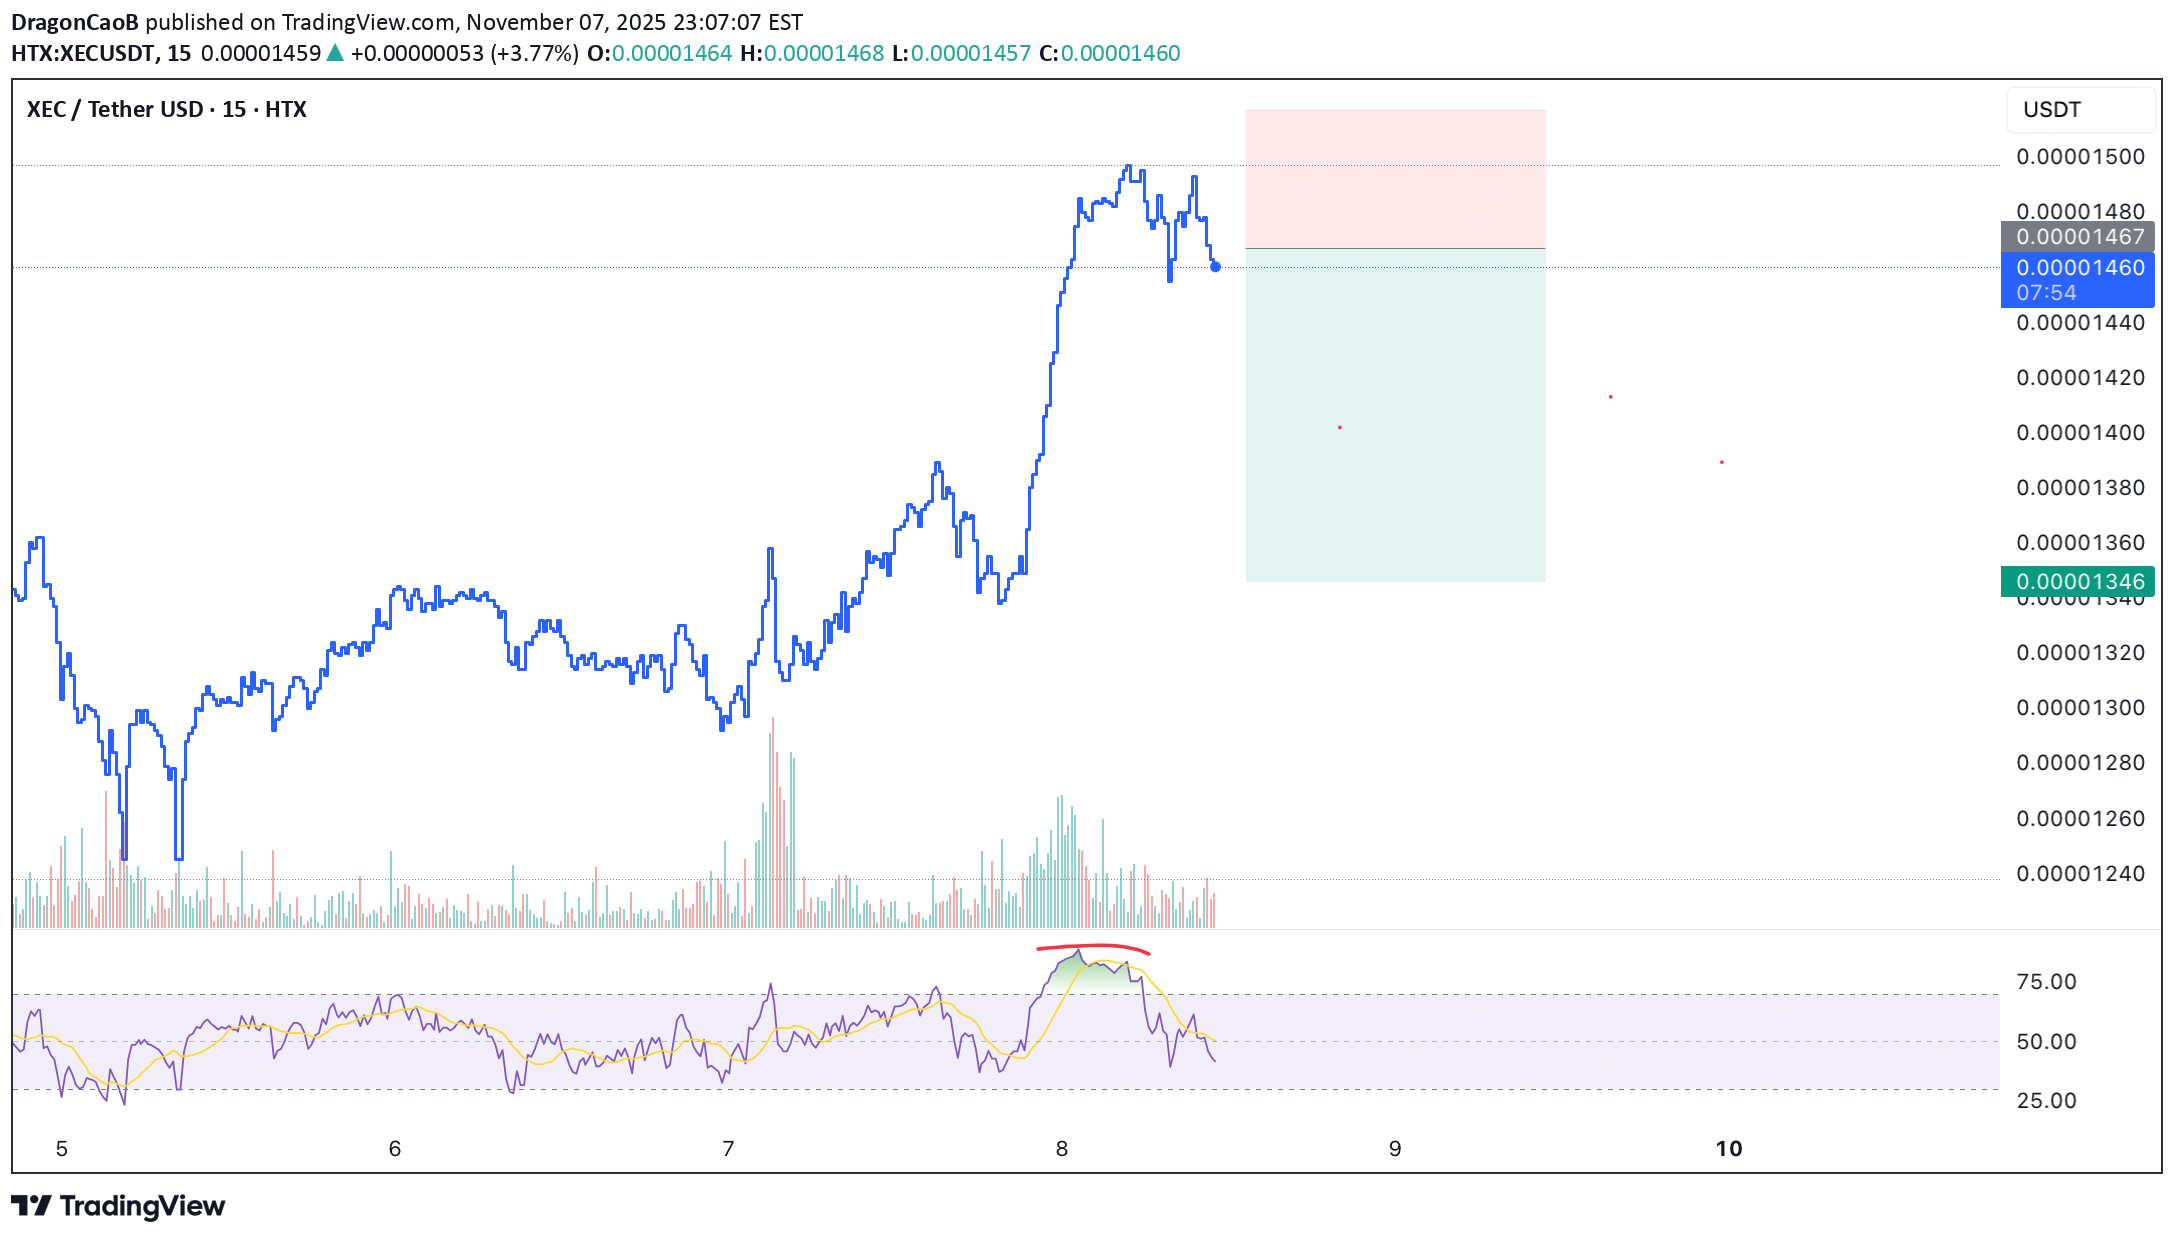
📉 پوست سر کوتاه - XEC RSI قبلاً به سطوح بیش از حد خرید رسیده بود. قیمت تلاش کرد تا بالاترین سطح قبلی را دوباره آزمایش کند، اما شکست خورد و حرکت صعودی ضعیفی را نشان داد. فشار فروش در حال افزایش است، که نشان دهنده یک اصلاح احتمالی در آینده است - یک راه اندازی کوتاه ارزش آزمایش. 🎯 راه اندازی تجارت: برداشت سود (TP): 0.00001346 توقف ضرر (SL): 0.00001517 نسبت ریسک/پاداش (RR): 1: 2.42 یک راهاندازی کوتاه دقیق که توسط رفتار تست مجدد ناموفق و افزایش شتاب فروش پشتیبانی میشود، که نشاندهنده ادامه روند نزولی بالقوه است.

CryptoNuclear
XEC/USDT — Descending Triangle: Breakout Toward or Breakdown?
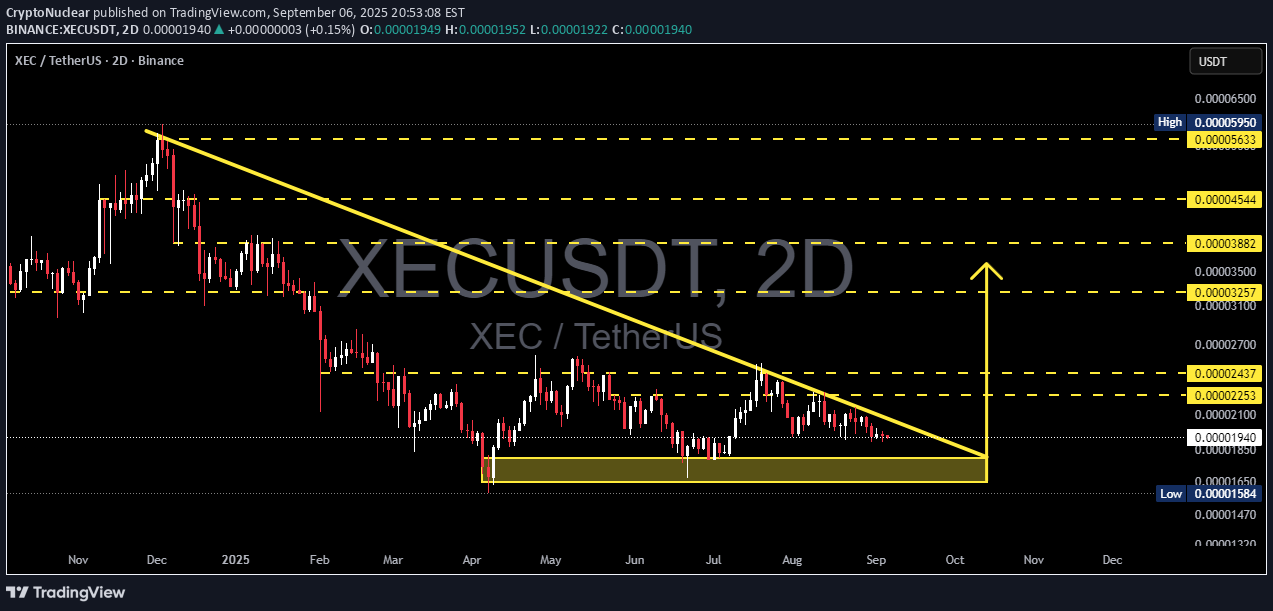
جفت ارز XEC/USDT در حال حاضر در یک فاز تثبیت حیاتی پس از یک روند نزولی طولانی از اوایل سال ۲۰۲۵ قرار دارد. در تایم فریم ۲ روزه، نمودار به وضوح یک مثلث نزولی را تشکیل میدهد که یک خط روند نزولی مداوم قیمت را به سمت پایین فشار میدهد، در حالی که خریداران همچنان از یک منطقه حمایتی قوی در پایین دفاع میکنند. --- 🔎 بررسی تکنیکال الگوی اصلی: مثلث نزولی (از نظر آماری ادامه دهنده روند نزولی، اما جهت نیاز به تایید دارد). منطقه حمایتی کلیدی (جعبه زرد): 0.00001584 – 0.00001850 ← چندین بار به عنوان دفاع خریداران آزمایش شده است. خط روند نزولی: از اوایل سال ۲۰۲۵ قیمت را تحت فشار قرار میدهد و فشار فروش مداوم را نشان میدهد. قیمت فعلی: حدود 0.00001940. اولین منطقه مقاومت: 0.00002253 – 0.00002437 (منطقه شکست حیاتی). مقاومتهای بالاتر: 0.00003257، 0.00003882، 0.00004544، تا 0.00005633. --- 🟢 سناریوی صعودی اگر قیمت از خط روند نزولی عبور کند و بالاتر از 0.00002253–0.00002437 با حجم قوی بسته شود، مثلث نزولی ممکن است به عنوان یک تنظیم نزولی عمل نکند و در عوض به یک سیگنال معکوس صعودی تبدیل شود. هدف Move اندازه گیری شده: ~0.00003106. اهداف مقاومت بعدی: 0.00003257، 0.00003882 و 0.00004544. پتانسیل صعودی: +60٪ تا +120٪ از سطوح فعلی در صورت ادامه حرکت. تست مجدد خط روند شکسته شده به عنوان حمایت جدید، تأیید بیشتری را اضافه میکند. --- 🔴 سناریوی نزولی اگر قیمت نتواند حفظ شود و پایین تر از 0.00001584 در نمودار 2 روزه با حجم قوی بسته شود، مثلث نزولی الگوی ادامه نزولی خود را تأیید میکند. هدف نزولی (اندازه گیری شده move): ~0.00000730. ریسک نزولی: بیش از -60٪ از سطوح قیمت فعلی. پس از شکست، یک پولبک کوچک برای آزمایش مجدد حمایت قدیمی به عنوان مقاومت قبل از کاهش بیشتر بسیار محتمل است. --- 📌 نکات کلیدی حجم بسیار مهم است: یک شکست/شکست بدون حجم قابل توجه، خطر تبدیل شدن به یک move نادرست را دارد. تأیید از طریق بسته شدن 2 روزه: سایههای درون روزی میتوانند گمراه کننده باشند. از بسته شدن کندل 2 روزه برای اعتبار سنجی استفاده کنید. مدیریت ریسک: برای تنظیمات صعودی ← حد ضرر زیر منطقه حمایت. برای تنظیمات نزولی ← حد ضرر بالاتر از منطقه تست مجدد. زمینه بازار: آلتکوینهایی مانند XEC به شدت تحت تأثیر تسلط BTC و نقدینگی کلی کریپتو هستند - همیشه تصویر بزرگتر را بررسی کنید. --- 📝 نتیجه گیری XEC اکنون در یک سطح تعیین کننده قرار دارد. مثلث نزولی میتواند به دو انتهای شدید منجر شود: یک شکست معکوس صعودی به سمت 0.000031–0.000038، یا یک شکست نزولی به سمت ~0.000007. تا زمانی که قیمت در داخل مثلث معامله میشود، بهترین رویکرد این است که قبل از گرفتن major، منتظر تأیید شکست یا شکست باشید. معامله گران تهاجمی ممکن است برای ورود به شکست + تست مجدد آماده شوند، در حالی که سرمایه گذاران بلندمدت ممکن است این منطقه حمایتی را به عنوان محدوده انباشت در نظر بگیرند - اما با مدیریت ریسک دقیق. --- #XEC #XECUSDT #CryptoAnalysis #TradingView #Altcoin #ChartPattern #DescendingTriangle #BreakoutTrading #CryptoStrategy

Alpha-GoldFX
XECUSDT Forming Bullish Wave
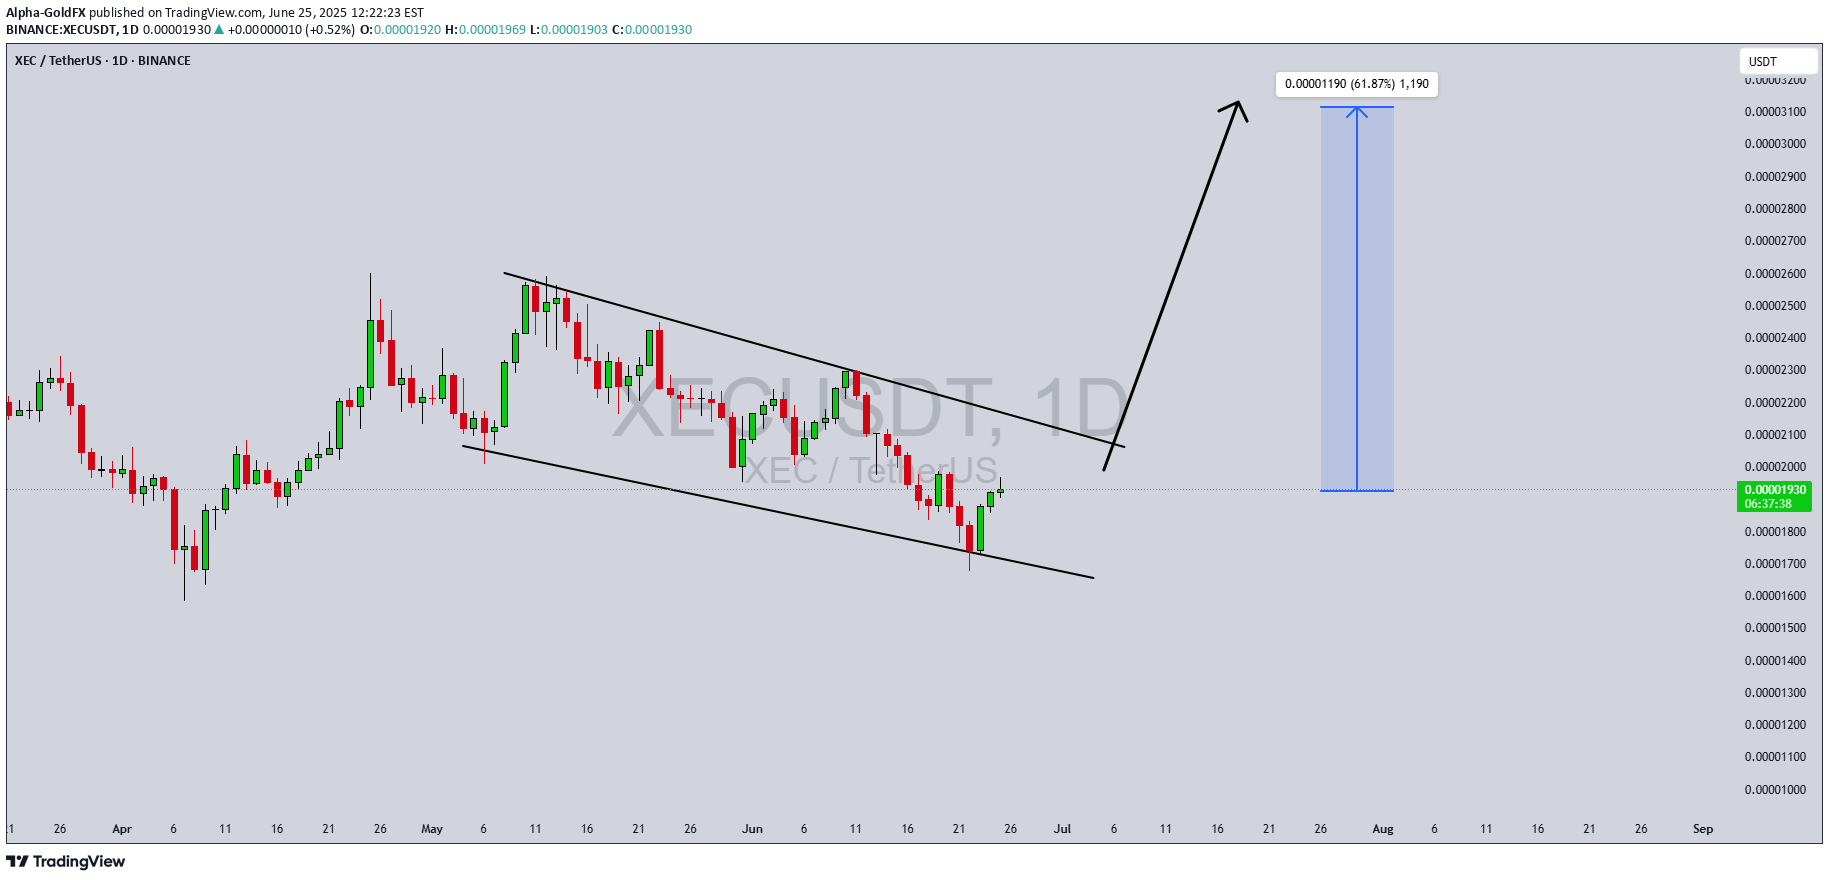
XECUSDT الگوی موج صعودی قوی را نشان میدهد که نشاندهنده ادامه احتمالی روند صعودی فعلی آن است. ساختار، یک شکلگیری موج انگیزشی سالم را منعکس میکند که اغلب نشاندهنده مراحل اولیه یک چرخه صعودی major است. عملکرد قیمت به طور مداوم به مناطق حمایتی کلیدی احترام گذاشته و در عین حال سقفهای بالاتر و کفهای بالاتر را ثبت کرده است—این یک نشانه کلاسیک از قدرت بازار است. با حمایت حجم معاملات از این حرکت، به نظر میرسد که احساسات سرمایهگذاران به طور فزایندهای مثبت است، زیرا XEC در بین ناظران آلتکوینها شروع به جلب توجه میکند. از نظر فنی، دارایی از مرحله تثبیت خود خارج شده است و اکنون مناطق مقاومتی بعدی را هدف قرار میدهد که میتواند افزایش قیمت 50 تا 60 درصدی را باز کند. این الگوی موج به ویژه برای معاملهگران نوسانی و معاملهگران موقعیتی جذاب است، زیرا این تنظیم، نقاط ورود واضح و نسبت ریسک به پاداش قوی را ارائه میدهد. افزایش حجم در طول کندلهای صعودی تأیید میکند که مرحله انباشت به پایان رسیده است و حرکت برای یک صعود پایدار در حال شکلگیری است. از نظر بنیادی، XEC (eCash) به تقویت اکوسیستم خود ادامه میدهد و بر پرداختهای سریع و کمهزینه تمرکز دارد که برای پذیرش در دنیای واقعی جذاب است. بهروزرسانیهای مداوم توسعه و پشتیبانی انجمن، دید بیشتری را برای این پروژه به ارمغان میآورد. با رشد پذیرش بلاکچین در سطح جهانی، سودمندی eCash به عنوان یک ارز دیجیتال در حال افزایش است—و هم علاقه خردهفروشی و هم سازمانی را به خود جلب میکند. این لحظه مهمی برای XECUSDT است و معاملهگرانی که این ساختار موج صعودی را تماشا میکنند میتوانند در کسب پتانسیل صعودی قابل توجه پیشرو باشند. اگر حرکت ادامه یابد و احساسات گستردهتر ارزهای دیجیتال مطلوب باقی بماند، محدوده هدف 50 تا 60 درصد در کوتاه مدت کاملاً در دسترس به نظر میرسد. ✅ با زدن دکمه لایک حمایت خود را نشان دهید و ✅ در زیر کامنت بگذارید! (نظر شما در مورد این کوین چیست) بازخورد و تعامل شما به من انگیزه میدهد تا تحلیلهای روشنگرانه بیشتری از بازار را با شما به اشتراک بگذارم!

MT_T
XECUSDT: Trend in daily timeframe

سطح رنگ سطح بسیار دقیق پشتیبانی و مقاومت در بازه های زمانی مختلف است و ما باید منتظر واکنش آنها در این مناطق باشیم. بنابراین ، لطفاً به روند بسیار دقیق ، سطح رنگی توجه کنید و باید بدانید که تنظیم بسیار حساس است.

UmutTrades
XEC/USDT – Coiled for One of Those Moves

در حال حاضر نمودارهای زیادی وجود ندارند که حس این یکی را داشته باشند. اما XEC متفاوت است. این یکی آن حس را دارد - انگار آماده یکی از آن حرکات کریپتویی wild است که مردم را پس از وقوع، با ناباوری به نمودار خیره میکند. من موضوع را ساده نگه میدارم: جعبه آبی تنها جایی است که میخواهم خریدار باشم. درست زیر یک محدوده اخیر قرار دارد که احتمالاً نقدینگی در آن انباشته شده است و واکنش از این ناحیه میتواند شدید باشد. اینها ستاپهایی هستند که بیسروصدا میآیند - کماهمیت، نادیده گرفته شده توسط جمعیت - و سپس ناگهان اوج میگیرند. هنوز هیچ اوج جدیدی، هیچ فشار تهاجمی وجود ندارد... اما همه چیز در مورد این ساختار، نشاندهنده فشار انباشته شده است. اگر به آن ناحیه سقوط کنیم، با دقت به دنبال تغییر حجم، معکوس شدن سفارش flow یا حتی واگرایی CDV برای تأیید بود. این در مورد پیشبینی نیست. در مورد آماده شدن است. و اگر XEC آنطور که من دیدهام الگوهای مشابه رفتار کردهاند پیش برود... شما میخواهید زود باشید، نه دیر. "من بر ایده شورت خود پافشاری کرد. اگر سطوح ناگهان به سمت بالا شکسته شوند و در تایم فریم پایین، شکستی به سمت پایین ایجاد نکنند، آن را ارزیابی کرد. اگر با حجم به سمت بالا بشکنند و یک ریتست بدهند، به دنبال لانگ بود." ستاپ تمیز است. ریسک مشخص است. و پتانسیل سود؟ فقط بگذارید بگویم این نوع نموداری است که اغلب حرکت نمیکند، اما وقتی حرکت میکند، اجازه نمیگیرد. 🧠 اگر میخواهید آن را نادیده بگیرید، اما اگر این شروع شود و شما منتظر تأیید کامل بودهاید... آرزو کرد که زودتر اقدام کرده بودید. بیایید ببینیم آیا قیمت این فرصت را به ما میدهد که به منطقه آبی سقوط کنیم. اگر این اتفاق بیفتد - من آنجا بود. 📌من نمودارهایم را تمیز و ساده نگه میدارم زیرا معتقدم وضوح منجر به تصمیمات بهتری میشود. 📌رویکرد من بر اساس سالها تجربه و سابقه قوی ساخته شده است. ادعا نمیکنم که همه چیز را میدانم اما به توانایی خود در تشخیص ستاپهای با احتمال بالا اطمینان دارم. 📌اگر میخواهید یاد بگیرید که چگونه از نقشههای حرارتی، دلتای حجم تجمعی و تکنیکهای حجم فوت پرینت که من در زیر برای تعیین مناطق تقاضای بسیار دقیق استفاده میکنم، استفاده کنید، میتوانید یک پیام خصوصی برای من ارسال کنید. من به هر کسی که بخواهد، کاملاً رایگان کمک میکنم. 🔑من یک لیست طولانی از تکنیکهای اثباتشده خود در زیر دارم: 🎯 ZENUSDT.P: صبر و سودآوری | %230 واکنش از ورود تک تیرانداز 🐶 DOGEUSDT.P: حرکت بعدی 🎨 RENDERUSDT.P: فرصت ماه 💎 ETHUSDT.P: محل بازگشت به عقب 🟢 BNBUSDT.P: افزایش بالقوه 📊 BTC دامیننس: ناحیه واکنش 🌊 WAVESUSDT.P: پتانسیل ناحیه تقاضا 🟣 UNIUSDT.P: معامله بلندمدت 🔵 XRPUSDT.P: مناطق ورود 🔗 LINKUSDT.P: رودخانه را دنبال کنید 📈 BTCUSDT.P: دو منطقه تقاضای کلیدی 🟩 POLUSDT: مومنتوم صعودی 🌟 PENDLEUSDT.P: جایی که فرصت با دقت روبرو میشود 🔥 BTCUSDT.P: انحلال معاملات لانگ با اهرم بالا 🌊 SOLUSDT.P: افت SOL - فرصت شما 🐸 1000PEPEUSDT.P: ناحیه پرش اصلی باز شد 🚀 ETHUSDT.P: آماده انفجار - این تغییردهنده بازی را از دست ندهید 🤖 IQUSDT: برنامه هوشمند ⚡️ PONDUSDT: یک معامله انجام نشده بهتر از یک معامله باخت است 💼 STMXUSDT: 2 منطقه خرید 🐢 TURBOUSDT: مناطق خرید و حضور خریدار 🌍 ICPUSDT.P: پتانسیل صعودی عظیم | آپدیت معامله را برای دیدن نتایج بررسی کنید 🟠 IDEXUSDT: منطقه خرید اسپات | %26 سود اگر با MSB معامله کنید 📌 USUALUSDT: خریداران فعال هستند + %70 سود در مجموع 🌟 FORTHUSDT: ورود تک تیرانداز +%26 واکنش 🐳 QKCUSDT: ورود تک تیرانداز +%57 واکنش 📊 BTC.D: ریتست ناحیه کلیدی بسیار محتمل است 📊 XNOUSDT %80 واکنش با یک جعبه آبی ساده! 📊 BELUSDT واکنش شگفت انگیز %120! 📊 جعبه Red ساده، نتایج فوق العاده من دیگر به لیست اضافه نکردم زیرا اضافه کردن 5-10 نمودار در هر حرکت کمی خسته کننده است، اما می توانید نمایه من را بررسی کنید و ببینید که ادامه دارد...

Stoic-Trader
XEC Downtrend Update

پس از اصلاح ABC که در تحلیل قبلیام نشان دادم، اکنون یک موج حرکتی به سمت پایین داریم. به نظر من موج ۱ یک موج گسترشیافته است. بنابراین، طبق پارامترهای امواج الیوت، موج ۳ کوتاهتر از ۱ و موج ۵ کوتاهتر از ۳ بود. مقاومت آبی، هدف احتمالی برای موج ۴ است.

ecashboy
E cash

شبکه ای که به زودی جایگزین بیت کوین شد ، توجه داشته باشید که من به شما می گویم ، خیلی زود آن را برای خودتان دید. این یک توصیه مالی نیست که Dyorr لذت می برد ، وقت آن است که من را ترک کنم ، خوشحال شدم که شما را در حال تحول دیدید.
CryptoNuclear


XV214
XECUSDT

هشدار ریسک ، سلب مسئولیت: موارد فوق داوری بازار شخصی است که بر اساس اطلاعات منتشر شده و نمودار تاریخی data در TradingView ، همه تجزیه و تحلیل فقط ذهنی است. امیدوارم سرمایه گذاران در نظر بگیرند که من مسئول تصمیم سرمایه گذاری شما نیستم. ممنون موفق باشید
ecashboy
Xec

پشتیبانی قوی در اینجا. معکوس به نظر خوب اکنون زمان آن است !Enjoyyyاین یک توصیه مالی نیست dyorrEnjoyyy
سلب مسئولیت
هر محتوا و مطالب مندرج در سایت و کانالهای رسمی ارتباطی سهمتو، جمعبندی نظرات و تحلیلهای شخصی و غیر تعهد آور بوده و هیچگونه توصیهای مبنی بر خرید، فروش، ورود و یا خروج از بازارهای مالی نمی باشد. همچنین کلیه اخبار و تحلیلهای مندرج در سایت و کانالها، صرفا بازنشر اطلاعات از منابع رسمی و غیر رسمی داخلی و خارجی است و بدیهی است استفاده کنندگان محتوای مذکور، مسئول پیگیری و حصول اطمینان از اصالت و درستی مطالب هستند. از این رو ضمن سلب مسئولیت اعلام میدارد مسئولیت هرنوع تصمیم گیری و اقدام و سود و زیان احتمالی در بازار سرمایه و ارز دیجیتال، با شخص معامله گر است.