
LINK
چین لینک
| تریدر | نوع سیگنال | حد سود/ضرر | زمان انتشار | مشاهده پیام |
|---|---|---|---|---|
 SaulTradezرتبه: 417 | خرید | حد سود: تعیین نشده حد ضرر: تعیین نشده | ۱۴۰۴/۸/۱۵ | |
 ThetaNomadرتبه: 744 | خرید | حد سود: تعیین نشده حد ضرر: تعیین نشده | ۱۴۰۴/۸/۲۸ | |
 Phillipklhرتبه: 1386 | خرید | حد سود: تعیین نشده حد ضرر: تعیین نشده | ۱۴۰۴/۸/۱۳ | |
 Richtv_officialرتبه: 13691 | خرید | حد سود: تعیین نشده حد ضرر: تعیین نشده | ۱۴۰۴/۸/۲۸ | |
 davidjulien369رتبه: 16376 | خرید | حد سود: تعیین نشده حد ضرر: تعیین نشده | ۱۴۰۴/۹/۲ |
نمودار قیمت چین لینک
سود ۳ ماهه :
خلاصه سیگنالهای چین لینک
سیگنالهای چین لینک
فیلتر
مرتب سازی پیام براساس
نوع پیام
نوع تریدر
فیلتر زمان

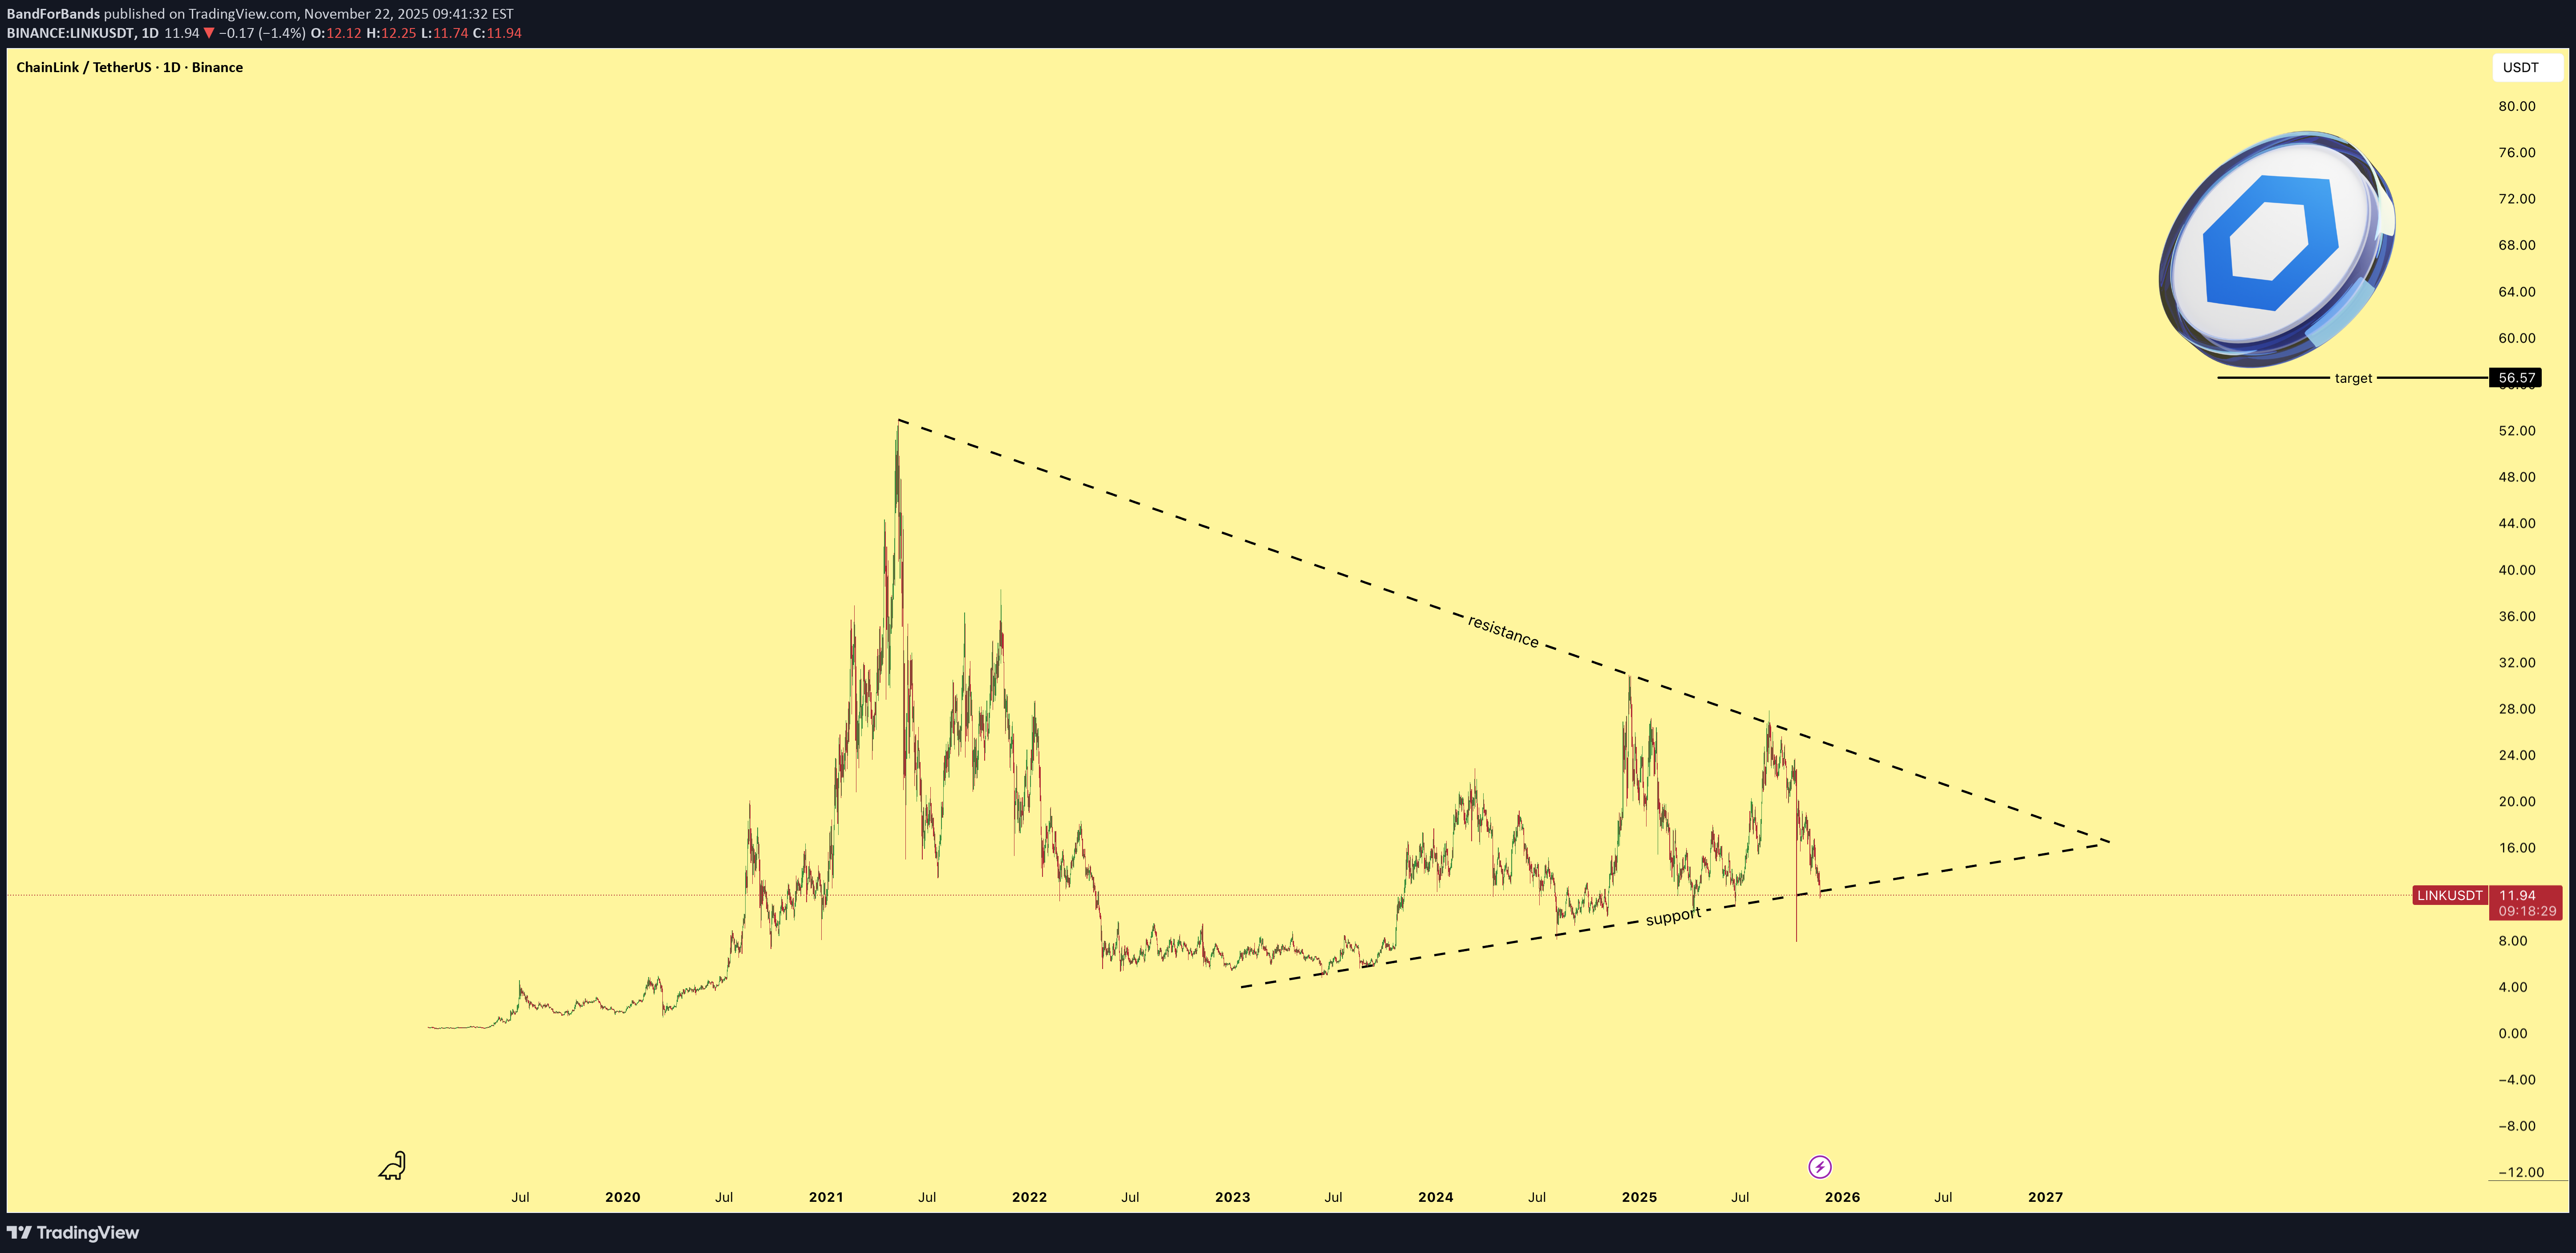
BandForBands
لینک (LINK): آیا تأیید ETF انفجار قیمتی را رقم میزند؟ تحلیل قوی نمودار و شتاب صعودی
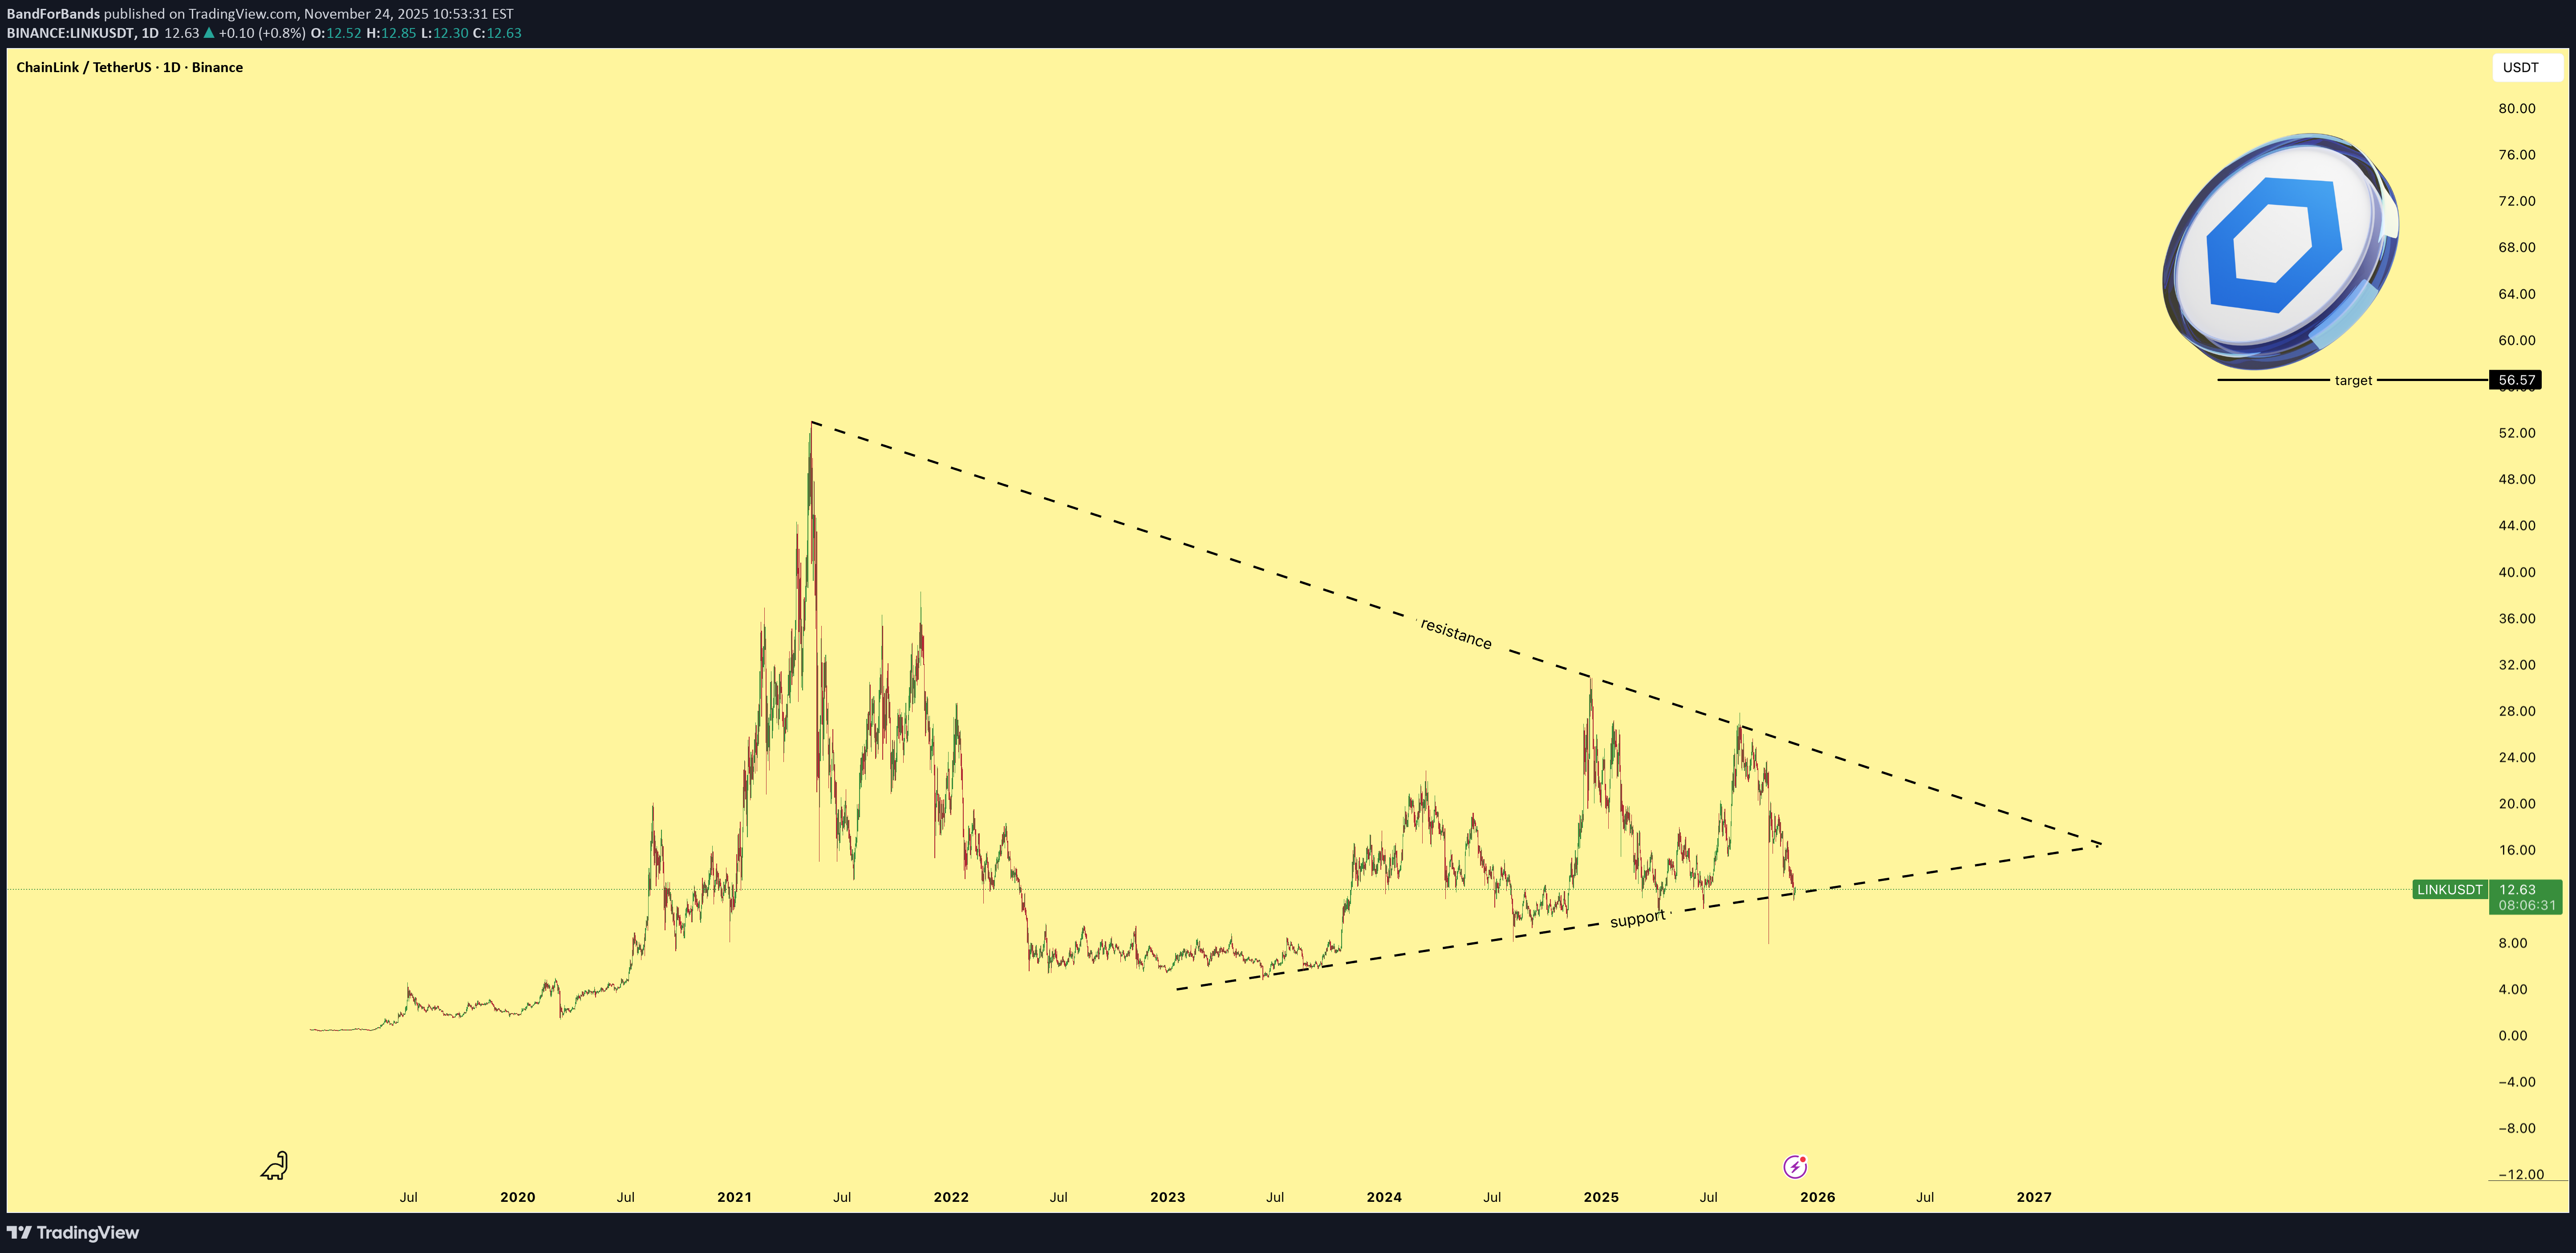
حمایت را فوقالعاده خوب حفظ کرده است و ساختار قوی به نظر میرسد. اگر یک ETF تأیید شود، این همان کاتالیزوری بود که قیمت را به سمت شکست صعودی هدایت کرده و آن را به راحتی به هدف میرساند. شتاب (مومنتوم) در حال شکلگیری است و نمودار کاملاً برای جهش آماده است.

CryptoAnalystSignal
سیگنال خرید لینک (LINK/USDT): فرصت صعود قدرتمند با اهداف مشخص!
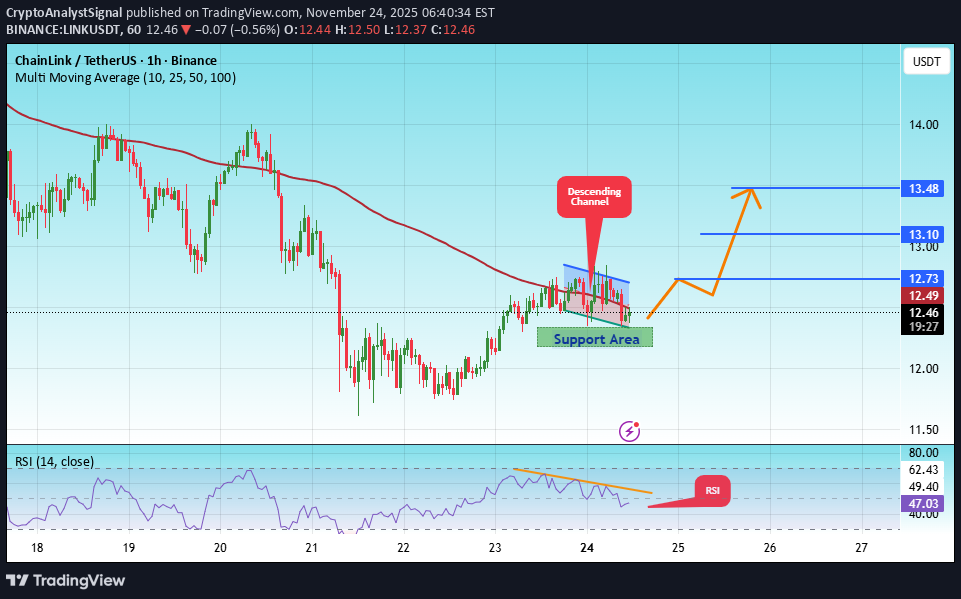
#LINK قیمت در یک کانال صعودی در بازه زمانی 1 ساعته حرکت می کند و به خوبی به آن پایبند است. آماده است که به شدت از بین برود و کانال را دوباره آزمایش کند. ما یک خط روند نزولی در اندیکاتور RSI داریم که در شرف شکستن و آزمایش مجدد است که از move صعودی پشتیبانی می کند. یک منطقه حمایت کلیدی به رنگ سبز در 12.27 وجود دارد که نشان دهنده یک نقطه حمایت قوی است. ما روندی برای تثبیت بالای میانگین متحرک 100 دوره ای داریم. قیمت ورودی: 12.48 هدف اول: 12.73 هدف دوم: 13.10 هدف سوم: 13.48 یک قانون ساده مدیریت پول را فراموش نکنید: سفارش توقف ضرر خود را در زیر ناحیه حمایت سبز قرار دهید. پس از رسیدن به اولین هدف، مقداری پول پس انداز کنید و سپس دستور توقف ضرر خود را به دستور ورودی تغییر دهید. برای هر گونه سوال لطفا نظر بدهید. ممنون.#LINK هدف اول: 12.73 رسیده است هدف دوم: 13.10 رسیده است

لینک (LINK): آمادهسازی برای موج صعودی بزرگ – تحلیل و آینده پیش رو!
davidjulien369
تحلیل جامع معامله خرید LINKUSDT: استراتژی شکست ساختار و شکار نقدینگی
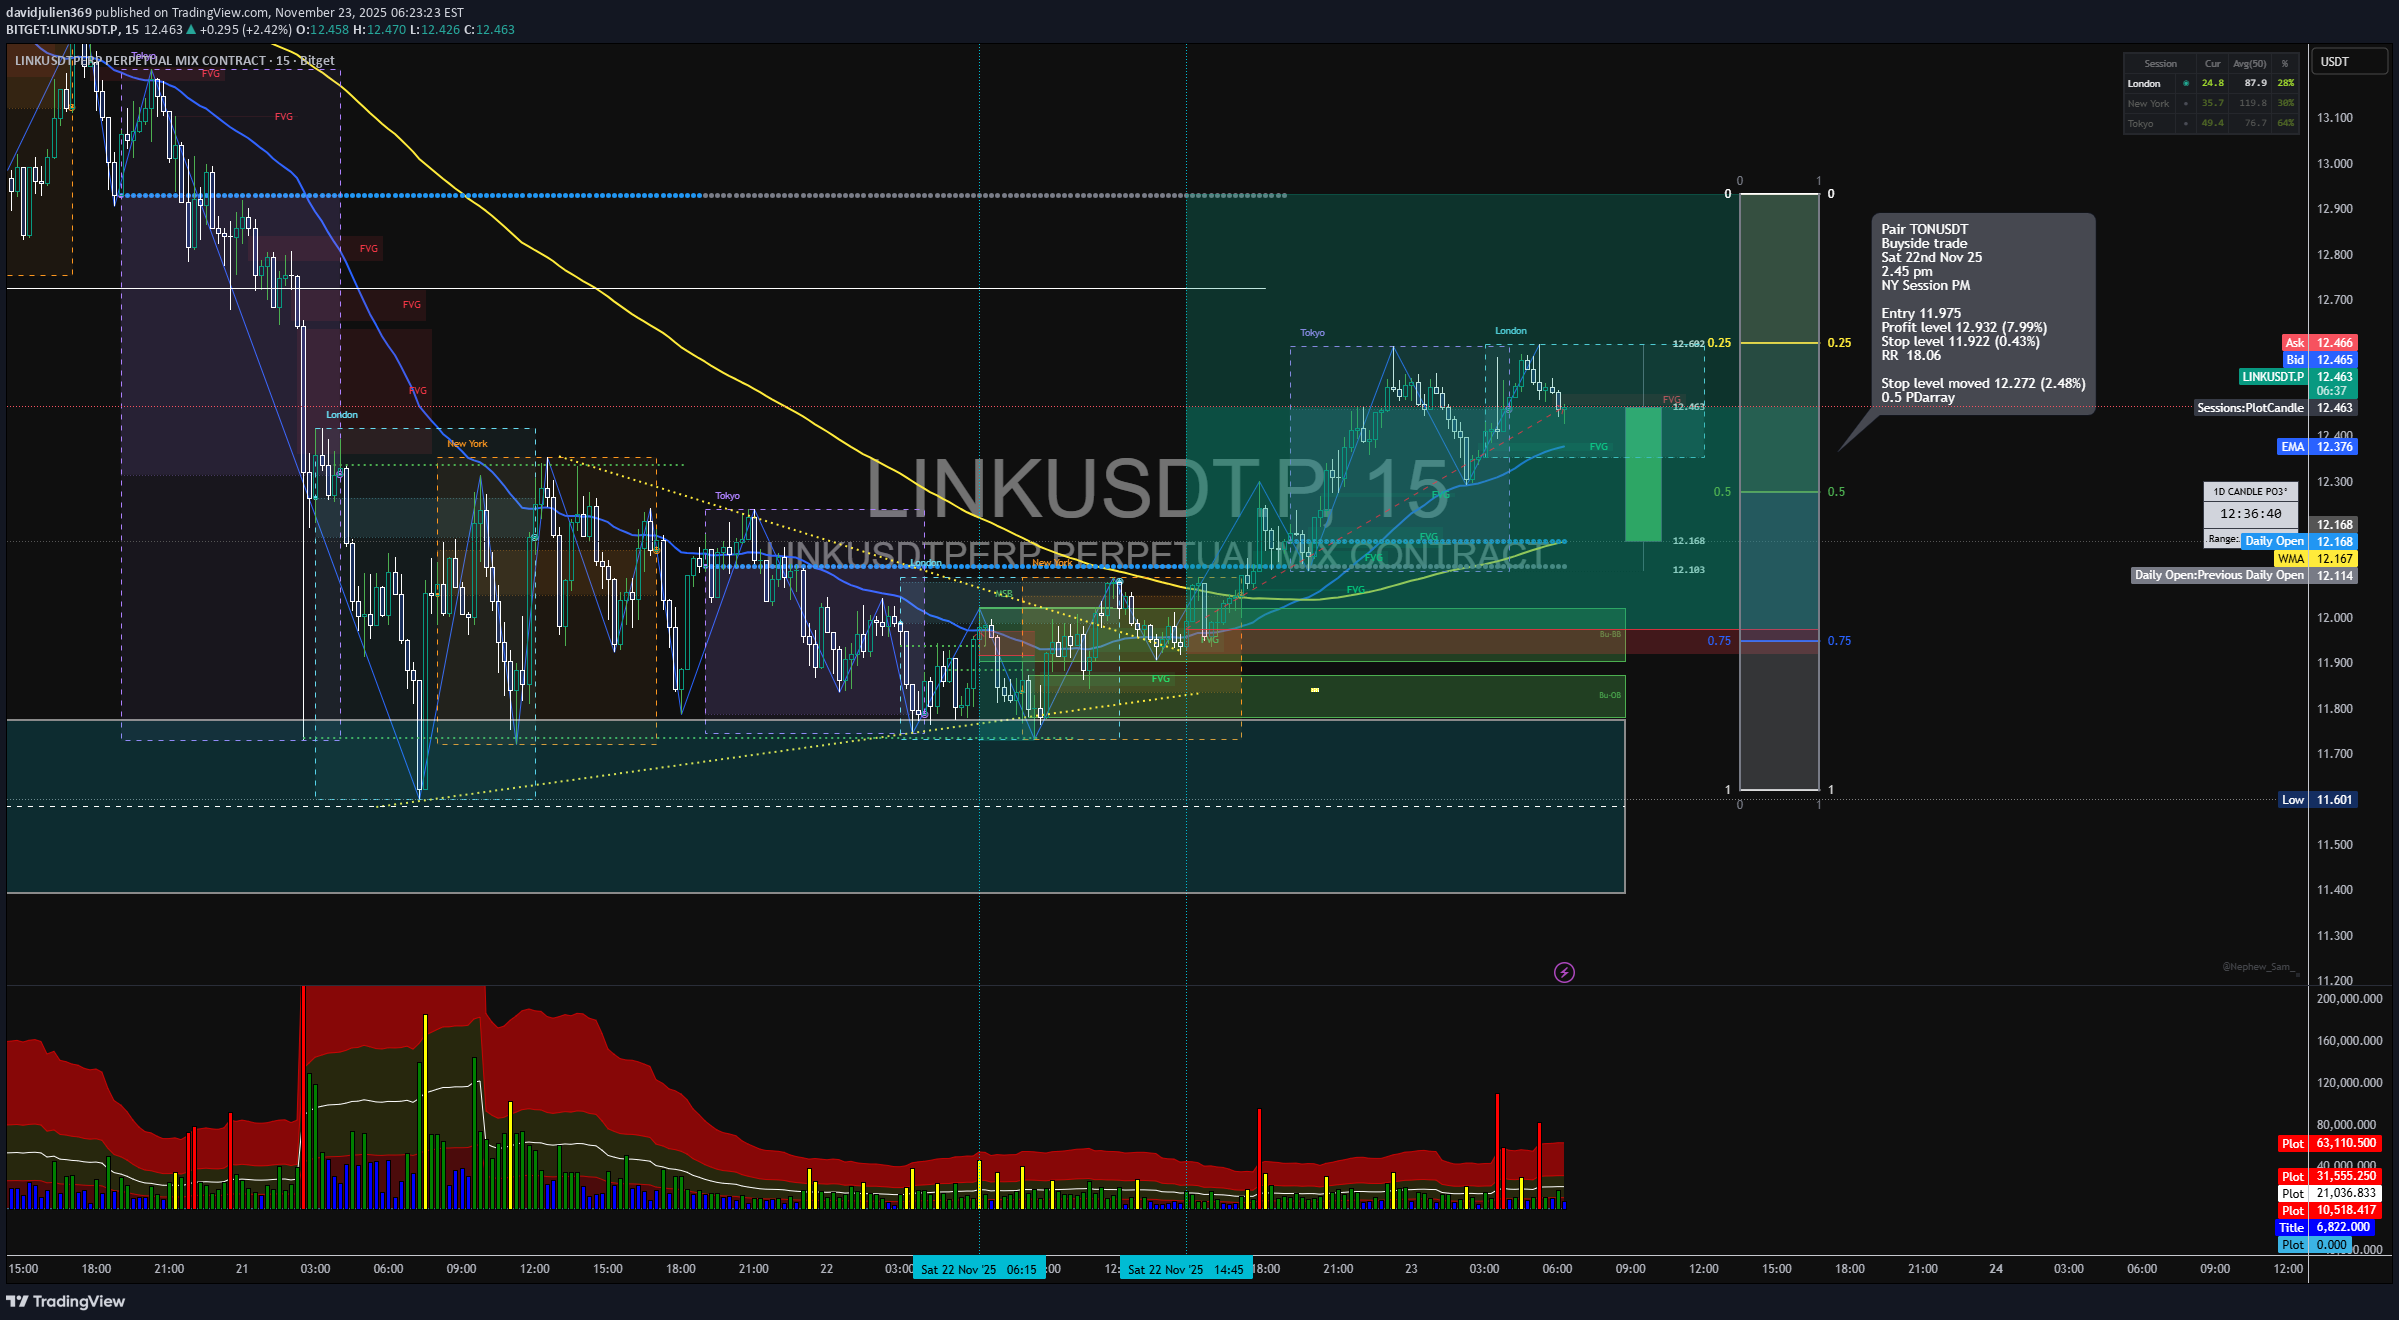
مدخل مجله تجارت جفت: LINKUSDT.P نوع تجارت: تجارت کنار خرید تاریخ: شنبه 22 نوامبر 25 زمان: ساعت 15:00 جلسه: PM جلسه نیویورک مدت زمان: 15 دقیقه 1. پارامترهای تجارت ورودی: 11.975 سطح سود: 12.922 (+7.99%) سطح توقف: 11.922 (-0.43٪) ریسک به پاداش: 18.06 R 2. زمینه و ساختار این تنظیم از یک توالی انباشت سه جلسه ای پیروی می کند (توکیو → لندن → نیویورک)، که یک گوه نزولی را در محدوده تخفیف پای نزولی قبلی تشکیل می دهد. نشست لندن از نقدینگی زیر 11.80 محرک نهایی قبل از گسترش نیویورک بود. دیلی اوپن به عنوان یک آهنربای نقطه میانی عمل کرد که در آن قیمت قبل از جابجایی تثبیت شد. BOS (شکستن ساختار): در جلسه NY PM با جابجایی واضح بالای قله آسیا تأیید شد. تراز EMA: 50 EMA از بالای 200 EMA عبور کرد که نشان دهنده وارونگی ساختاری درون روز است. هر دو EMA اکنون به عنوان مناطق پشتیبانی پویا عمل می کنند. 3. نقدینگی Story و مدل پول هوشمند نقدینگی سمت فروش زیر محدوده 11.70-11.80 قبل از گسترش صعودی رد شد. بلوک های عدم تعادل / FVG بین 11.83 تا 12.18 به طور موثر در شکست پر شدند و FVG های جدید بدون کاهش را برای ورود مجدد احتمالی در زیر باقی گذاشتند. روایت PD Array: قیمت از تخفیف (انباشت) به تعادل، با اهداف فعلی با هدف ناکارآمدی حق بیمه (12.80-12.95) تغییر کرد. چندین FVG داخلی (12:18 → 12:45 → 12:68) act به عنوان مناطق پله ای ادامه دار. 4. Wyckoff / SMC Alignment Wyckoff PhaseObservationICT / معادل SMC جاروب فاز CLondon از پایین ترین محدوده، القای نقدینگی جابجایی فاز DNY از طریق برد بالای شکست ساختار (BOS) مرحله ERetest بلوک و ادامه سفارش صعودی ورودی تلاقی FVG + OB 5. حجم و تایید افزایش قابل توجه در حجم در طول شکست گوه - نشان دهنده مشارکت نهادی است. توزیع حجم نشان دهنده انبساط تدریجی در شمع های صعودی و انقباض در اصلاحات، مطابق با انباشت پول هوشمند → رفتار توسعه است. تجارت 2
لینک (LINK) در آستانه انفجار بزرگ؟ تحلیل موجی که سیگنال خرید را مشخص میکند!
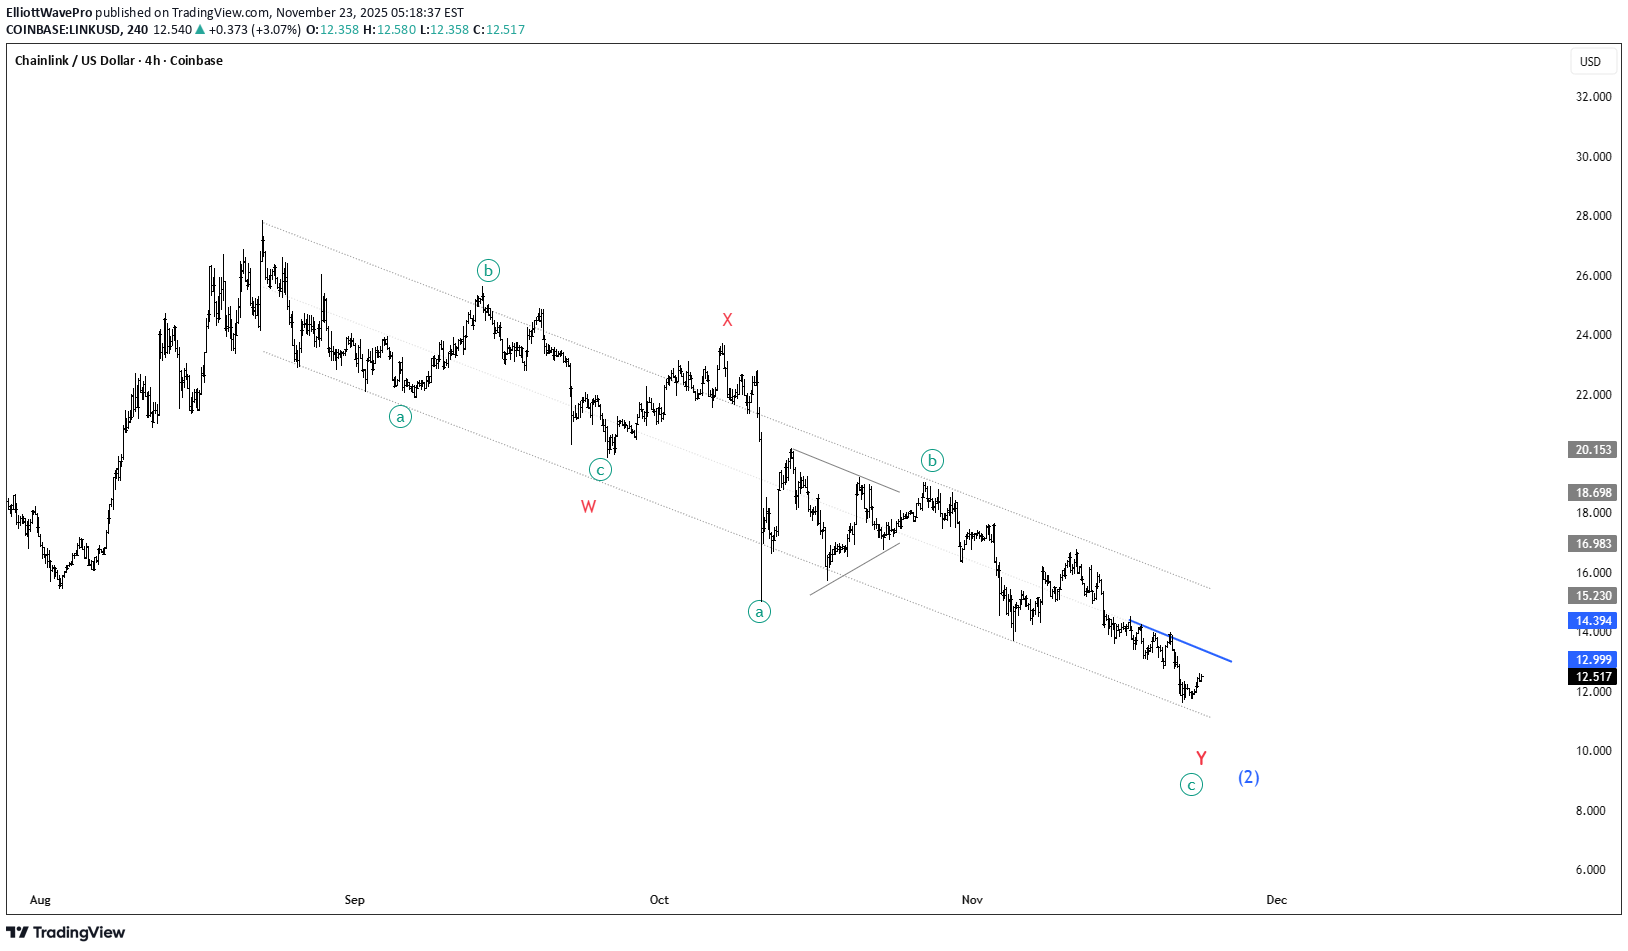
– تحلیل موج الیوت (نمودار ۴ ساعته) ساختار فعلی همچنان با کاهش اصلاحی W–X–Y مطابقت دارد، اما اکنون در حال نزدیک شدن به یک سطح محرک حیاتی هستیم. شکست واضح (عبور قاطع) از خط روند آبی = سیگنال خرید. 🎯 🟦 ساختار چه چیزی را نشان میدهد: 🔻 موج W تکمیل شده است: • زیگزاگ a–b–c واضح • واکنش قوی در محدوده اتصال X 🔷 موج X در ناحیه میانی کانال: • در صورت شکست، به عنوان هدف صعودی بعدی major عمل میکند • تقارن ساختاری بین W و Y ایجاد میکند. 🔻 موج Y در حال پیشرفت: • مجدداً به شکل a–b–c تشکیل میشود • پایهی C (موج C) در حال اتمام به نظر میرسد و با حمایت کانال همسو است. 📉 قیمت در حال فشرده شدن زیر خط روند نزولی آبی (مقاومت موج B از Y) است. 🚀 محرک معامله: یک شکست قاطع بالای خط روند آبی = آغاز پایهی جنبشی (موج محرک) بعدی هدف صعودی: منطقهای در حوالی سقف قبلی X این ناحیه همزمان: • 🔹 اصلاح ساختاری است • 🔹 جاذبه کانال بالایی است • 🔹 منطقه ایدهآل اولین برداشت سود است. 📌 خلاصه: شکست خط آبی ➜ تایید صعودی (بولیش) ➜ هدف = سطح X. هنوز اصلاحی است، اما موج جنبشی بعدی نزدیک است. ⚡
BandForBands
تحلیل تکنیکال: آیا لینک (LINK) آماده جهش 400 درصدی است؟ نقطه ورود طلایی!

Crypto4light
۴ حرکت اصلی قیمت در نمودار: از گسترش تا تثبیت (راهنمای کامل)
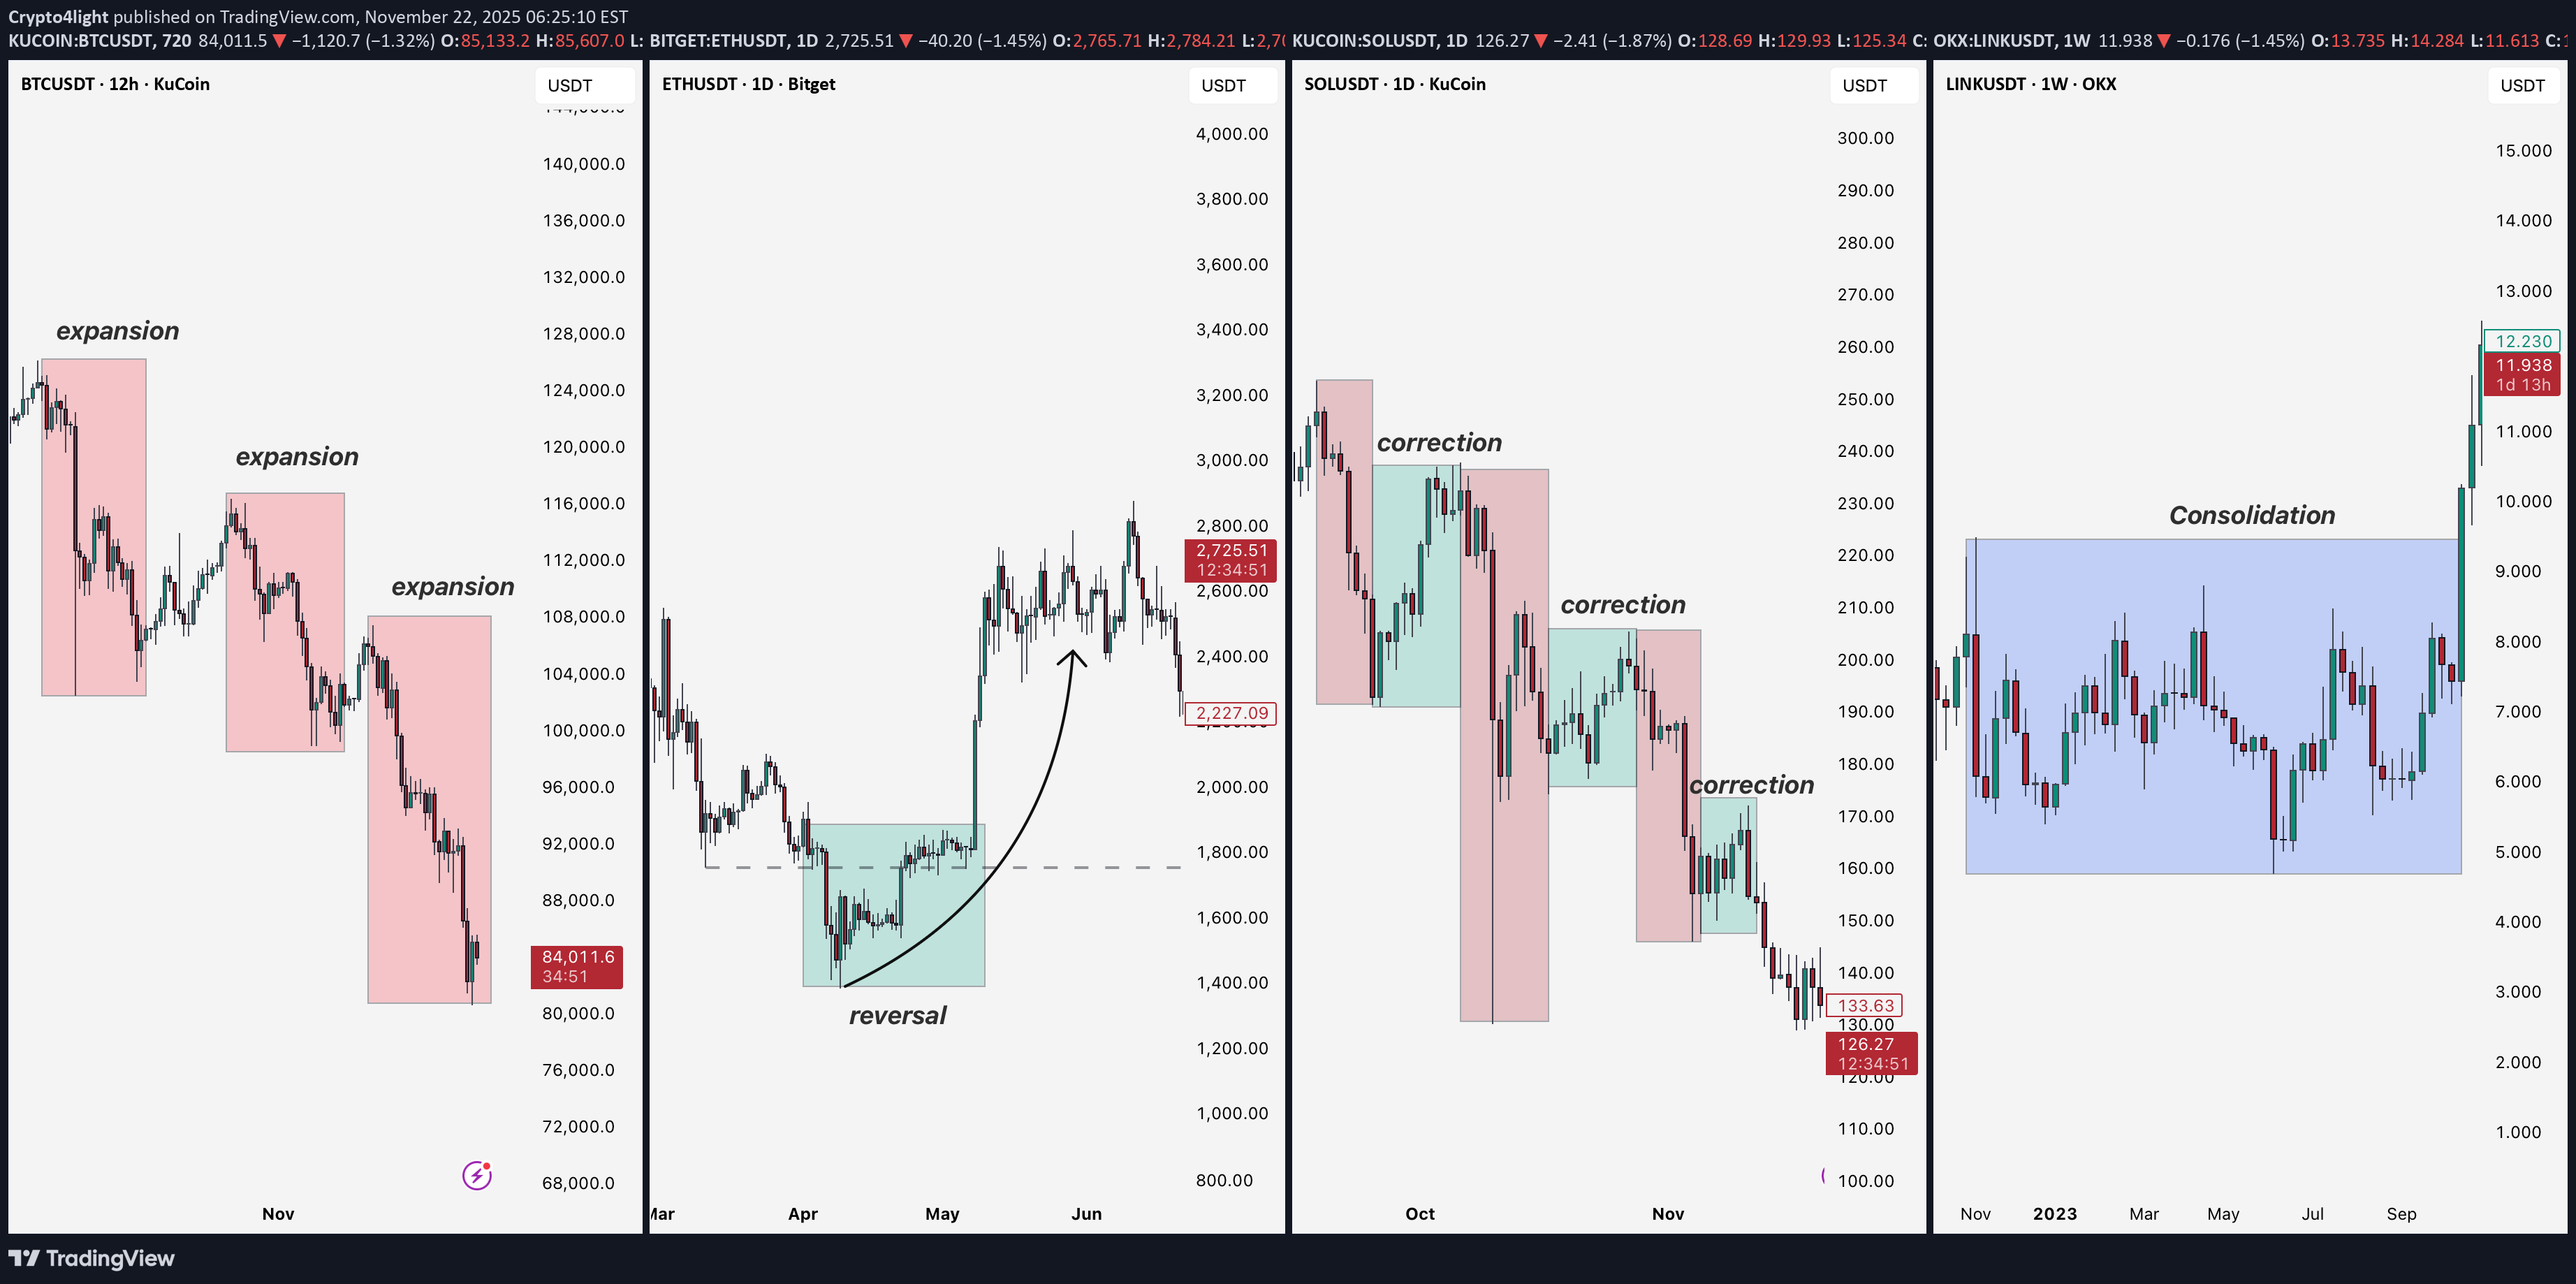
درک شرایط فعلی قیمت، زمینهای را فراهم میآورد که بر اساس آن ابزارهای معاملاتی خود را به کار ببریم. اینها ۴ حرکت رایج قیمت در نمودارها هستند که در بازههای زمانی مختلف قابل مشاهدهاند: **انبساط (Expansion)** یک رشد یا کاهش شارپی و تکانهای در قیمت است. **برگشت (Reversal)** تغییر جهت حرکت قیمت، در خلاف جهت روند فعلی. **اصلاح (Correction)** یک حرکت موقت (پولبک یا عقبنشینی) در ساختار قیمت است. **تحکیم/تثبیت (Consolidation)** حرکت جانبی (افقی) قیمت؛ شرایطی که در آن تعیین جهتِ واضح غیرممکن است. اولین چیزی که باید پیش از باز کردن یک موقعیت معاملاتی مشخص شود، "زمینه" (Context) است. با در نظر گرفتن ساختار و مناطق نقدینگی، تعیین کنید که قیمت در حال حاضر کجا قرار دارد و به احتمال زیاد به کدام سمت حرکت کرد. زمانی که جهت حرکت مشخص شد، به دنبال نقاط مورد علاقه (POI) باشید که میتوانید از آنها انتظار واکنش قیمت را داشته باشید. در داخل منطقه مورد علاقه، منتظر تأییدیه برای ورود به موقعیت میمانیم. تأییدیه عبارت است از تغییر ساختار در یک بازه زمانی پایینتر، که اعتبار نقاط مورد علاقه (POI) را تأیید میکند. سپاس از مطالعه.

cryptodailyuk
تحلیل تکنیکال لینک (LINK): خط حیاتی حمایت و دو سناریوی صعودی/نزولی بزرگ
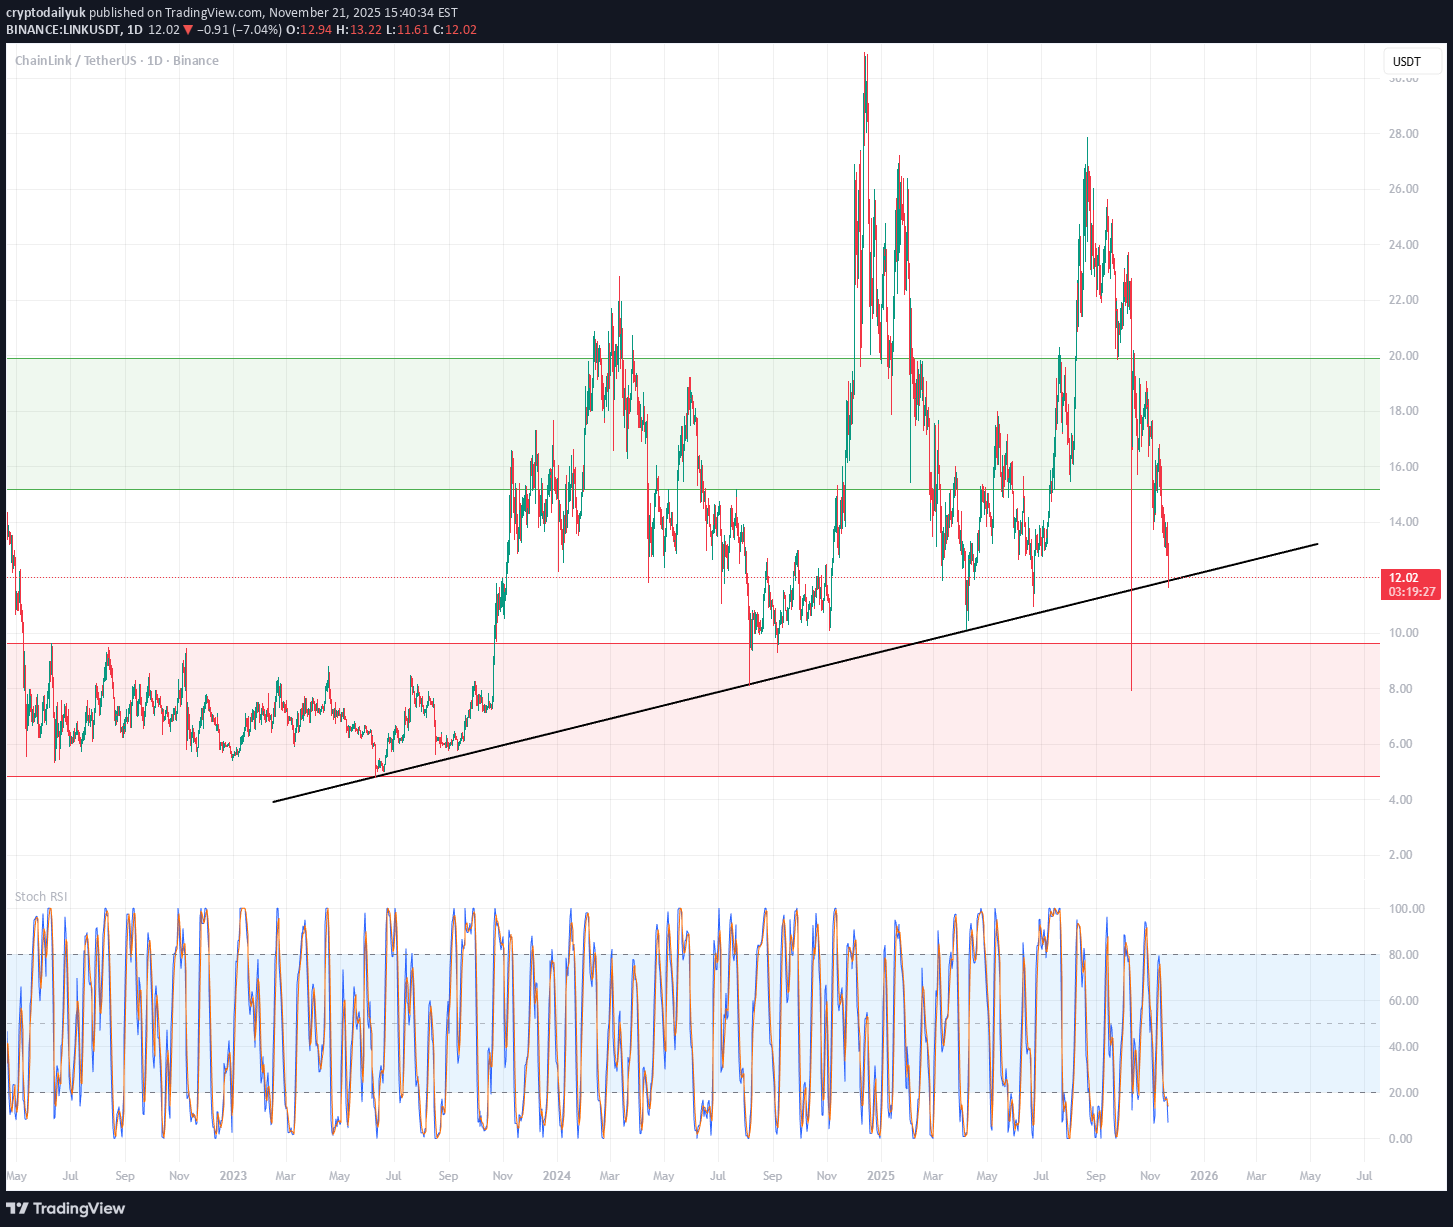
📊 ۱. ساختار بازار (MARKET STRUCTURE) روند بلندمدت قیمت در حال حاضر به این خط نزدیک میشود، اما هنوز مستقیماً آن را آزمایش نکرده است. این یک سطح حمایت کلیدی برای کل بازار LINK است. ۲. ناحیه عرضه و تقاضا (SUPPLY & DEMAND ZONE) ناحیه تقاضا — ۴.۸ تا ۹.۶ دلار این ناحیه بزرگ red است. این: یک ناحیه انباشت تاریخی است، ناحیهای که LINK بارها در آن دفاع شده است، ناحیهای که قیمت با هر دامپ (افت شدید) major به آن بازگشته است. ناحیه عرضه — ۱۵ تا ۲۰ دلار ناحیه سبزی که: قیمت بارها از آن ریجکت (رد) شده است، این دیوار فروش مربوط به سال ۲۰۲۱ است، یک هدف کلیدی برای خریداران (بولز) پس از بازگشت (ریکاوری). ۳. سطوح حیاتی (CRITICAL LEVELS) حمایت بسیار مهم نوع | سطح | توضیحات خط روند | ۱۱.۵ تا ۱۲.۲ دلار آمریکا | ما بسیار به آزمایش نزدیک هستیم. افقی | ۹.۶۳ دلار آمریکا | اولین حمایت تاریخی major. افقی | ۴.۸۴ دلار آمریکا | کف نهایی (قویترین تقاضا). اگر خط روند شکسته شود، → **LINK تقریباً به طور قطع تا ۹.۶۳ سقوط کرد،** و اگر آن هم بشکند، → سقوط تا ۴.۸ دلار آمریکا بسیار محتمل است. ۴. مومنتوم – استوکاستیک RSI (MOMENTUM – STOCH RSI) در نمودار استوکاستیک RSI: به شدت در وضعیت اشباع فروش (Oversold) قرار دارد، مشابه کفهای قبلی (۲۰۲۳، ۲۰۲۴)، سیگنال احتمال بازگشت (ریکاوری) در عرض چند روز/هفته را میدهد. ۵. سناریوهای قیمت (PRICE SCENARIOS) 🟢 صعودی (جهش/بازگشت) شرط: حفظ خط روند حرکات مورد انتظار: جهش در حدود ۱۱.۵ تا ۱۲.۵ هدف ۱: ۱۵ دلار آمریکا هدف ۲: ۱۸ تا ۲۰ دلار آمریکا بریکآوت (شکست) احتمالی → ۲۲ تا ۲۴ دلار آمریکا این سناریو واقعبینانه است، به شرطی که Bitcoin افت شدید (دامپ) قوی دیگری نداشته باشد. 🔴 نزولی (سقوط) شرط: شکست خط روند با کندل روزانه زیر تقریباً ۱۱.۵ حرکات مورد انتظار: یک افت سریع تا ۹.۶۳ دلار آمریکا این میتواند منجر به: یک بازگشت تا حدود ۱۲ یا ادامه کاهش شود اگر ۹.۶۳ سقوط کند (بشکند) → هدفی تقریباً قطعی در ۴.۸ دلار آمریکا این سطح نشاندهنده یک انباشت تاریخی مهم است و بدون مقاومت شکست. ➤ قیمت در حال حاضر روی یک نخ بند است (در وضعیت بسیار حساسی قرار دارد). خط روند یکی از مهمترین سطوح حمایتی در نمودار LINK است. مومنتوم در اشباع فروش است → سیگنالی برای شورت اسکوییز/جهش. اما ساختار محلی همچنان نزولی باقی میماند. ➤ اگر خط روند حفظ شود → یک نوسان (سویینگ) صعودی قوی و بلند. ➤ اگر فرو بریزد → تا ۹.۶۳ و احتمالاً ۴.۸ سقوط کرد.
لینک در آستانه یک منطقه خرید بزرگ: فرصت طلایی برای سرمایهگذاری!
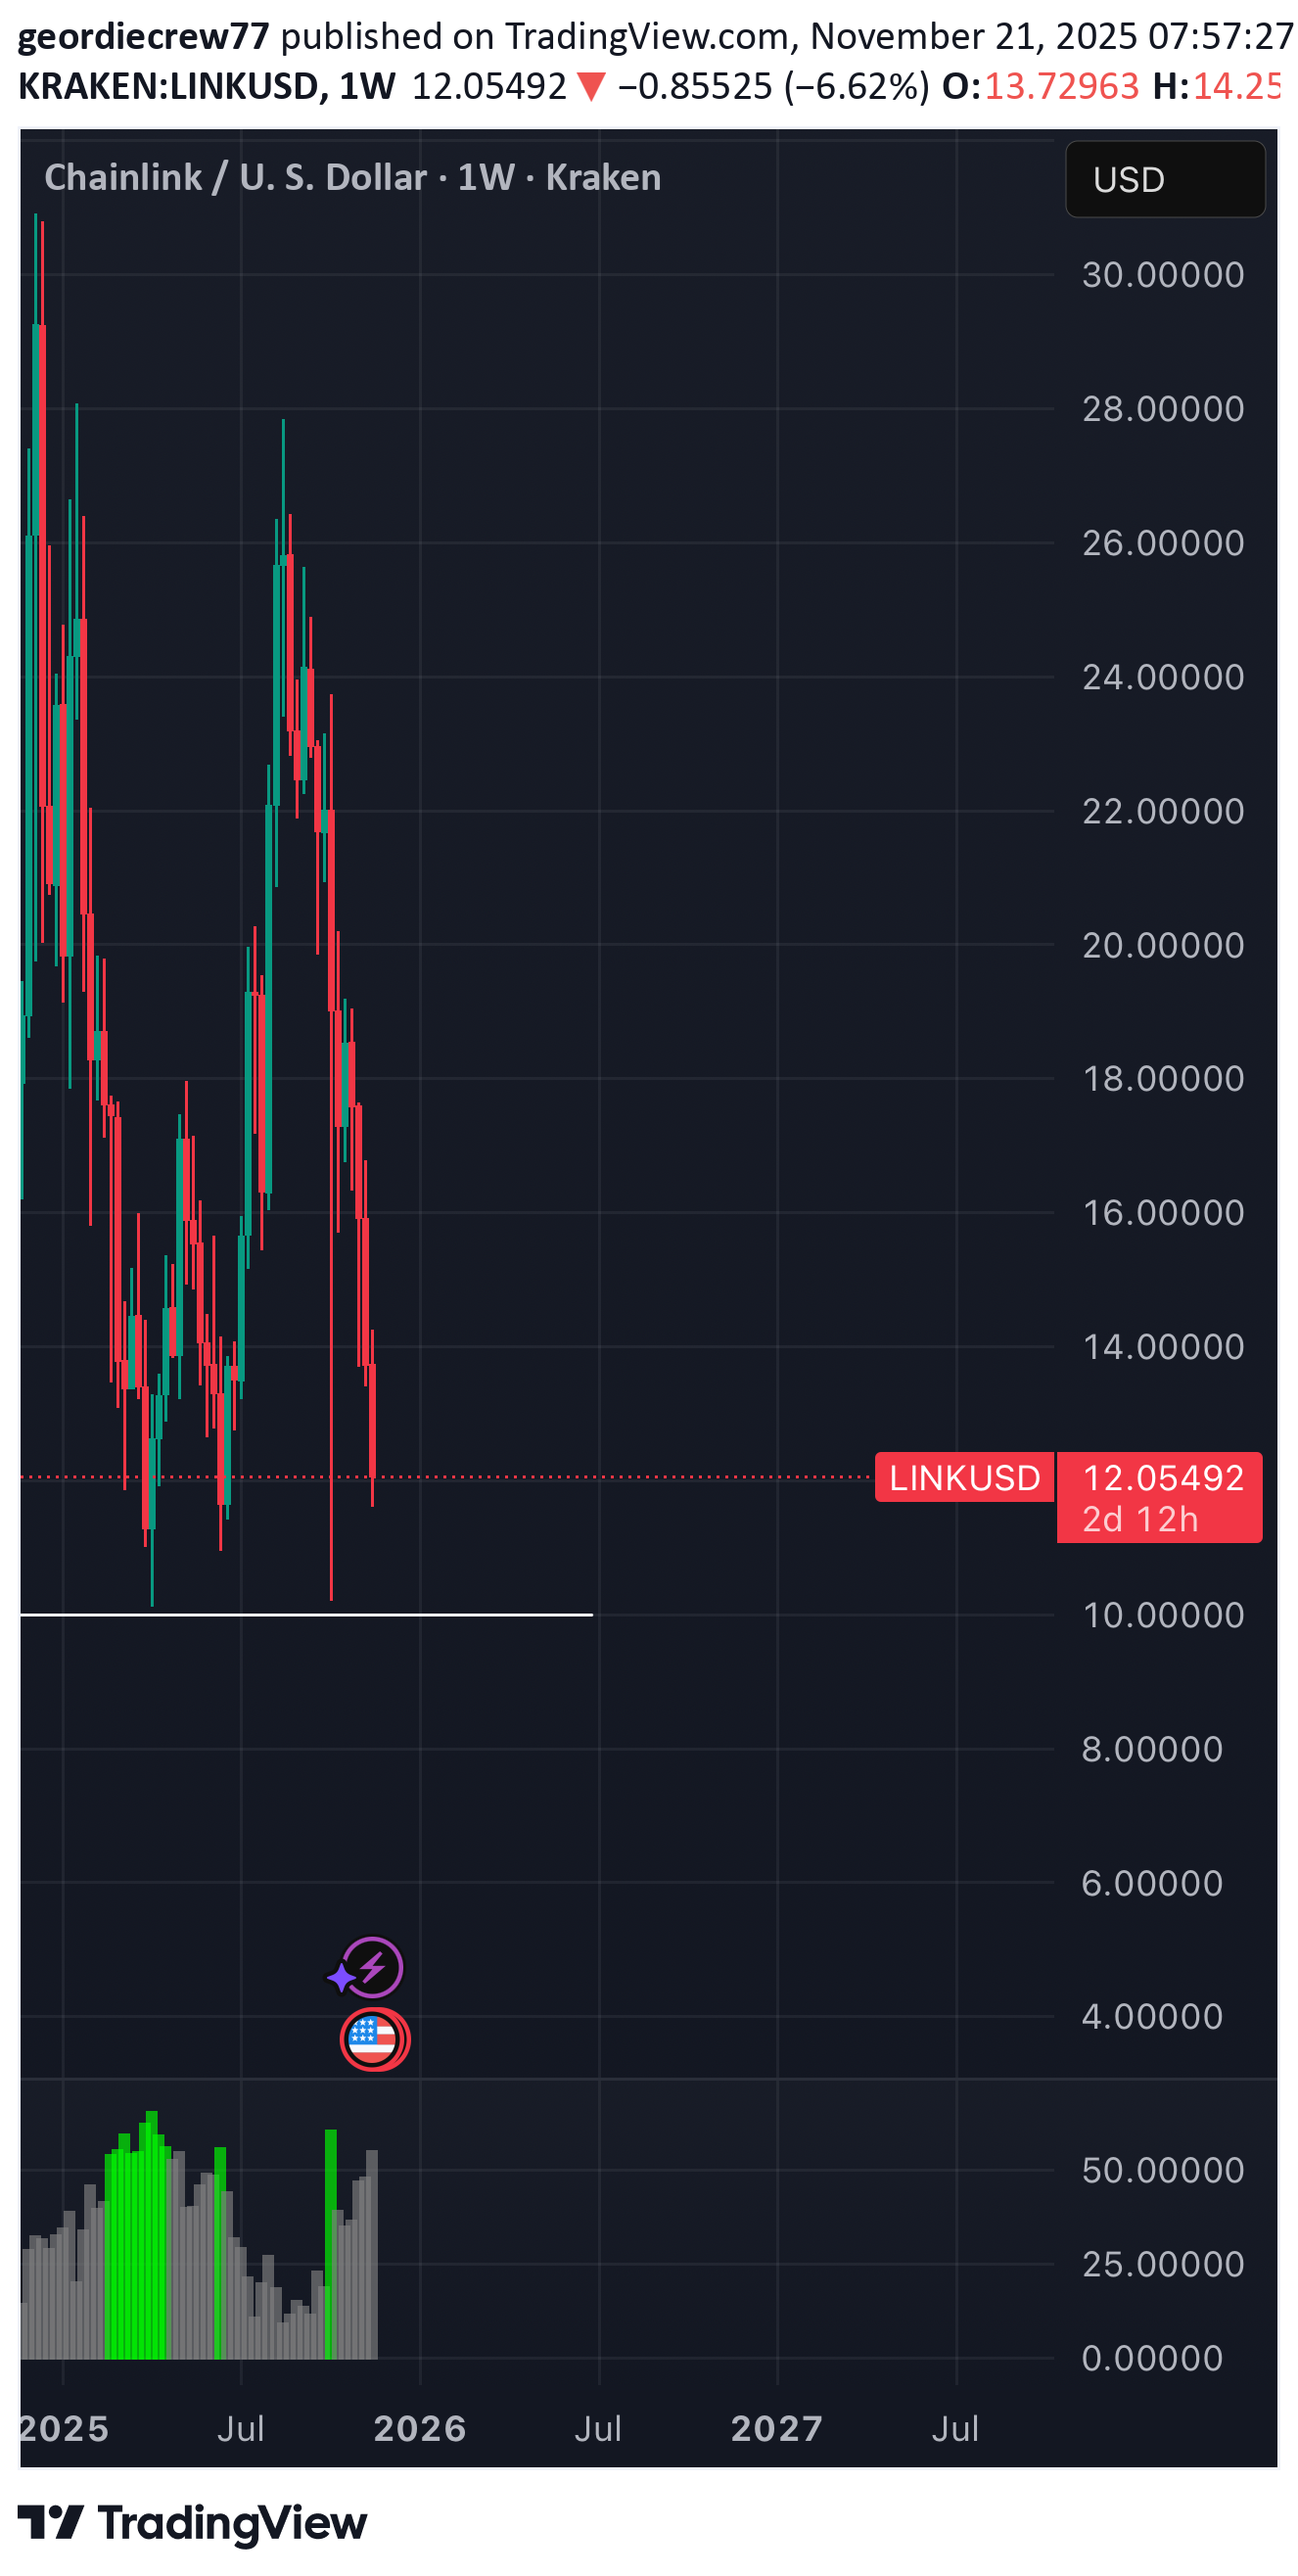
Chainlink حدود ۱۰ درصد تا محدوده خرید من فاصله دارد. چندین سطح حمایت و مقاومت قبلی، حمایت بسیار قویای را در حوالی ۱۰ دلار فراهم کرد. وقتی دیگران میترسند، حریص باشید.

BULLSTAR1
لینک (Chainlink) روی حمایت تاریخی: آیا آماده جهش قدرتمند بعدی است؟
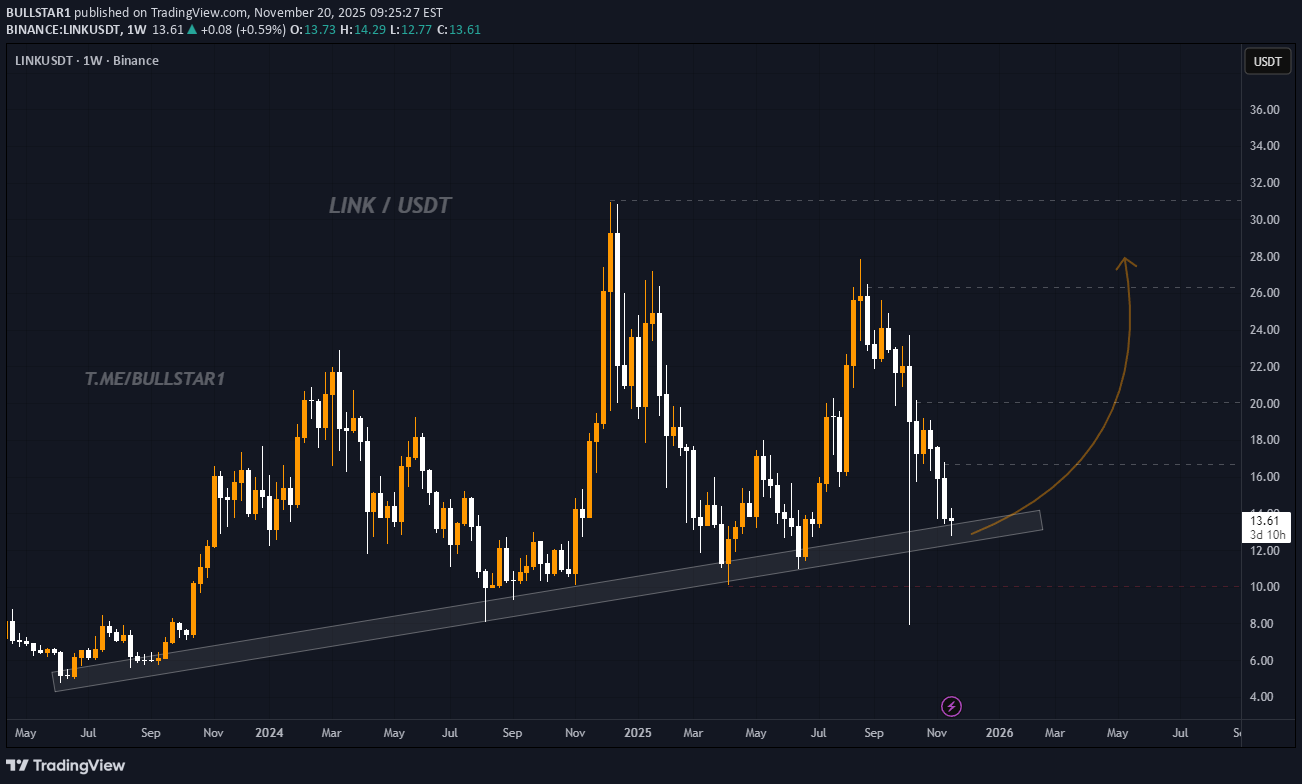
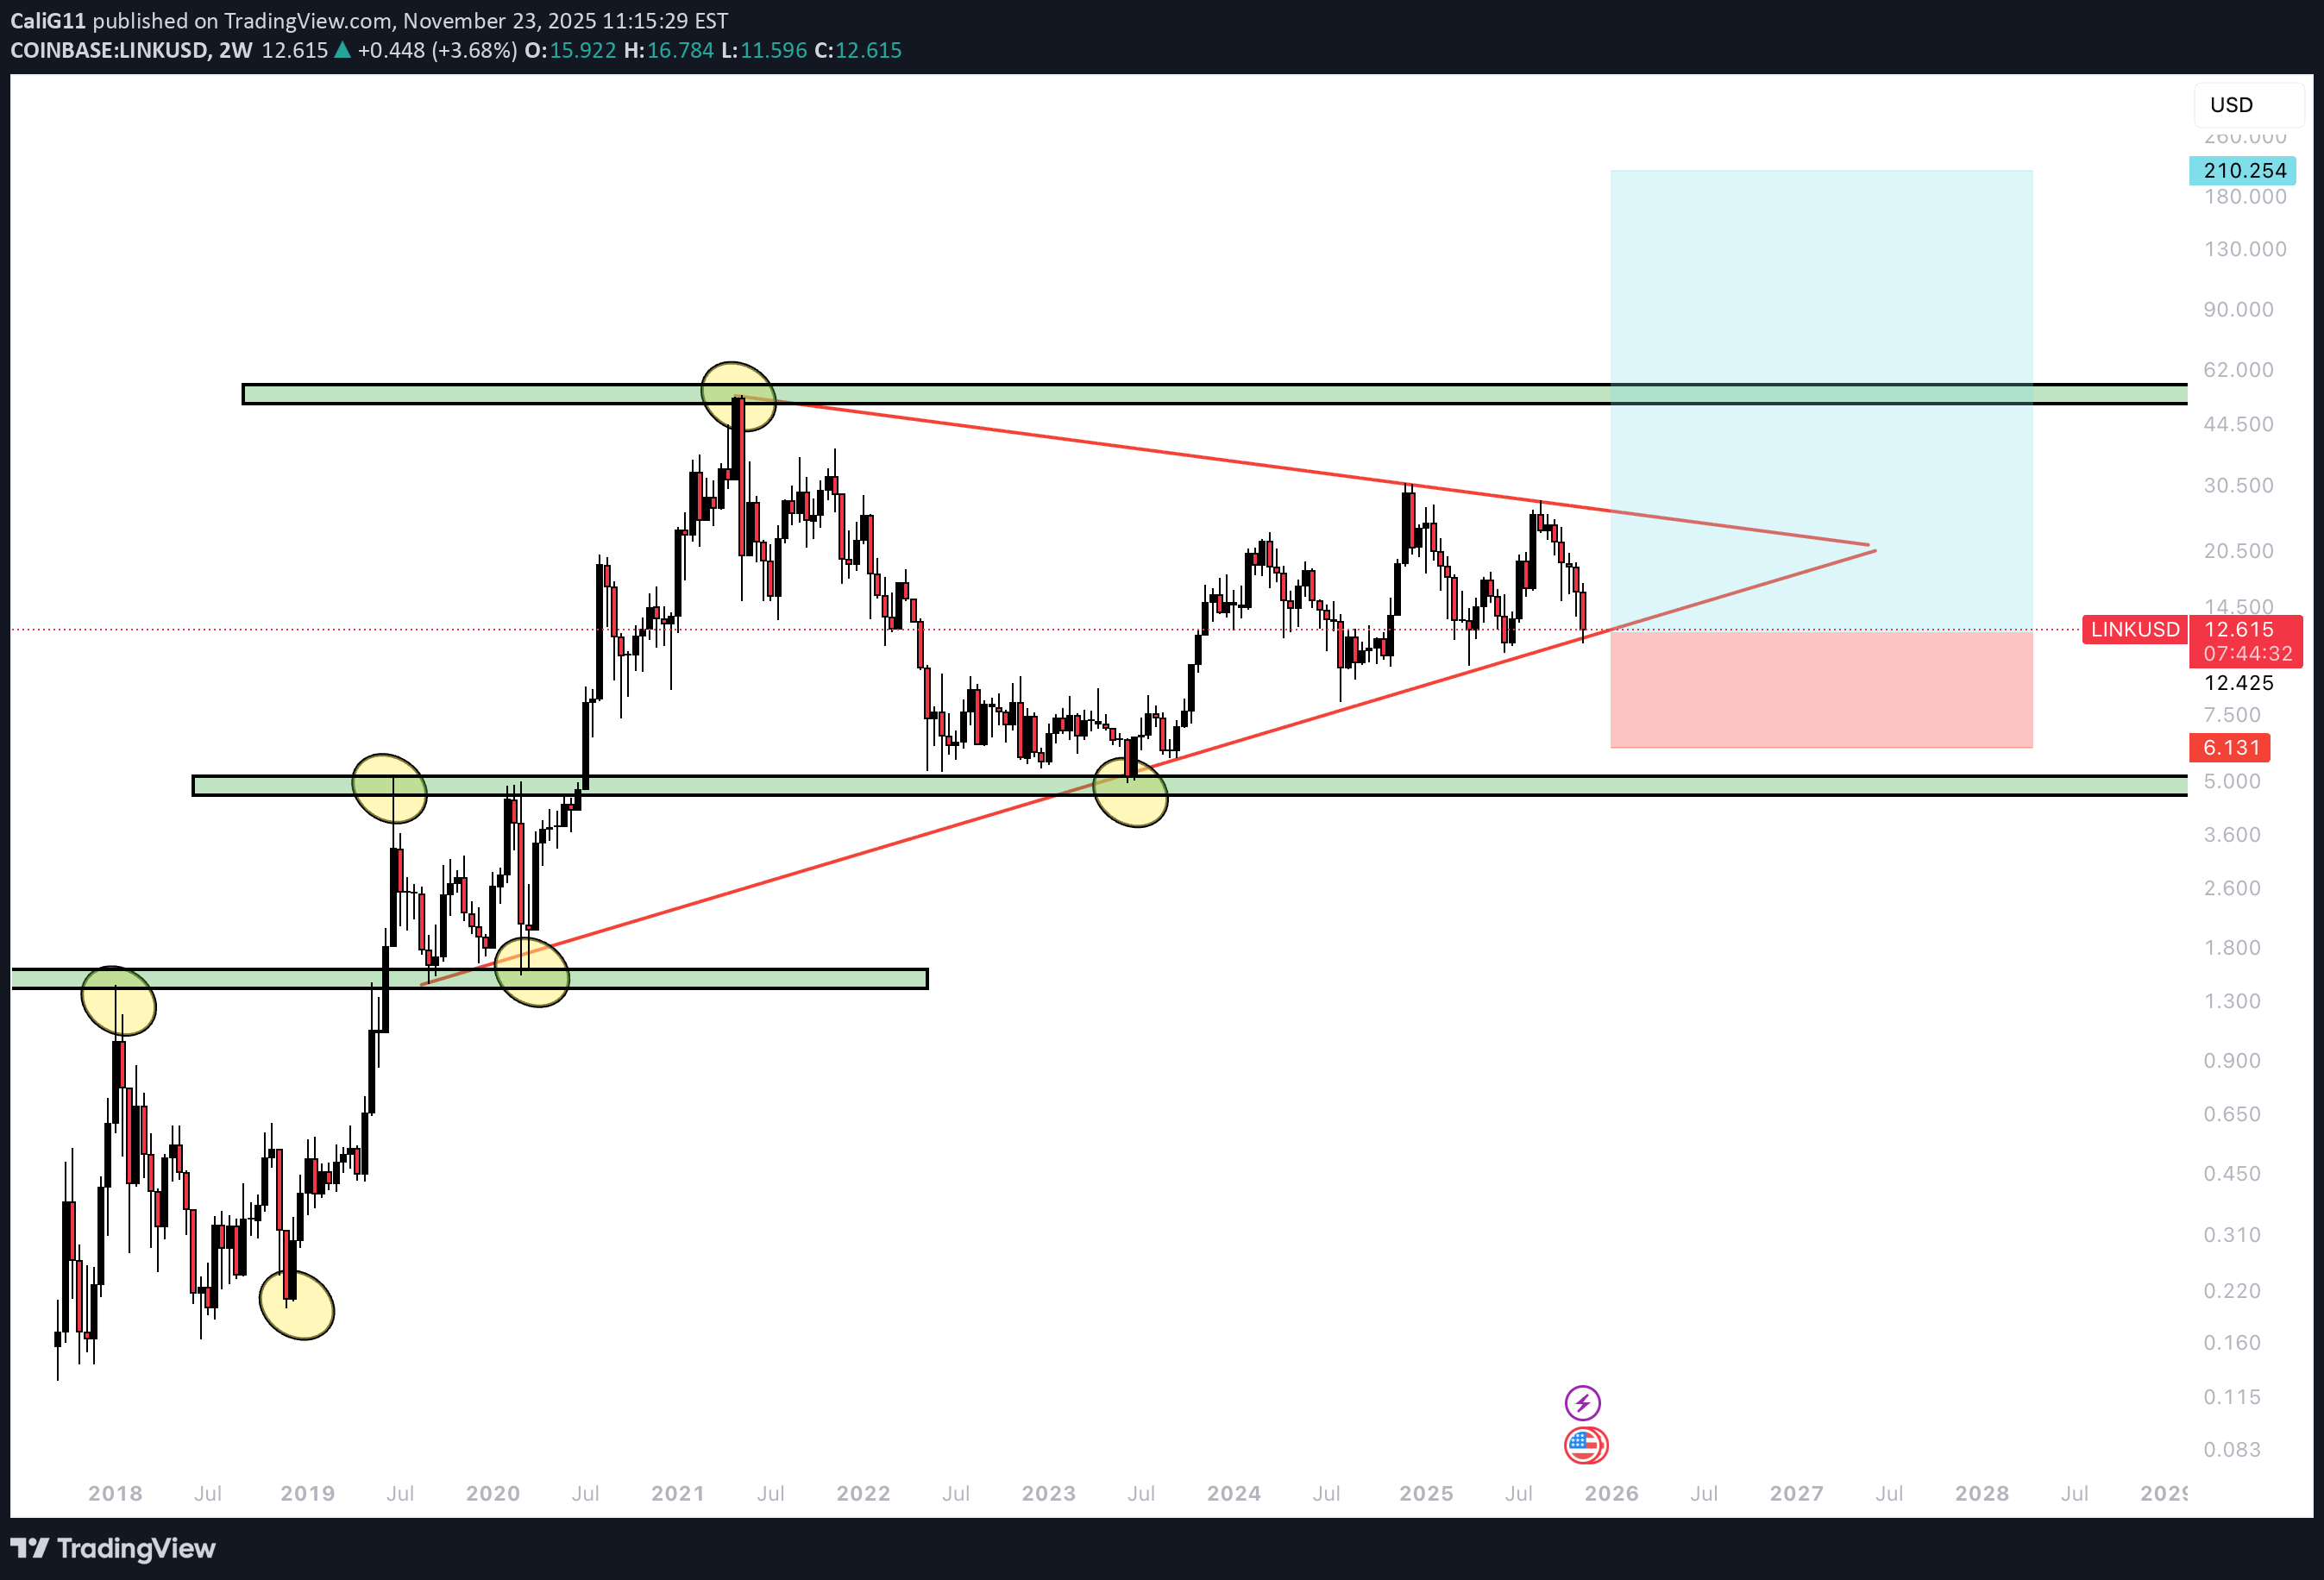
Chainlink در حال حاضر در حال تست مجدد یک خط روند صعودی هفتگی بلندمدت است که از اواسط سال ۲۰۲۳ به عنوان یک ناحیه حمایتی major عمل کرده است. هر بار که قیمت در گذشته این خط روند را لمس کرده، یک واکنش صعودی قوی ایجاد شده است. قیمت بار دیگر به این سطح کلیدی در حوالی محدوده ۱۳ بازگشته و علائم اولیه تثبیت را نشان میدهد. تا زمانی که ساختار هفتگی بالاتر از خط روند حفظ شود، LINK دیدگاه کلان صعودی خود را حفظ کرد. انتظار یک جهش تدریجی از این ناحیه حمایتی و به دنبال آن ادامه حرکت به سمت سطوح مقاومتی major بعدی را دارم. سناریوی صعودی در صورتی قویتر میشود که کندلهای هفتگی بالاتر از سقفهای محلی اخیر بسته شوند. سطوح کلیدی که باید در سمت بالا مراقب بود، نزدیک ۱۸، ۲۲ و ۲۶ هستند. شکست به زیر خط روند، سناریو را باطل کرده و راه را برای نزول عمیقتر باز میکند، با این حال ساختار فعلی به نفع خریداران است. این ایده بر اساس حمایت خط روند بلندمدت، ساختار تایمفریم بالاتر، و واکنش تاریخی مکرر از این سطح بنا شده است.
سلب مسئولیت
هر محتوا و مطالب مندرج در سایت و کانالهای رسمی ارتباطی سهمتو، جمعبندی نظرات و تحلیلهای شخصی و غیر تعهد آور بوده و هیچگونه توصیهای مبنی بر خرید، فروش، ورود و یا خروج از بازارهای مالی نمی باشد. همچنین کلیه اخبار و تحلیلهای مندرج در سایت و کانالها، صرفا بازنشر اطلاعات از منابع رسمی و غیر رسمی داخلی و خارجی است و بدیهی است استفاده کنندگان محتوای مذکور، مسئول پیگیری و حصول اطمینان از اصالت و درستی مطالب هستند. از این رو ضمن سلب مسئولیت اعلام میدارد مسئولیت هرنوع تصمیم گیری و اقدام و سود و زیان احتمالی در بازار سرمایه و ارز دیجیتال، با شخص معامله گر است.