
cryptodailyuk
@t_cryptodailyuk

تریدر چه نمادی را توصیه به خرید کرده؟
سابقه خرید
تخمین بازدهی ماه به ماه تریدر
پیام های تریدر
فیلتر
نوع پیام
cryptodailyuk
TECHNICAL ANALYSIS BNB/USDT
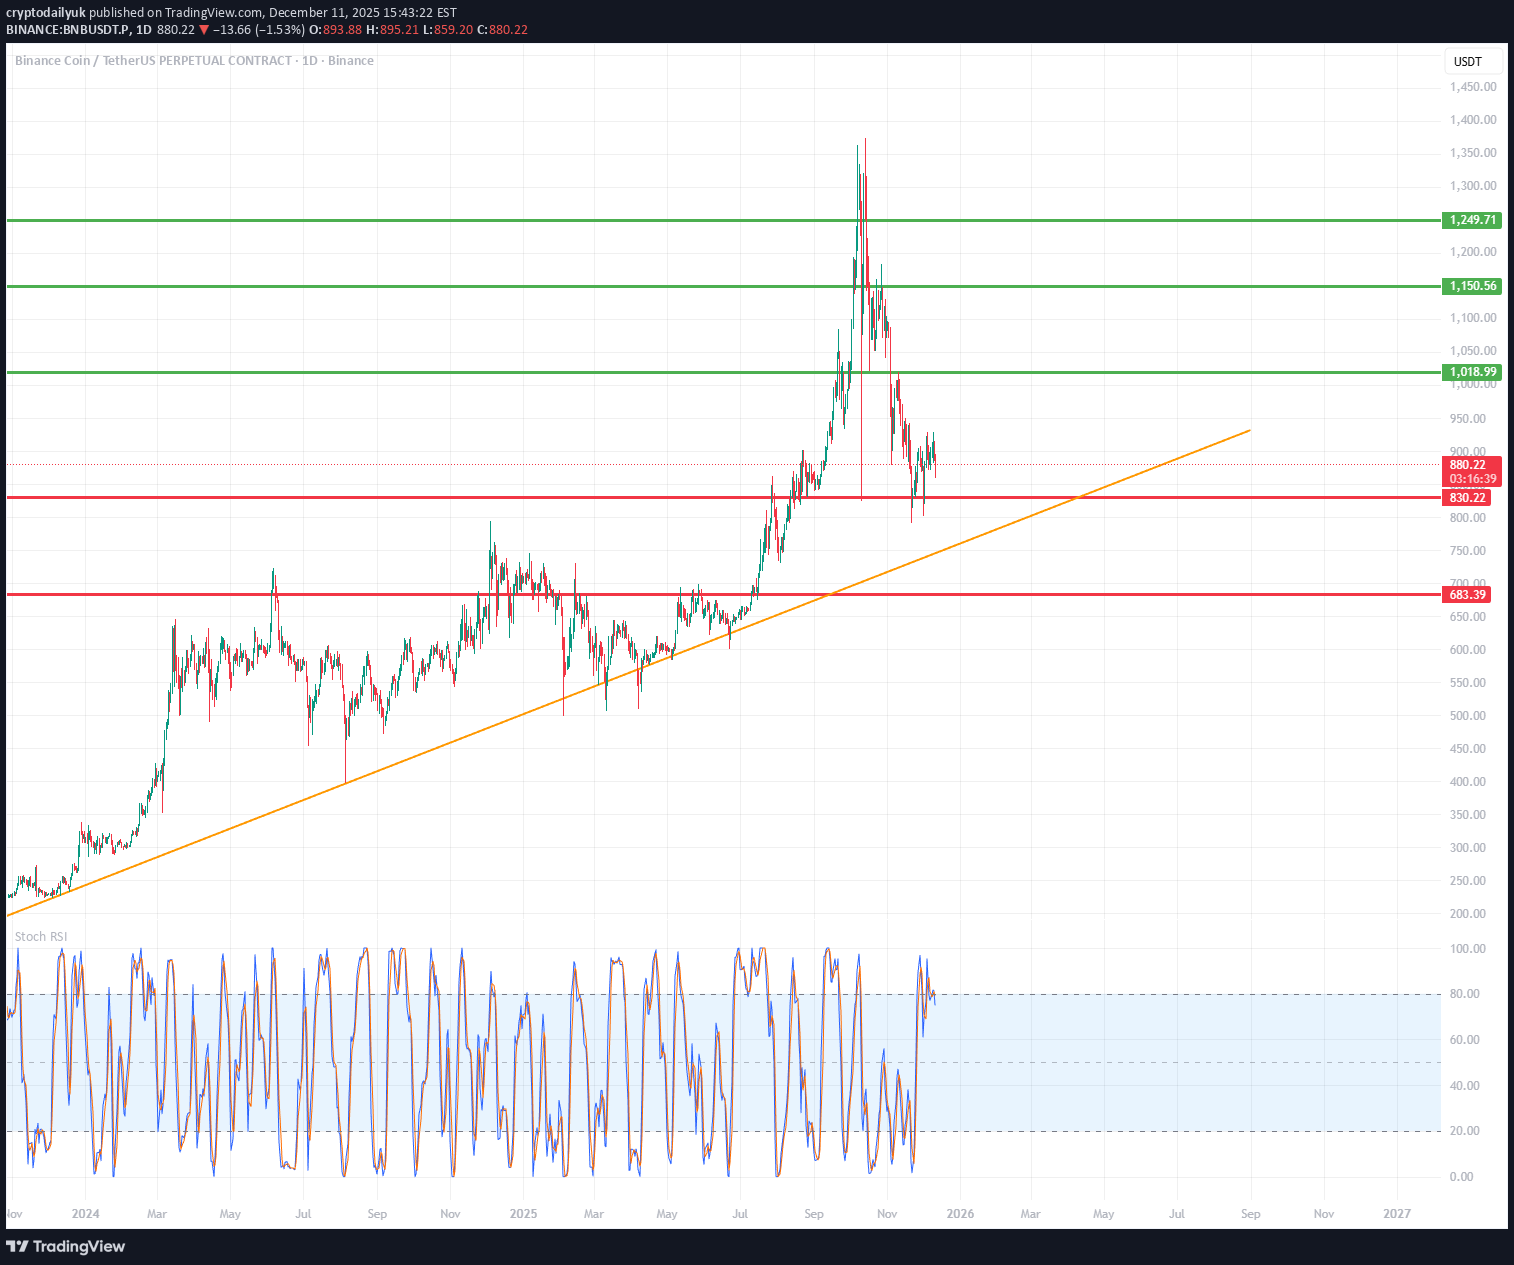
1️⃣ ساختار و روند بازار نمودار یک روند صعودی بلندمدت را نشان می دهد که توسط یک خط روند صعودی بسیار تمیز (نارنجی) تایید شده است، که بیش از یک سال است که به عنوان پشتیبان پویا عمل می کند. پس از شکست قوی تا 1380، قیمت شروع به اصلاح کرد اما همچنان ساختار پایین بالاتر را نشکند → روند صعودی دست نخورده است. 2️⃣ سطوح کلیدی (دقیقا از نمودار شما) سطوح مقاومت (سبز): ~ 1018 USDT ~ 1150 USDT ~ 1249 USDT اینها اهداف بالقوه برای یک روند صعودی مجدد هستند. 🔴 سطوح پشتیبانی (red): ~ 879 USDT - نزدیکترین پشتیبانی مهم ~ 838 USDT - یک سطح دفاعی کلیدی ~683 USDT - deep پشتیبانی / آخرین خط روند HTF قیمت در حال حاضر مستقیماً بالاتر از سطح حمایت اول معامله می شود. 3️⃣ خط روند (نارنجی) خط روند شما این است: قوی، چند نقطه ای در بازه زمانی D1 ترسیم شده است در حال حاضر حدود 850-880 USDT ➡️ اگر قیمت کاهش پیدا کند، خط روند کاملاً با منطقه ۸۳۸–۸۷۹ همسو میشود و این منطقه را به عنوان یک «ضربه دفاع» تقویت میکند. 4️⃣ نوسانگرها - Stoch RSI (پایین) در حال حاضر: نوسانگر در یک منطقه بالا (بالاتر از 80) است → نشان دهنده بیش از حد خرید محلی با این حال، هنوز هیچ کراس اوور نزولی مشخصی وجود ندارد. معنی: 👉 حرکت صعودی همچنان فعال است، اما ما به اوج محلی نزدیکتر هستیم تا پایین. 5️⃣ سناریوها سناریوی صعودی (تا زمانی که خط روند ادامه داشته باشد محتمل تر است) شرایط: حفظ سطوح 879/838 و خط روند. اهداف: 1018 USDT – اولین مقاومت 1150 USDT - مقاومت میان مدت مهم 1249 USDT - هدف اصلی HTF هرچه قیمت بیشتر از خط روند نارنجی تثبیت شود، احتمال حمله مجدد در 1150-1249 بیشتر می شود. 🔴 سناریوی منفی (کمتر محتمل، اما حیاتی) شرایط: شکست نزولی 838 USDT و بسته شدن کندل D1 در زیر خط روند. سپس: بازار می تواند وارد مرحله اصلاح عمیق تری شود هدف، سطح 683 USDT بود - این همچنین سطح حمایت اصلی است، جایی که واکنشها قبلا قوی بود. این یک سناریوی "کاپیتولاسیون" است، اما با توجه به عملکرد فعلی قیمت، به نظر نمی رسد غالب باشد. 6️⃣ در نمودار "اینجا و اکنون" چه چیزی را می توانیم ببینیم؟ ✔️ قیمت از پایین ترین سطح داخلی بازگشته است ✔️ همچنان بین حمایت 879 و مقاومت 1018 است ✔️ روند صعودی دست نخورده است ✔️ یک HTF بالقوه پایین تر تشکیل شده است ✔️ استوک RSI حرکت را نشان می دهد، اما احتیاط لازم است ➡️ بازار در روند صعودی در حال تثبیت است، با احتمال بالایی برای شکست به سمت بالا - به شرط حفظ حمایت.
cryptodailyuk
تحلیل تکنیکال بیت کوین (4 ساعته): سطوح کلیدی و سناریوهای صعودی/نزولی آینده
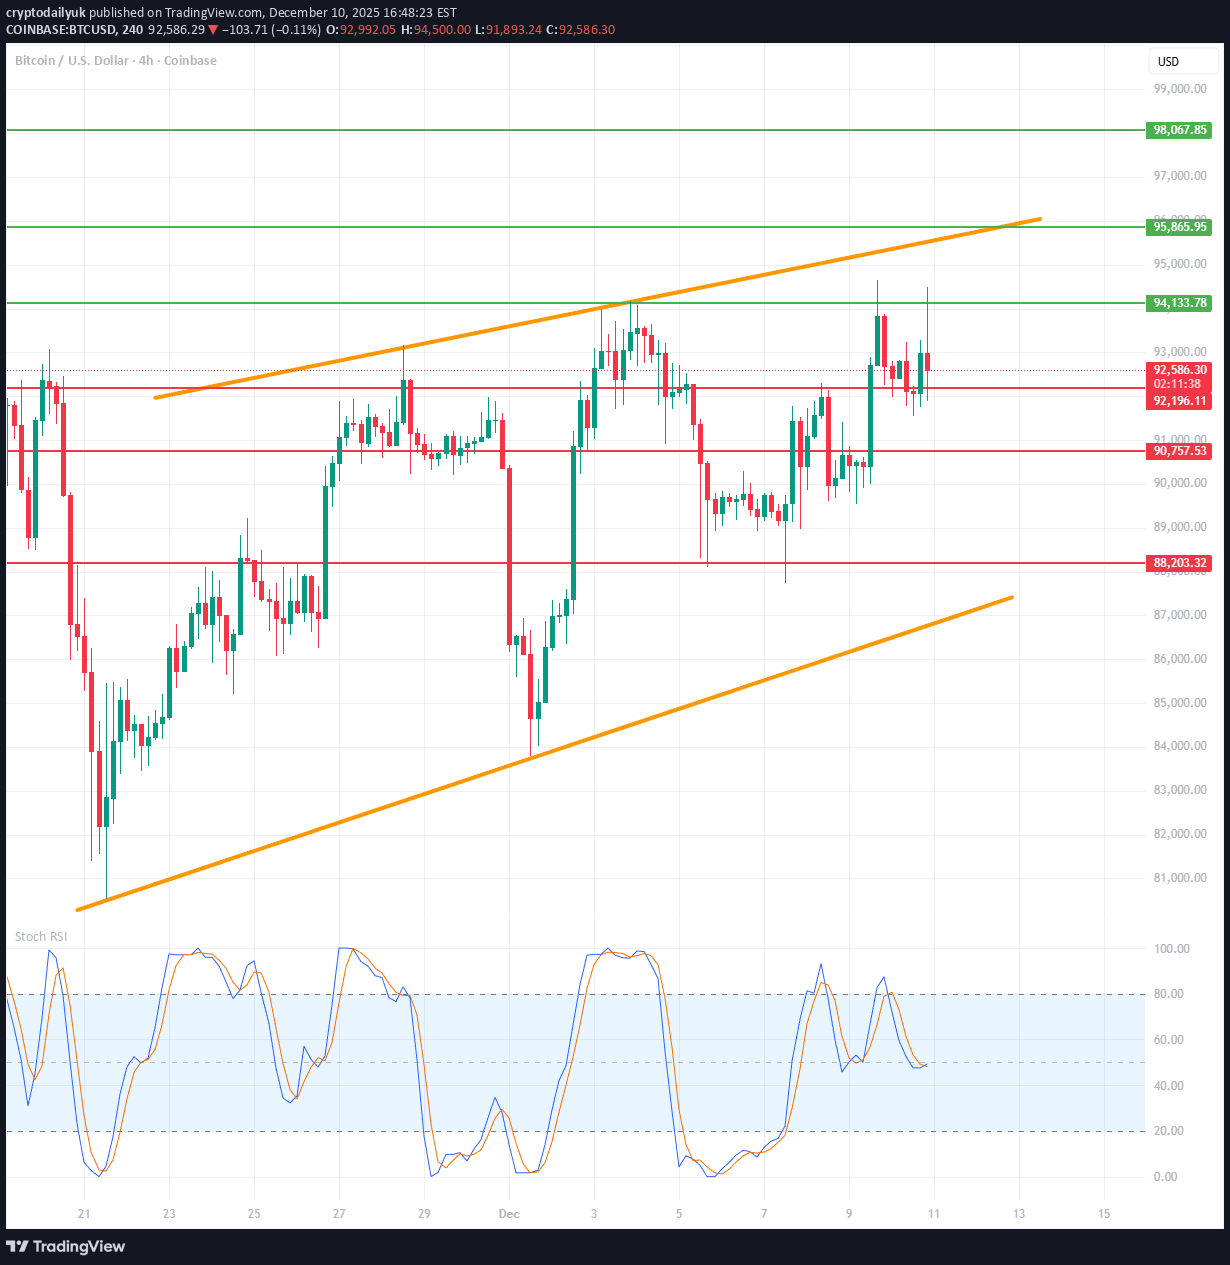
1. ساختار بازار: کانال صعودی (نارنجی) نمودار به وضوح یک کانال روند صعودی را نشان می دهد - خطوط نارنجی بالا و پایین. پشتیبانی از کانال پایین: ~ 87000 دلار مقاومت کانال بالایی: ~ 96000 دلار روند میان مدت = روند صعودی تا زمانی که قیمت در این کانال باقی بماند. 2. سطوح کلیدی که علامت گذاری کرده اید مقاومت 94,133 دلار - مقاومت محلی که قیمت اخیراً از آن رد شده است. 95,866 دلار – مرز بالایی ناحیه مقاومت + خط کانال نزدیک به بالایی. 99,067 دلار - هدف بالا در هنگام شکست کانال. پشتیبانی کنید 92,190 دلار - قیمت در حال حاضر در این منطقه است و برای حفظ آن تلاش می کند. 90,757 دلار - پشتیبانی مهم روزانه؛ شکست راه را پایین تر باز می کند. 88203 دلار - پشتیبانی قوی، همگرا با قسمت پایین کانال. 3. عمل قیمت در حال حاضر می بینم: رد شدن از سطح 94.1k که مقاومت است. سعی کنید به مرکز سازه برگردید، اما کندل از بالا رد می شود. بازار در کوتاهمدت به پایینتر ← تضعیف جزئی حرکت میپردازد. 4. Stoch RSI Stoch RSI (4 ساعت): خطوط نسبت به سطوح بالا روند نزولی دارند، به این معنی که یک اصلاح کوتاه مدت تازه شروع شده است. هنوز هیچ سیگنالی برای برگشت به سمت بالا وجود ندارد → حرکت به نفع move به سطوح حمایتی پایین تر است. ⭐ 5. سناریو برای ساعت های بعدی / 1-2 روز BULLISH (اگر BTC 92k-90.7k را حفظ کند) شرایط: بدون شکست زیر 90757 دلار حرکات بالقوه: ادغام در 92k-91k Stoch RSI شروع به خمیدگی به سمت بالا می کند حمله: 94,133 دلار 95,866 دلار (مقاومت کانال بالایی) هدف: → 96000 دلار → تست احتمالی 99000 دلار با شکست قوی BARISH (اگر BTC 90,757 دلار را کاهش دهد) این یک سطح کلیدی است. اگر شکست: کاهش سریع به 88203 دلار احتمال زیاد تست مجدد خط کانال پایین (~87k) این همچنان روند صعودی را از بین نمی برد، اما در را برای خرید پایین تر باز می کند.
cryptodailyuk
تحلیل تکنیکال اتریوم (ETH): آیا نوسان صعودی یک تله است؟ (بررسی سطوح کلیدی)
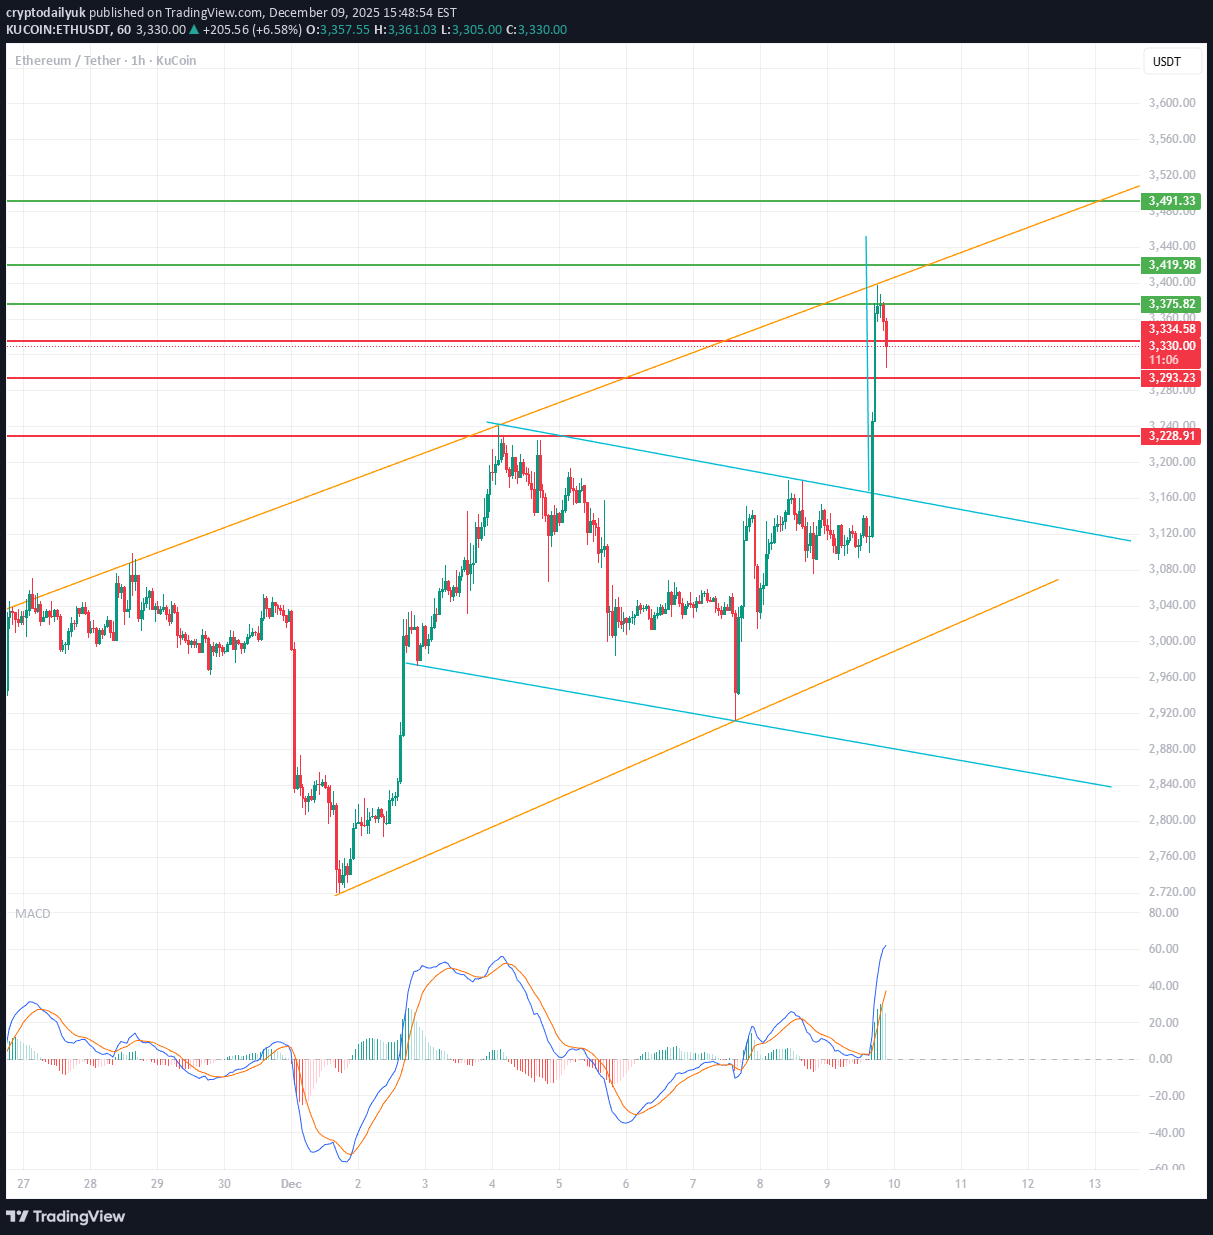
📊 ETH آنالیز - 1 ساعت 🔥 1. واقعیت کلیدی در نمودار ما یک انگیزه صعودی بسیار قوی داریم که: قسمت بالای band کانال نزولی را شکست (آبی) خط بالایی کانال صعودی را لمس کرد (نارنجی) بلافاصله رد شد (فتیله بلند) MACD بیش از حد خرید + واگرایی احتمالی در ساخت را نشان می دهد چنین move معمولاً نشاندهنده فشار کوتاه + کسب سود → یعنی تضعیف موقت و آزمایش مجدد شکست است. 🎯 2. مناطق قیمتی که در نمودار شما می بینم سبز (مقاومت/TP برای مدت طولانی): 3479-3490 - ارتفاعات ساختاری، مقاومت قوی 3420 - مقاومت محلی 3375 - اولین مقاومت واقعی پس از شکست Red (سطوح پشتیبانی/دفاع سازه): 3338-3348 - اولین منطقه آزمایش پس از شکست 3293 - سطح کلید - حفظ = ادامه روند 3180–3200 - منطقه ادغام شکسته شده است (احتمالاً مجدداً آزمایش کنید) 📉 3. فیتیله فعلی یعنی چه؟ این فیتیله غول پیکر سیگنال می دهد: انحلال های کوتاه مدت عدم تقاضا برای ادامه پس از اولین شکست مقاومت احتمال بازگشت به محدوده بالا امکان تست مجدد شکست (حدود 3185-3210) این شبیه یک شکست کلاسیک با ادامه به نظر نمی رسد، بلکه به نظر می رسد جعلی و نیاز به اصلاح است. 📈 4. سناریوها ➡️ صعودی (به احتمال زیاد اگر 3293 حفظ شود) قیمت به منطقه 3338-3293 کاهش می یابد یک HH/HL محلی می سازد یک move را به 3375 و سپس 3420 شروع می کند اگر 3420 شکست ← هدف 3480-3500 ➡️ نزولی (در صورت کاهش قیمت 3293) تست مجدد از پایین 3293 بازگشت به کانال آبی هدف: 3185–3200 اگر این سطح شکسته شود ← 3050–3080 (band پایین کانال) 📟 5. MACD MACD است: فوق العاده کشیده خط سیگنال شروع به فروپاشی می کند هیستوگرام پس از انفجار کاهش می یابد → این تقریباً همیشه به معنای افزایش روزانه داخلی + کاهش حمایت است.
cryptodailyuk
ETHUSD 1D chart
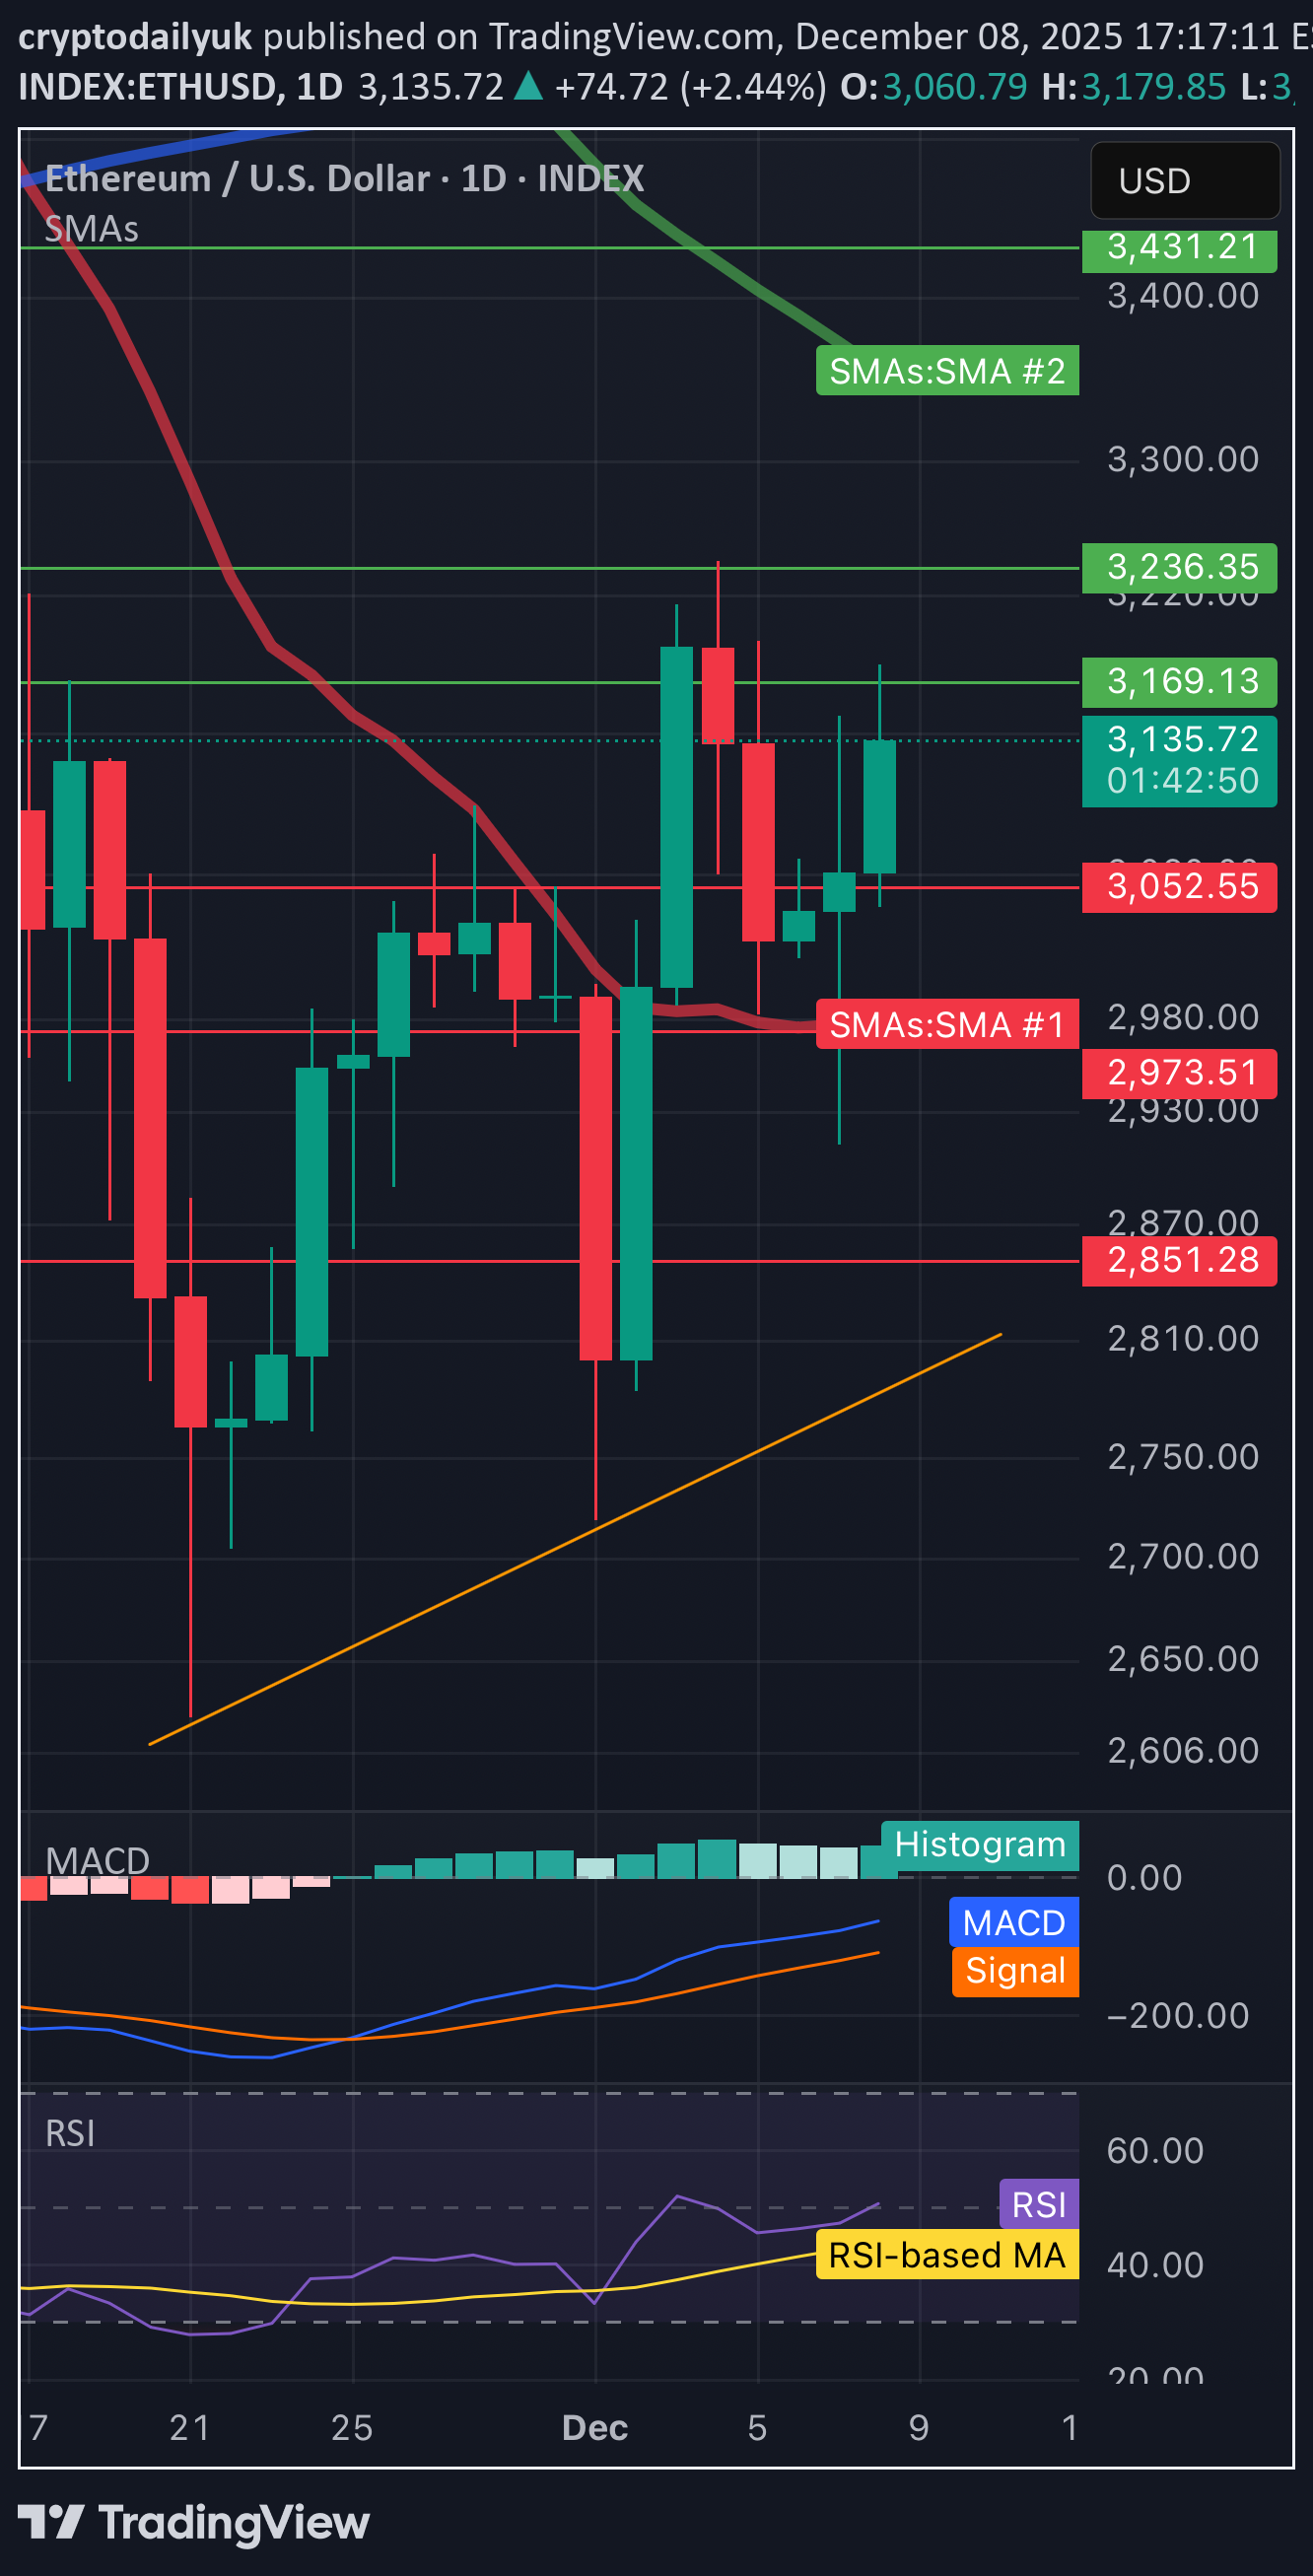
1️⃣ روند و سطوح کلیدی روند • روند کلی رشد خنثی، اما با تثبیت واضح. • قیمت به صورت پویا از پایین برگشت (تقریباً 2850 دلار)، که اولین ساختار پایین بالاتر را ایجاد می کند ← آغاز بالقوه یک تکانه رو به بالا. پشتیبانی کنید • 2973-3000 دلار – SMA #1 + پشتیبانی محلی. • 2851 دلار آمریکا – تکیه گاه قوی که از آن شمع یک فتیله بسیار بزرگ به سمت بالا می سازد. مقاومت ها • 3,169 دلار – اولین مقاومت قوی، چندین شمع از این سطح برگشتند. • 3236 دلار – مقاومت کلیدی روزانه. Breakout = سیگنال حرکت قوی و باز کردن راه به دلار 3,300-3,430. ⸻ 2️⃣ شمع سازی و رفتار • یک شمع صعودی با فتیله پایینی بلند ظاهر شد ← این علامت خریداران است. • قیمت در حال ایجاد یک سری از پایین ترین سطح ها است، اما هنوز به بالاترین سطح خود نرسیده است. ⸻ 3️⃣ SMA (میانگین متحرک) 🔴 SMA شماره 1 (کوتاه مدت) • قیمت درست بالاتر از آن است → به عنوان پشتیبانی عمل می کند. • اگر کندل روزانه زیر 3000 دلار بسته شود، حرکت نزولی باز می گردد. SMA #2 (بلند مدت، ~ 3430 دلار) • بالاتر از قیمت است → فشار نزولی بلند مدت تا زمانی که قیمت به منطقه قیمت بازگردد. ⸻ 4️⃣ RSI (تحرک) RSI حدود 45-50 • قلمرو بی طرف. • خرید و فروش بیش از حد صفر. • روند صعودی اندک در RSI → شتاب خریدار در حال رشد است، اما بدون سیگنال گرمای بیش از حد. نتیجهگیری: قبل از بالا رفتن RSI، بازار فضایی برای move بالاتر دارد. ⸻ 5️⃣ MACD • MACD بالای خط سیگنال → سیگنال صعودی خفیف و اولیه است. • هیستوگرام افزایش می یابد، اما شتاب قابل توجهی وجود ندارد. تفسیر: افزایش ممکن است، اما بدون حرکت قوی هنوز.
cryptodailyuk
تحلیل بیت کوین (BTC/USDT): فرصت صعود به کانال 94,500 دلار یا ریزش؟
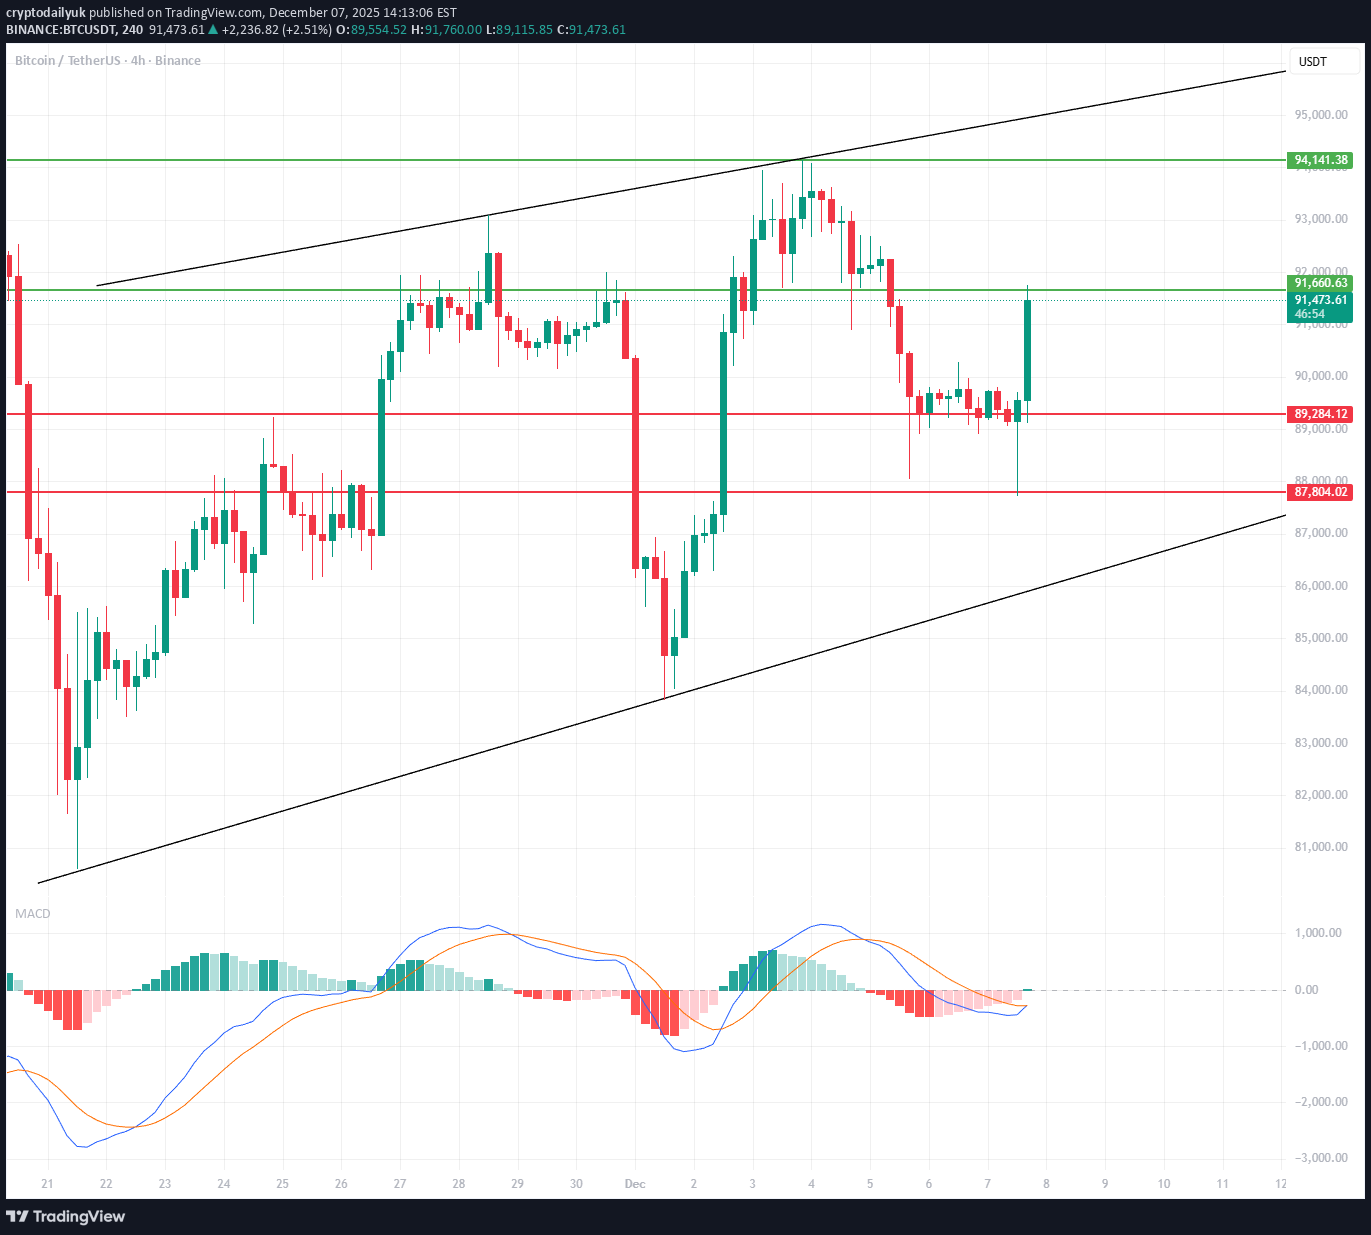
🔍 ساختار بازار نمودار یک کانال صعودی گسترده را نشان می دهد که در آن BTC برای چندین روز در حال حرکت بوده است: پشتیبانی از روند پایین تر: ~ 87,500 تا 88,000 دلار خط روند بالایی: ~ 94,500 تا 95,000 دلار قیمت به وضوح از حدود 89200 دلار که سطح تقاضای مهمی است، بازگشته است. 📈 سطوح کلیدی پشتیبانی کنید 89,284 دلار - پشتیبانی محلی که از آن یک بازگشت رخ داد 87,804 دلار - سطح پشتیبانی بعدی و بسیار قوی تر مطابق با خط روند مقاومت 91,466 دلار - در حال حاضر در حال آزمایش است 94,141 دلار – مقاومت کلید و قسمت بالای کانال band 📊 وضعیت نمودار (4 ساعت) 1. عمل قیمت قیمت از حمایت 89280 دلاری، یک انگیزه صعودی قوی ایجاد کرده است. در حال حاضر به مقاومت محلی 91450 تا 91700 دلار رسیده است. اگر این سطح شکسته شود، هدف 94000 تا 94500 دلار است. اگر شکست بخورد، می توان انتظار عقب نشینی به 90200 USD/89300 USD را داشت. 📉 MACD MACD شما نشان می دهد: متقاطع صعودی - سیگنال خرید. هیستوگرام از red به سبز تغییر می کند → تکانه در حال افزایش است. منحنی ها در حال واگرایی هستند و قدرت move را تایید می کنند. این نشان می دهد که روند کوتاه مدت صعودی است. 📌 دو سناریو معاملاتی 🢢 سناریوی صعودی (به احتمال زیاد) وضعیت: شکست شمع H4 و بسته شدن بالای 91700 دلار. اهداف: TP1 → 92,800 دلار – 93,200 دلار TP2 → 94000 USD - 94500 USD (کانال بالایی) توقف ضرر (اگر قصد داشتید طولانی باشید): زیر 90500 دلار ایمن تر زیر 89280 دلار آمریکا MACD این سناریو را تایید می کند. 🔴 سناریوی نزولی شرط: رد 91700 دلار و بسته شدن زیر 90500 دلار. اهداف: TP1 → 89300 دلار آمریکا TP2 → 87800 دلار آمریکا (خط روند کلیدی) کاهش به 87800 دلار مکان ایده آلی برای بازیکنان بزرگ برای خرید مجدد بود.
cryptodailyuk
تحلیل نمودار 4 ساعته بیت کوین (BTC/USDT): آیا ریزش ادامه دارد؟ (سطوح کلیدی حمایت و مقاومت)
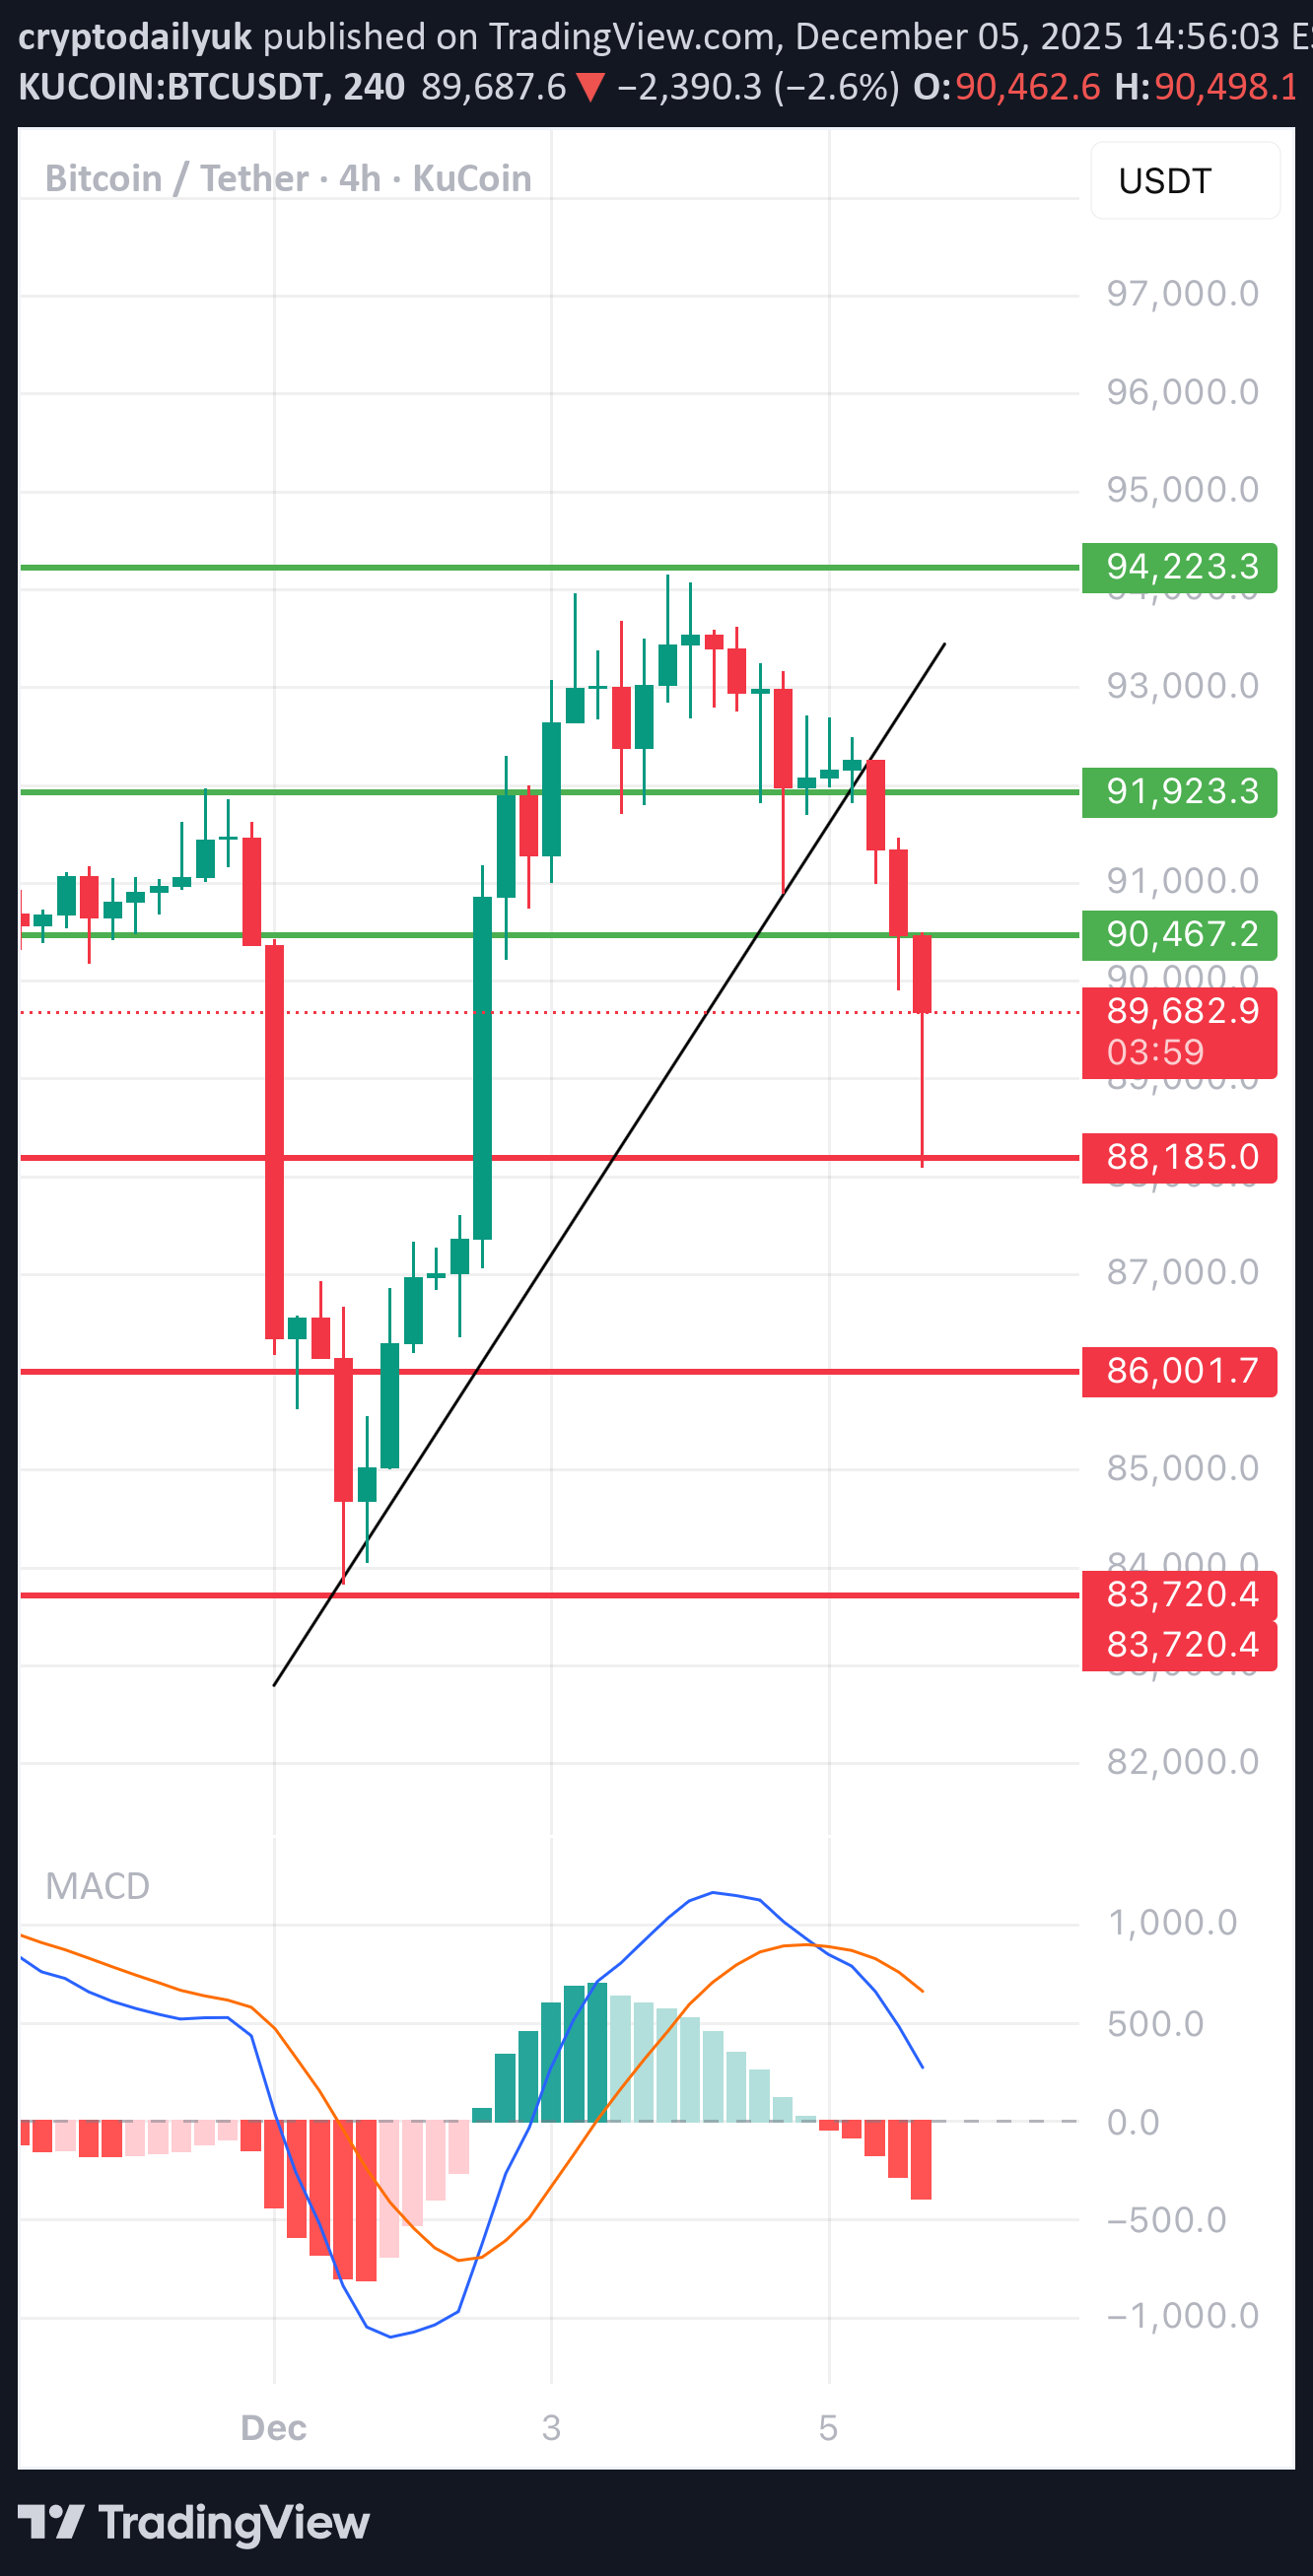
📉 ۱. ساختار بازار – روند کوتاهمدت ۴ ساعته آنچه در نمودار میبینم: • شکستن خط روند صعودی (قطر سیاه) – یک سیگنال کلاسیک برای تضعیف شتاب (مومنتوم). • پس از شکست، یک شتاب نزولی نسبتاً قوی رخ داده است، که تأیید میکند روند داخل روز (اینترادی) به سمت نزولی تغییر کرده است. • قیمت در حال حاضر محدوده ۸۹,۵۰۰ تا ۹۰,۰۰۰ دلار آمریکا (USDT) را تست میکند، جایی که واکنشی در حال شکلگیری است، اما هنوز قوی نیست. 👈 نتیجهگیری: روند ۴ ساعته اکنون در یک اصلاح نزولی (Bearish Correction) قرار دارد و به نظر میرسد بازار آماده تست حمایتهای پایینتر باشد. ⸻ 🧭 ۲. سطوح حمایت و مقاومت (از نمودار شما) حمایتهای پیش رو: ۱. ۸۹,۵۰۰–۸۹,۰۰۰ – سطح فعلی که بازار در تلاش است از خود دفاع کند. ۲. ۸۸,۱۸۵ – خط واضح red، اولین حمایت منطقی پایینتر. ۳. ۸۶,۰۰۱ – سطح تقاضای بعدی، کندل بزرگ از گذشته. ۴. ۸۳,۷۲۰ – حمایت عمیقتر که بازار هنگام ترس شدید به آن باز میگردد. نزدیکترین مقاومتها (که برای بازگشت به رشد، نیاز به بازیابی دارند): ۱. ۹۰,۴۶۷ – اولین مقاومت کلیدی؛ اکنون به عنوان یک سطح «تغییر نقش» (flip) عمل کرد. ۲. ۹۱,۹۲۳ – مقاومت قویتر؛ اینجا نقطهای است که کاهشها از آنجا شروع شد. ۳. ۹۴,۲۲۳ – تنها شکستن این سطح نشان میدهد که گاوها (خریداران) بازگشتهاند. 👈 در حال حاضر، بازار زیر مقاومت کلیدی ۹۰,۴۶۷ قرار دارد، بنابراین فشار نزولی فعال است. ⸻ 📉 ۳. تحلیل کندلها و رفتار قیمت • ۴-۶ کندل آخر دارای بدنههای بزرگ red هستند، که نشاندهنده غلبه واضح عرضه است. • پس از شکست خط روند، پولبک (بازگشت به عقب) قوی وجود ندارد – این بدان معناست که خرسها (فروشندگان) اجازه جهش را نمیدهند. • سایه پایینی در کندل آخر نشاندهنده واکنش خریدار است، اما هنوز تأیید نشده است. 👈 اگر ۸۹,۵۰۰ شکسته شود، یک move تا سطح ۸۸,۱۸۵ بسیار محتمل است. ⸻ 📉 ۴. ام.اِی.سی.دی (MACD) – سیگنال منفی MACD نشان میدهد: • تقاطع نزولی (Bearish Cross) – خط آبی از بالا خط نارنجی را قطع کرده است. • هیستوگرام تبدیل به نوارهای red میشود – شتاب نزولی در حال افزایش است. • MACD زیر صفر است ← تأیید روند نزولی در بازه ۴ ساعته. 👈 MACD آنچه را که در نمودار میبینیم تأیید میکند: شتاب در حال کاهش است و بازگشت بدون تجمیع (کنسالیدیشن) بعید است.
cryptodailyuk
تحلیل نمودار 4 ساعته بیت کوین: آیا کانال صعودی میشکند؟ (سطوح کلیدی 90,000 دلار)
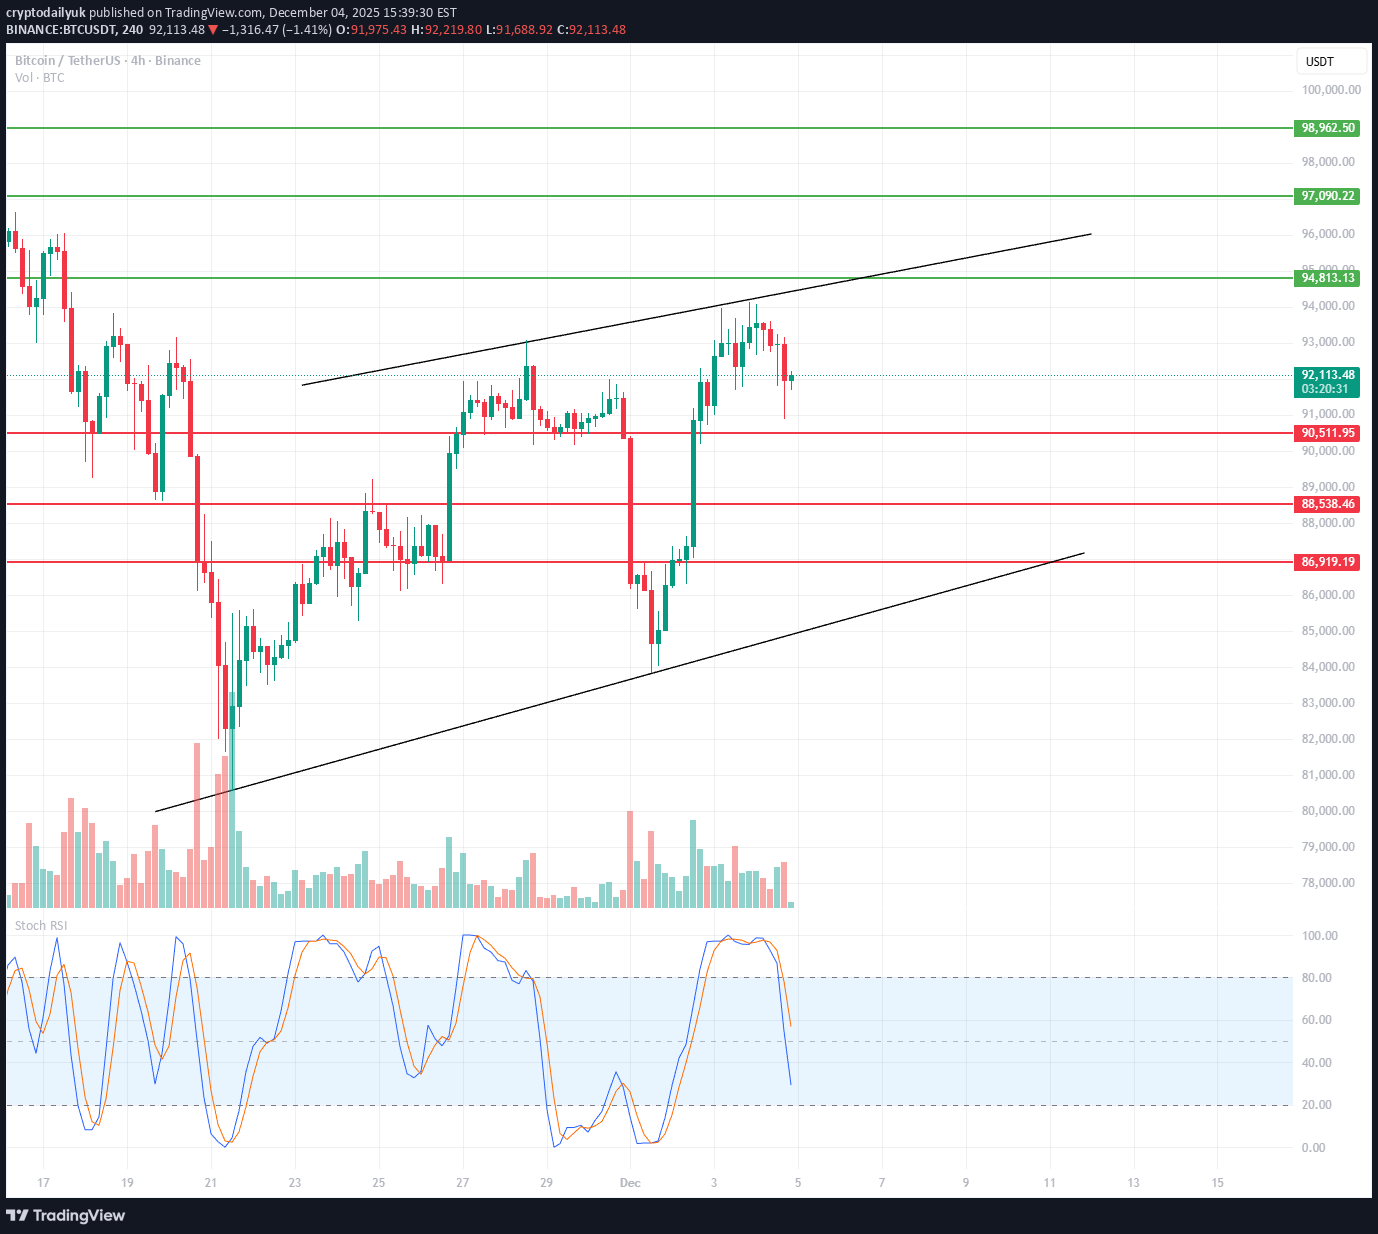
۱. ساختار بازار: کانال صعودی (گوه صعودی / کانال صعودی) نمودار به وضوح نشان میدهد که BTC در حال حرکت در یک کانال صعودی است، با: مرز بالایی در حدود ۹۵,۰۰۰ تا ۹۵,۵۰۰ دلار، مرز پایینی که در حال حاضر به ۸۶,۵۰۰ تا ۸۷,۰۰۰ دلار میرسد. این یک الگوی بالقوه فرسایشی است، و شکستهای (بریکاوتهای) پایینی اغلب پرقدرت (دینامیک) هستند. ۲. وضعیت فعلی: برگشت از band بالایی و استوکاستیک RSI در ناحیه اشباع خرید ← کاهش قیمت دقیقاً در مقاومت بالایی کانال متوقف شده و اصلاح را آغاز کرده است. این یک رفتار معمول است – بازار معمولاً به سمت میانه یا لبه پایینی کانال بازمیگردد. استوکاستیک RSI در تایم ۴ ساعته – یک برگشت قوی از منطقه اشباع خرید داشته است ← سیگنال برای یک اصلاح کوتاهمدت از قبل صادر شده است. ۳. سطوح حمایت (مهمترینها): 🔴 ۹۰,۵۰۰ تا ۹۰,۰۰۰ دلار یک منطقه بسیار مهم – مقاومت قبلی ← اکنون حمایت است. شکست (این سطح) = افزایش ریسک برای یک اصلاح عمیقتر. 🔴 ۸۸,۵۰۰ تا ۸۸,۰۰۰ دلار یک سطح تقاضای قوی برای دوره ۴ ساعته، که همچنین با میانگین متحرک (MA) و کفهای محلی همراستا است. 🔴 ۸۶,۵۰۰ تا ۸۷,۰۰۰ دلار band پایینی کانال – محتملترین مکان برای فعال شدن خریداران. ۴. سطوح مقاومت: 🟢 ۹۴,۸۰۰ دلار سقف محلی قبلی – شکسته شدن آن نشانگر روند صعودی بود. 🟢 ۹۸,۰۰۰ تا ۹۸,۹۰۰ دلار مقاومت قوی در نمودار، هدف محتمل پس از شکست کانال به سمت بالا. ۵. سناریوهای ساعات آتی: 📉 سناریوی اصلاحی (بر اساس استوکاستیک RSI محتملتر است) قیمت میتواند به یکی از مناطق زیر سقوط کند: ۹۲,۰۰۰ → آزمایش در حال انجام است ۹۰,۵۰۰ تا ۹۰,۰۰۰ دلار → سطح اصلی تصمیمگیری بازار اگر ۹۰,۰۰۰ را از دست بدهد ← یک move تا ۸۸,۵۰۰–۸۸,۰۰۰ طبیعی است. اصلاح عمیقتر: آزمایش خط پایینی کانال – حدود ۸۶,۵۰۰ دلار. در این سناریو، ما همچنان در یک روند صعودی باقی میمانیم، مگر اینکه کانال به سمت پایین شکسته شود. 📈 سناریوی روند صعودی کاهش فعلی تنها میتواند: یک اصلاح محلی باشد، یا یک بازآزمایی (رتست) منطقه تقاضای قبلی. شرط روند صعودی: ⬅️ بازگشت و بسته شدن کندل ۴ ساعته بالاتر از حدود ۹۴,۰۰۰ دلار. در این صورت اهداف: ۹۴,۸۰۰ ۹۵,۵۰۰ و پس از شکست کانال ← ۹۸,۰۰۰ تا ۹۹,۰۰۰ دلار.
cryptodailyuk
تحلیل بیت کوین BTC/USDT: سقوط ادامه دارد؟ سطوح کلیدی 79 هزار و 75 هزار کجاست؟
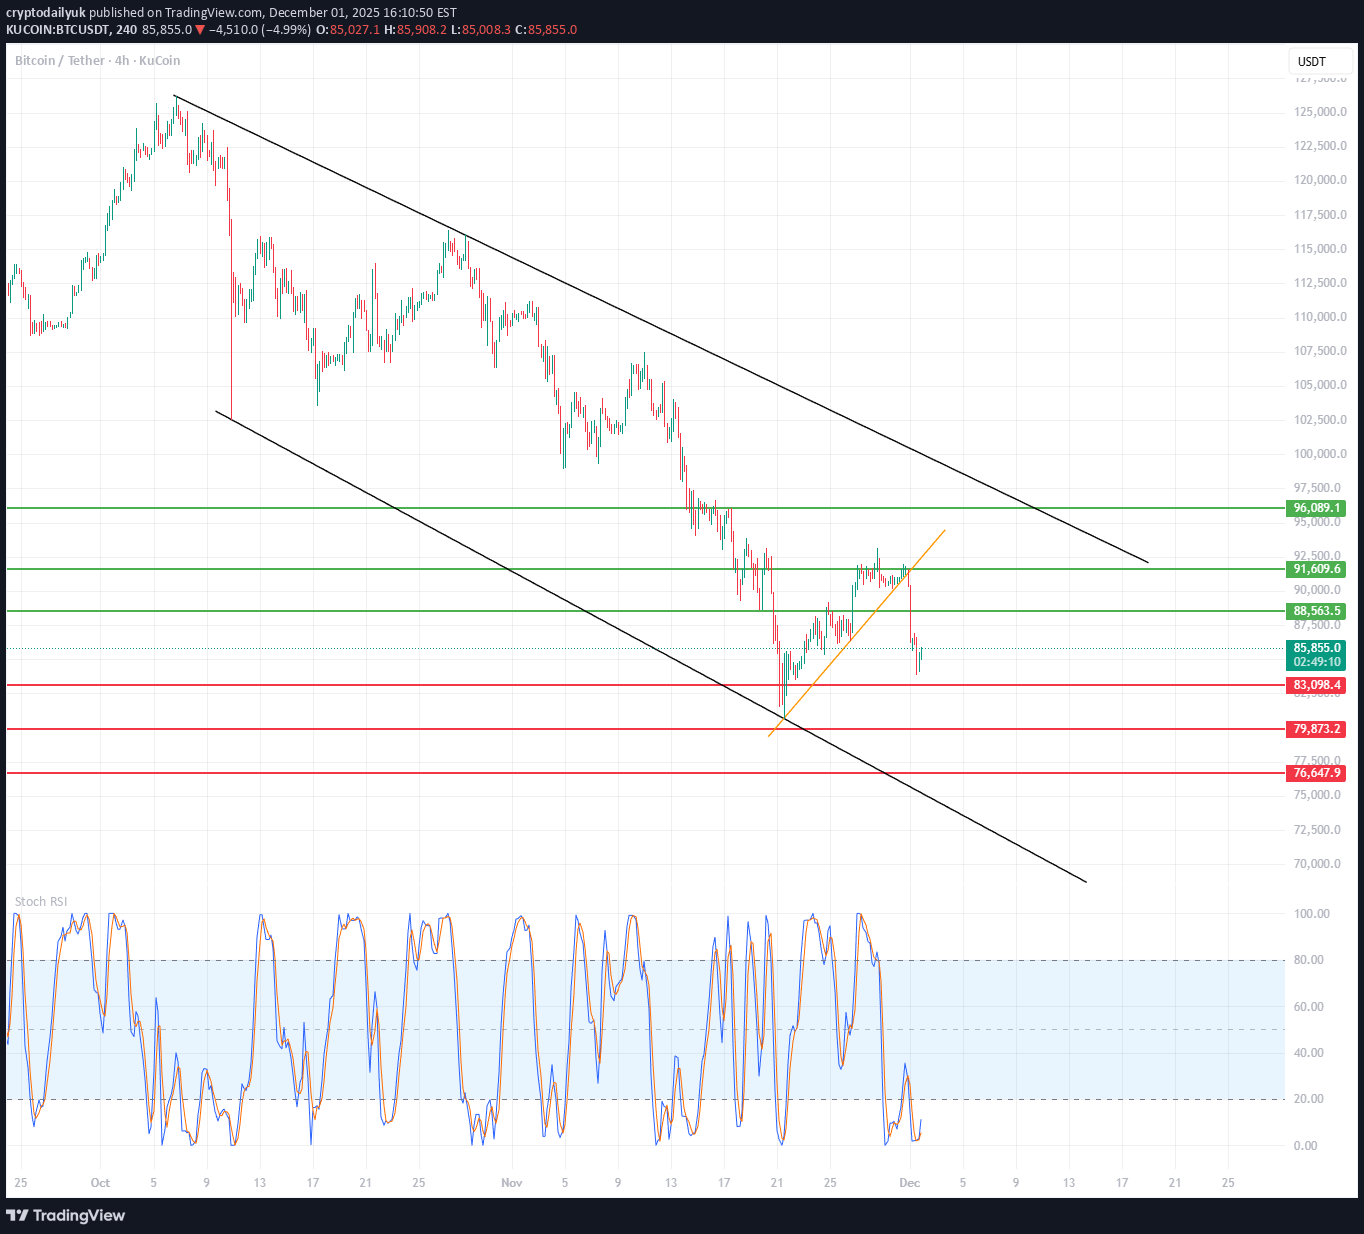
🧭 ۱. ساختار اصلی بازار نمودار نشان میدهد: یک کانال نزولی گسترده که از پایان اکتبر شکل گرفته است. قیمت از خط بالایی کانال برگشت کرده، یک حرکت صعودی محلی (خط روند نارنجی) ایجاد کرده و سپس آن را شکسته و دوباره به سمت مناطق پایینی کانال بازگشته است. ⬅️ این بدان معناست که روند غالب همچنان نزولی است و جهشهای صعودی صرفاً اصلاح (کُرکشن) هستند. 🧨 ۲. وضعیت فعلی نمودار قیمت از سطوح زیر عبور کرده و آنها را شکسته است: روند صعودی محلی (خط نارنجی) به زیر محدوده ۸۸,۵۰۰ تا ۸۹,۰۰۰ (سبز) سقوط کرده است در حال حرکت به سمت سطوح حمایتی بیشتر است در حال حاضر، قیمت شبیه یک بازآزمایی (ریتست) معمول ساختار شکسته شده و ادامه روند نزولی به نظر میرسد. 🟩 ۳. سطوح کلیدی قیمت (حمایت/مقاومت) مقاومت (بالایی – سبز): ۹۱,۶۰۰ – ۹۲,۰۰۰ – سطح کلیدی، شکستن آن روند نزولی محلی را باطل میکند. ۹۵,۰۰۰ – ۹۷,۵۰۰ – محدوده بالایی کانال نزولی حمایت (پایینی): ۸۵,۳۰۰ – ۸۵,۸۰۰ – حمایت محلی (قیمت در حال حاضر به آن واکنش نشان میدهد) ۸۳,۰۰۰ – ۸۳,۱۰۰ – حمایت افقی قوی ۷۹,۸۰۰ – حمایت قوی، از نظر تاریخی در این بازه زمانی محکم بوده است. ۷۶,۶۰۰ ۷۵,۰۰۰ – هدف پایینی یک ریزش بالقوه + نزدیک به مرز پایینی کانال ⬅️ منطقیترین اهداف نزولی، سطوح ۸۳,۰۰۰ و ۷۹,۸۰۰ هستند. 📉 ۴. کانال نزولی (سیاه) (خطوط) قیمت از محدوده بالایی کانال برگشت کرده و به سمت محدوده پایینی در حرکت است. خط میانی کانال به سمت پایین شکسته شده است ⬅️ سیگنالی برای ادامه روند. مرز پایینی کانال نشان دهنده یک کف بالقوه در حدود ۷۵,۰۰۰ تا ۷۸,۰۰۰ است. 🔄 ۵. استوکاستیک آراسآی (Stoch RSI) در حال حاضر در منطقه اشباع فروش قرار دارد و شروع به خم شدن به سمت بالا کرده است. در یک روند نزولی، سیگنالهای خرید (لانگ) ضعیفتر هستند، اما یک جهش کوتاهمدت امکانپذیر است. 🧭 ۶. سناریوها 📉 سناریوی نزولی (احتمال بیشتر) بازگشت فنی (ریباند) به سطح ۸۸,۵۰۰ – ۸۹,۰۰۰ عدم پذیرش (ریجکت) از این محدوده ⬅️ ادامه کاهش اهداف: ۸۳,۰۰۰ ۷۹,۸۰۰ سطوح نهایی: ۷۶,۰۰۰ – ۷۵,۰۰۰ ⬅️ این سناریو با روند و برگشت از کانال بالایی سازگار است.
cryptodailyuk
تحلیل BNB/USDT: نقطه عطف حیاتی؛ خریدار یا فروشنده برنده است؟
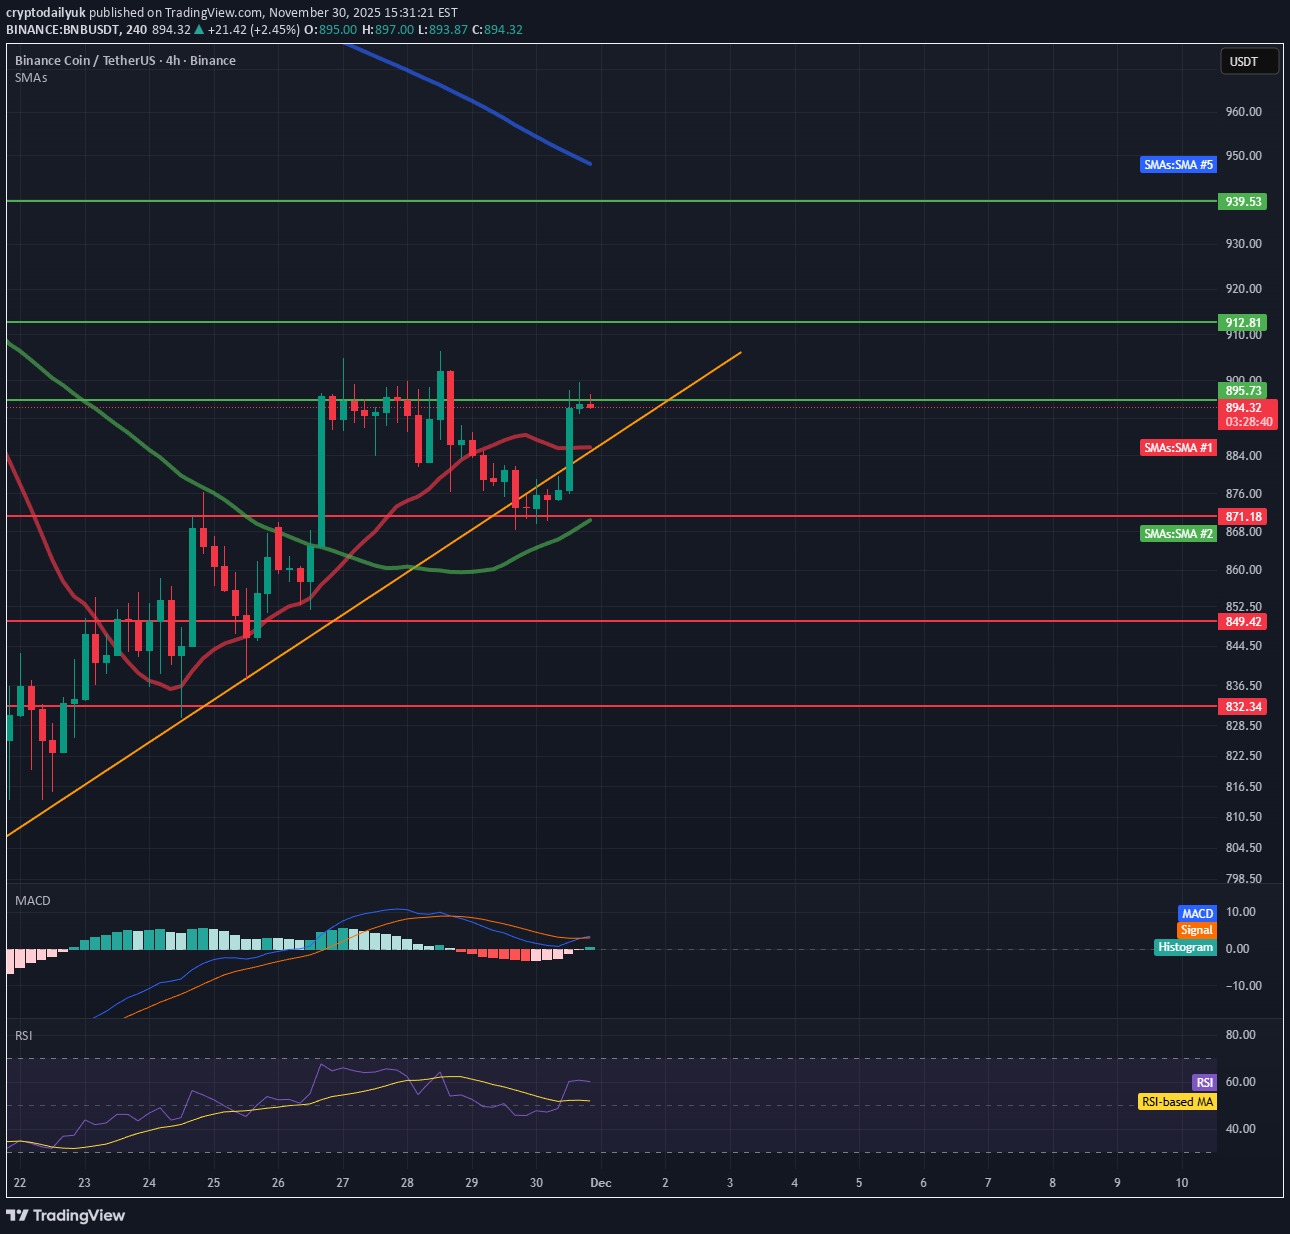
🔶 ۱. روند فعلی و ساختار بازار نمودار نشان میدهد: یک روند صعودی کوتاهمدت واضح – قیمت به خط روند صعودی زرد رنگ پایبند است. افزایش پس از برگشت از میانگین متحرک ساده ۵۰ (SMA 50) (سبز). با این حال، هنوز هیچ سقف بالاتر جدیدی (Higher Highs) ثبت نشده است – بازار در حال تحکیم بین ۸۸۸ تا ۹۱۰ است. ⬅️ روند کوتاهمدت: صعودی ⬅️ روند میانمدت: خنثی/تحکیم 🟩 ۲. سطوح کلیدی حمایت/مقاومت مقاومتها: ۹۱۰ تا ۹۱۲ تتر (USDT) – در حال حاضر یک مقاومت کلیدی است که چندین بار مورد آزمایش قرار گرفته است. ۹۳۰ تا ۹۳۵ تتر (USDT) – مقاومت بالاتر محلی (منطقه سبز در نمودار شما). ۹۵۷ تا ۹۶۰ تتر (USDT) – مقاومت قویتر از تایم فریم روزانه (D1) (میانگین متحرک ساده ۹۵ آبی قابل مشاهده در تصویر). حمایتها: ۸۸۹ تا ۸۹۳ تتر (USDT) – حمایت محلی و منطقه کنونی درگیری بازار. ۸۷۱ تتر (USDT) – میانگین متحرک ساده ۵۰ (SMA 50) + کف نوسانی قبلی. ۸۴۹ تتر (USDT) – حمایت قدرتمند از تایم فریمهای بالاتر (HTF). ۸۳۷ تتر (USDT) – «خط نجات» نهایی ساختار صعودی. 📈 ۳. اندیکاتورها (MACD, RSI) MACD MACD > 0 – مثبت است. خط MACD در حال شروع به حرکت به سمت بالا است ← نشانهای از شتاب صعودی (مومنتوم بولیش). عدم وجود واگرایی (Divergence). ⬅️ اندیکاتور MACD سناریوی صعودی را تأیید میکند. RSI RSI در حدود ۵۹ – یک منطقه سالم، دور از منطقه اشباع خرید (Overbought). RSI خط روند نزولی محلی را شکسته است ← افزایش قدرت خریداران. ⬅️ اندیکاتور RSI روند صعودی را تأیید میکند. 🟧 ۴. حرکت کلیدی قیمت در حال حاضر قیمت در حال حاضر به مقاومت ۹۱۰ تا ۹۱۲ تتر (USDT) نزدیک میشود و همزمان در حال لمس خط روند محلی است. این نقطه تصمیمگیری بازار است. یک شکست (Breakout) ← راه را برای رسیدن به ۹۳۰ تا ۹۳۵ باز میکند. یک رد شدن (Rejection) ← بازگشت به ۸۸۹، و پایینتر از ۸۷۱.
cryptodailyuk
تحلیل تکنیکال بیت کوین (15 دقیقهای): سطوح کلیدی و سناریوهای کوتاه مدت
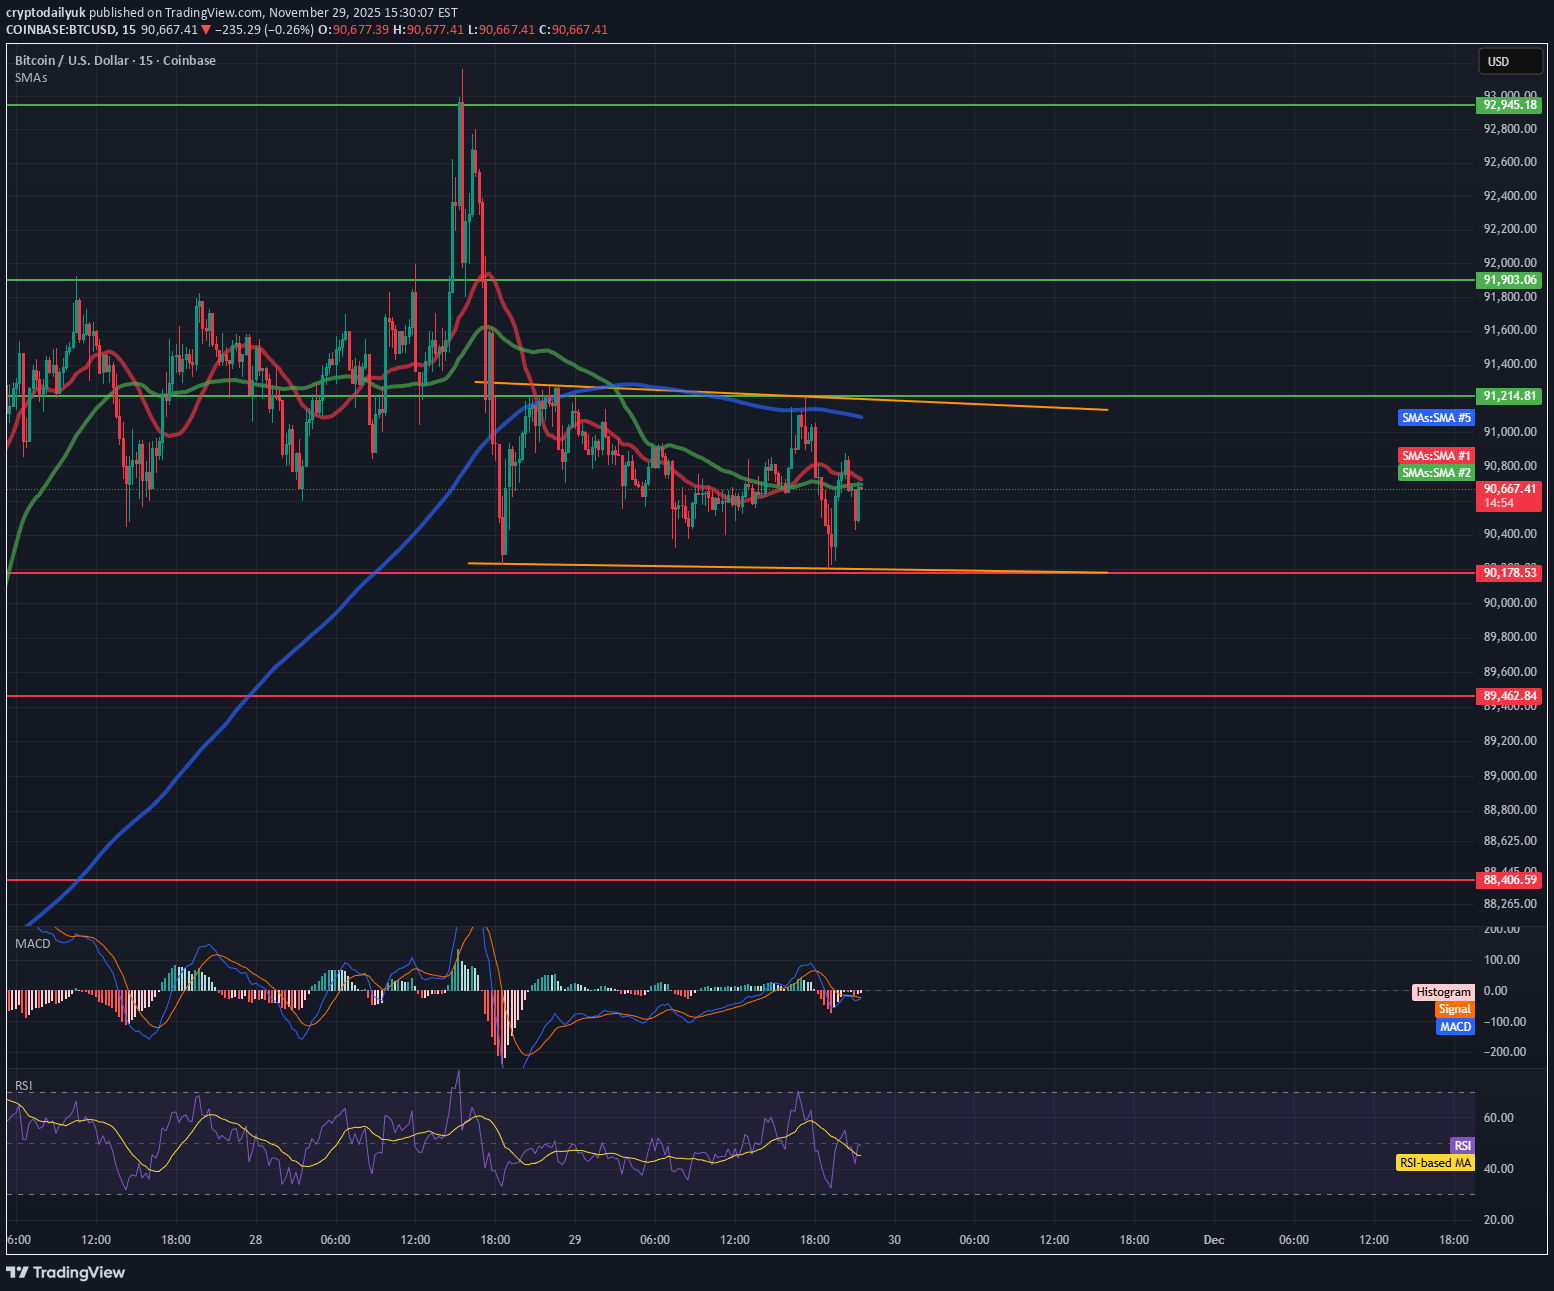
📉 تحلیل کوتاهمدت (۱۵ دقیقهای) ۱. سطوح کلیدی از روی چارت حمایت (Support) ۹۰٬۴۰۰ تا ۹۰٬۴۵۰ دلار – قوی، مکرراً تست شده (منطقه نارنجی). ۹۰٬۱۷۸ دلار – حمایت پایینتر (خط نازک). ۸۹٬۴۶۰ دلار – حمایت عمیقتر روزانه. مقاومت (Resistance) ۹۰٬۹۰۰ تا ۹۱٬۰۰۰ دلار – منطقه مقاومت محلی. ۹۱٬۲۱۴ تا ۹۱٬۵۴۵ دلار – میانگین متحرک ساده ۷۲ / میانگین متحرک ساده ۲۰۰ (زرد و آبی) = مقاومت دینامیک قوی. ۹۱٬۸۰۰ تا ۹۲٬۲۰۰ دلار – مقاومت ساختاری بالاتر. 🧠 ۲. ساختار بازار روند کوتاهمدت (۱۵ دقیقهای) قیمت زیر میانگین متحرک ۲۰۰ و ۷۲ باقی مانده است ← تکانه (مومنتوم) نزولی. سقفهای پایینتر و کفهای پایینتر قابل مشاهده است ← ساختار نزولی. محدوده باریکتر: ۹۰٬۴۰۰ تا ۹۰٬۹۰۰ ← فشردهسازی / تثبیت قیمت. 📊 ۳. اندیکاتورها (شاخصها) مکدی (MACD) – خنثی / کمی نزولی هیستوگرام در اطراف صفر نوسان میکند ← فقدان تکانه قوی. تقاطع اخیر به سمت پایین ← فشار نزولی. آراسآی (RSI) – ۴۸ (خنثی) هنوز به محدوده اشباع فروش نرسیده است، اما: آراسآی در حال تشکیل واگرایی نزولی نسبت به سقفهای قبلی است. آراسآی اغلب در روند نزولی از ۵۰ برگشت میزند ← تأیید فشار نزولی. 🔎 ۴. وضعیت کنونی بازار قیمت در حال تست مجدد منطقه ۹۰٬۴۰۰ دلار است، که یک سطح دفاعی کلیدی برای گاوها (خریداران) محسوب میشود. ساختار نشاندهنده موارد زیر است: فشار عرضه، ضعف خریداران در زیر میانگین متحرک ۲۰۰، احتمال شکست (بریکاوت) به سمت پایین در صورت شکست ۹۰٬۴۰۰. 🎯 ۵. سناریوهای کوتاهمدت (۱۵ دقیقهای) 🔻 سناریوی نزولی (محتملتر) در صورت ریزش ۹۰٬۴۰۰: هدف ۱: ۹۰٬۱۸۰ هدف ۲: ۸۹٬۴۶۰ هدف ۳: ۸۸٬۹۶۰ ساختار قویاً این سناریو را پیشنهاد میکند، زیرا: قیمت زیر میانگین متحرک ۲۰۰ قرار دارد تکانه ضعیف است هیچ برگشت قوی از کفها دیده نمیشود 🔼 سناریوی صعودی (فقط پس از شکست ۹۰٬۹۰۰) اگر بازار از ۹۰٬۴۰۰ برگشت بزند و ۹۰٬۹۰۰ را بشکند: هدف ۱: ۹۱٬۲۰۰ (میانگین متحرک ۷۲ + ۲۰۰) هدف ۲: ۹۱٬۵۵۰ هدف ۳: ۹۱٬۸۰۰
سلب مسئولیت
هر محتوا و مطالب مندرج در سایت و کانالهای رسمی ارتباطی سهمتو، جمعبندی نظرات و تحلیلهای شخصی و غیر تعهد آور بوده و هیچگونه توصیهای مبنی بر خرید، فروش، ورود و یا خروج از بازارهای مالی نمی باشد. همچنین کلیه اخبار و تحلیلهای مندرج در سایت و کانالها، صرفا بازنشر اطلاعات از منابع رسمی و غیر رسمی داخلی و خارجی است و بدیهی است استفاده کنندگان محتوای مذکور، مسئول پیگیری و حصول اطمینان از اصالت و درستی مطالب هستند. از این رو ضمن سلب مسئولیت اعلام میدارد مسئولیت هرنوع تصمیم گیری و اقدام و سود و زیان احتمالی در بازار سرمایه و ارز دیجیتال، با شخص معامله گر است.