
COTI
کوتی
| تریدر | نوع سیگنال | حد سود/ضرر | زمان انتشار | مشاهده پیام |
|---|---|---|---|---|
نتیجه ای یافت نشد. | ||||
نمودار قیمت کوتی
سود ۳ ماهه :
سیگنالهای کوتی
فیلتر
مرتب سازی پیام براساس
نوع پیام
نوع تریدر
فیلتر زمان

CryptoNuclear
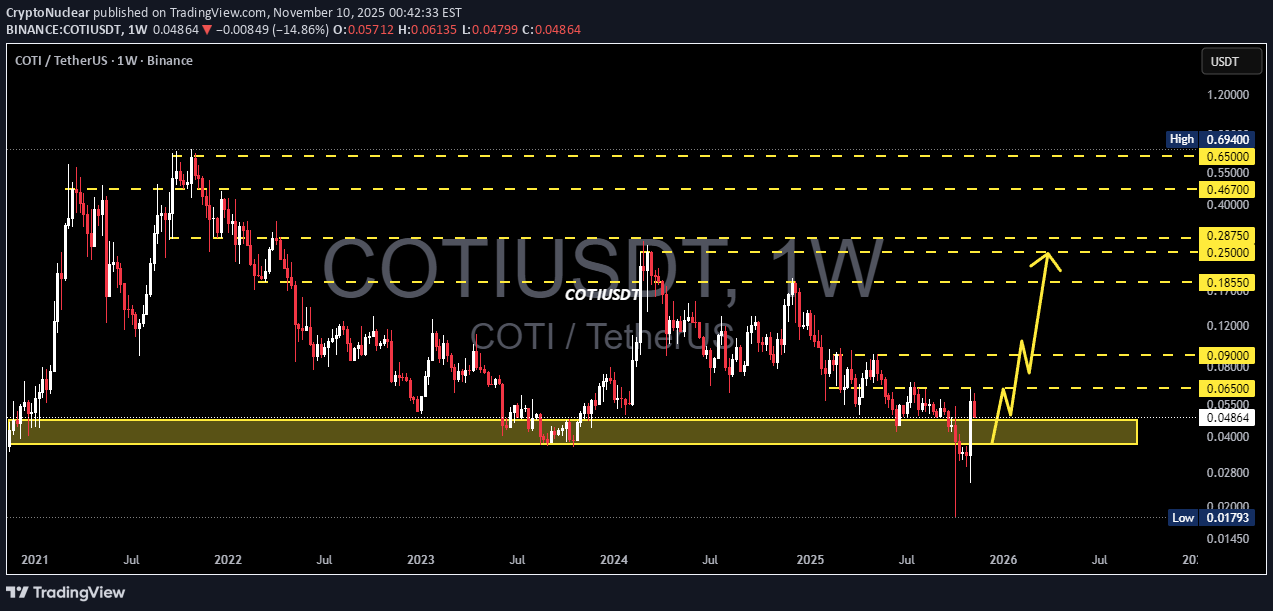
کاتی (COTI) در نقطه عطف: آیا کفسازی برای صعود بزرگ است یا فقط یک جهش موقت؟
پس از کاهش شدید به پایین ترین حد در حدود 0.017 دلار، COTI به شدت جهش کرد و توانست در بالای منطقه تقاضای کلیدی در 0.047-0.037 دلار بسته شود. این منطقه زرد فقط هر سطحی نیست - آخرین سنگر خریداران را نشان می دهد، منطقه ای مهم که از سال 2021 مکرراً قیمت را حفظ کرده است. با نگاهی دقیقتر، آخرین شمع هفتگی یک جاروی نقدینگی deep را نشان میدهد که پس از آن یک رد گسترده انجام میشود - نشانهای کلاسیک مبنی بر اینکه بازیکنان بزرگ ممکن است «توقفها را پاک کرده باشند» و انباشت مخفیانه را آغاز کرده باشند. --- ⚡ ساختار و الگو روند اولیه: همچنان نزولی کلان است، اما یک الگوی دو کف بالقوه در ناحیه حمایت major در حال شکل گیری است. مومنتوم: خریداران پس از رد شدید فتیله پایین از منطقه، قدرت خود را نشان می دهند. تأیید برگشت: یک استراحت هفتگی و بسته شدن بالای 0.065 دلار می تواند در را برای یک رالی بزرگتر باز کند. --- 🢢 سناریوی صعودی اگر قیمت بتواند بالای 0.047-0.037 دلار بماند و از 0.065 دلار عبور کند، COTI می تواند move خود را به سمت بالا گسترش دهد: 🎯 هدف 1: 0.090 دلار (مقاومت هفتگی) 🎯 هدف 2: 0.1855 دلار (مقاومت روانی و منطقه عرضه قوی) 🎯 اهداف تمدید شده: 0.2875 تا 0.4670 دلار در صورت وجود حرکت قوی بازار و چرخش آلت کوین. چند شمع هفتگی بعدی در تعیین اینکه آیا این شروع یک معکوس واقعی کلان است یا فقط یک جهش تسکین فنی بسیار مهم بود. --- 🔴 سناریوی نزولی با این حال، اگر قیمت کاهش یابد و به زیر 0.037 دلار بسته شود، تمام سوگیری های صعودی باطل می شوند. چنین move می تواند باعث ادامه روند نزولی به سمت زیر شود: ⚠️ 0.018 دلار (منطقه نقدینگی پایین و کلیدی قبلی). شکست تایید شده زیر این حمایت اصلی نشان میدهد که خریداران ضعیف باقی میمانند و روند نزولی بلندمدت به تسلط خود ادامه میدهد. --- 🧩 نتیجه گیری الگو COTI اکنون در منطقه تصمیم major است. منطقه 0.047-0.037 دلاری میدان جنگ بین خریداران و فروشندگان است. اگر پابرجا باشد - یک معکوس بالقوه در افق است. اگر شکست - منتظر ادامه پایین پایین دیگر باشید. --- 🔍 بینش اضافی بسیاری از معکوسهای رمزنگاری major اغلب از ساختارهایی مانند این شروع میشوند: رد شدید از پشتیبانی چند ساله شمع هفتگی با فتیله پایینی بلند افزایش تدریجی حجم انباشتگی بنابراین، این منطقه فقط یک منطقه پرش فنی نیست - می تواند مرحله اولیه تغییر از توزیع به تجمع را نشان دهد. --- #COTI #COTIUSDT #CryptoAnalysis #Technical Analysis #AltcoinSetup #SwingTrade #LiquidityHunt #CryptoReversal #SupportZone #CryptoTrading

ULYSSESTRADER
سیگنال فروش فوری COTI/USDT: فرصت کسب سود در ریزش جدید (با حد ضرر مشخص)
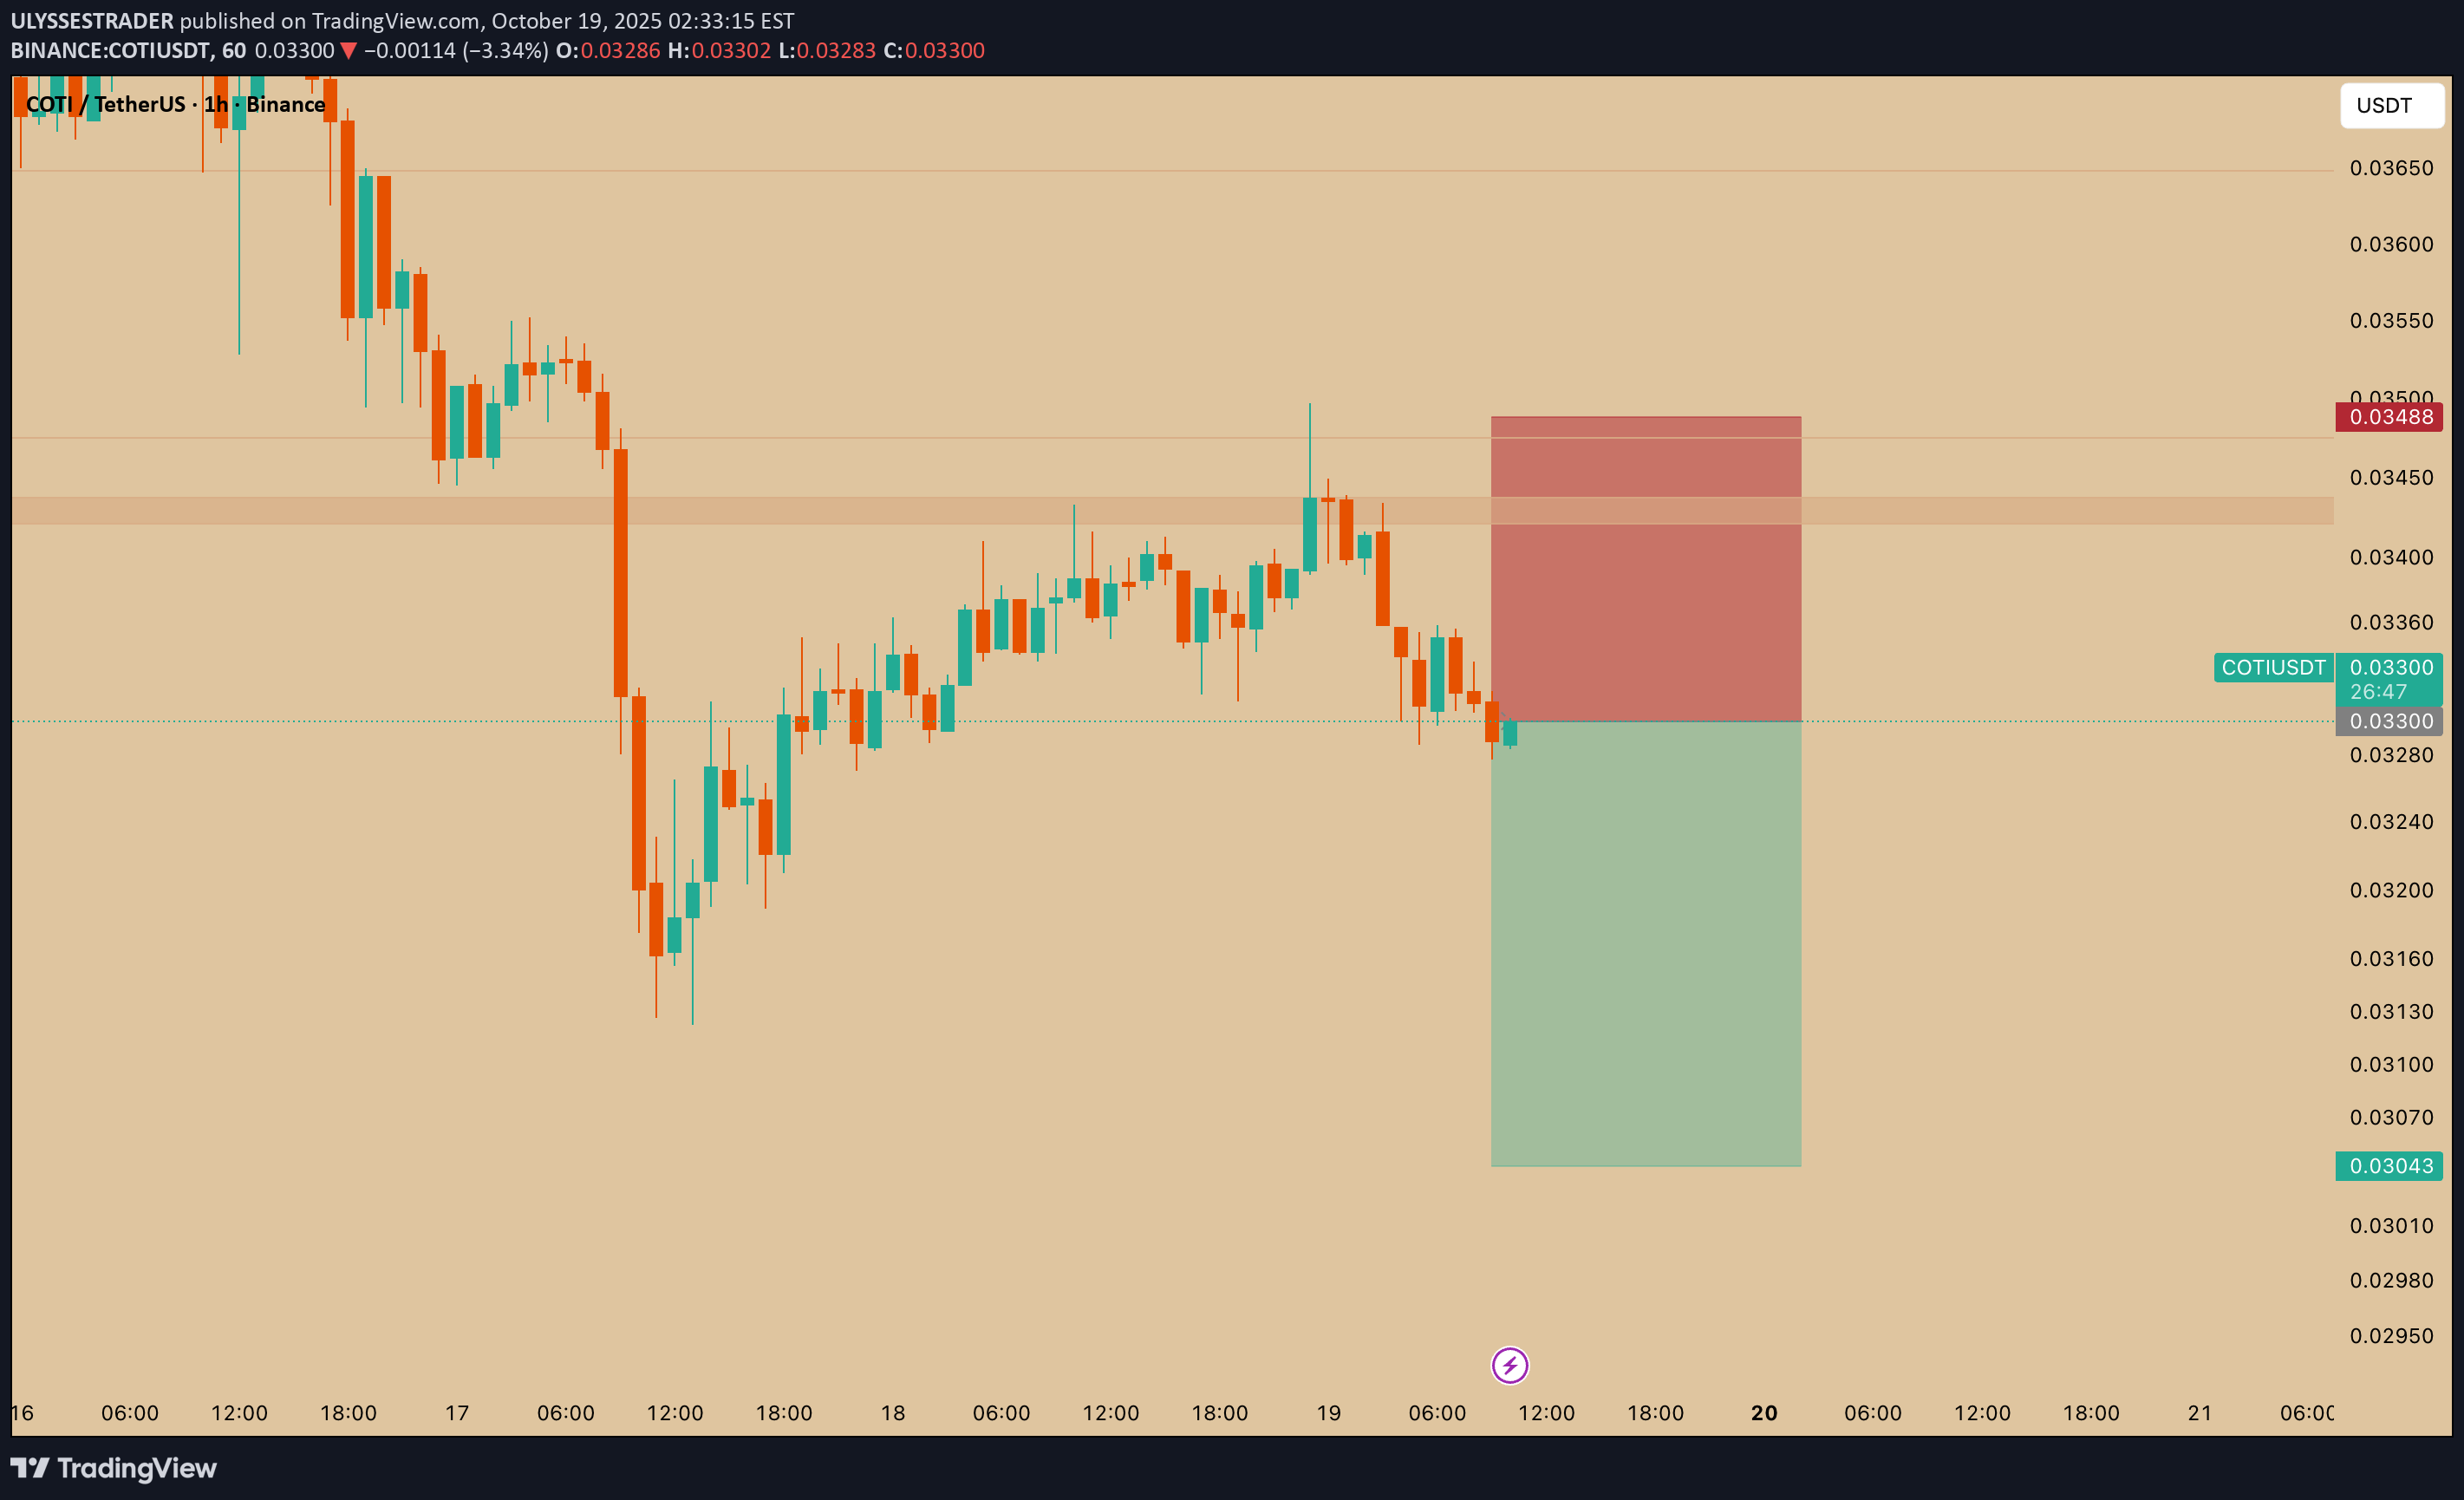
۱. زمینه نمودار جفت ارز: COTI/USDT بازه زمانی: ۱ ساعته (1h) قیمت فعلی: تقریباً ۰.۰۳۲۹۹ تتر (USDT) بازار در یک روند نزولی با سقفهای پایینتر و کفهای پایینتر قرار داشته است. قیمت اخیراً مقاومت را تست کرده و اکنون نشانههایی از عدم پذیرش (ریجکشن) نشان میدهد. ۲. تنظیمات معاملاتی این یک پوزیشن فروش (شرطبندی بر کاهش قیمت) است. مستطیل قرمز/سبز ساختار ریسک به ریوارد (R:R) را مشخص میکند: ناحیه ورود: حدود ۰.۰۳۳۰ تتر (قیمت فعلی، در نقطه ریجکشن). حد ضرر (SL): ۰.۰۳۴۸۸ تتر (بالای کادر red). اگر قیمت بالاتر از این سطح صعود کند، تنظیمات معاملاتی فروش نامعتبر است. حد سود (TP): ۰.۰۳۰۴۳ تتر (کف کادر سبز). هدف، یک حرکت نزولی به سمت حمایت قبلی است. ۳. نسبت ریسک به ریوارد ریسک (فاصله SL): حدود ۰.۰۰۱۹ تتر پاداش/ریوارد (فاصله TP): حدود ۰.۰۰۲۶ تتر نسبت R:R تقریباً ۱.۳۷ به ۱ است. این یک تنظیمات معاملاتی متوسط است؛ پاداش بزرگتر از ریسک است اما بسیار بالا نیست. ۴. حمایت و مقاومت ناحیه مقاومت: ۰.۰۳۴۵ تا ۰.۰۳۵۰ (منطقه ریجکشن قبلی). ناحیه حمایت: ۰.۰۳۰۳ تا ۰.۰۳۰۵ (ناحیه هدف سبز). تریدر انتظار دارد که فروشندگان از مقاومت دفاع کرده و قیمت را به سمت ناحیه حمایت برگردانند. ✅ به طور خلاصه: این یک تنظیمات معاملاتی فروش در COTI/USDT است که در آن تریدر در حدود ۰.۰۳۳۰ وارد میشود، حد ضرر را روی ۰.۰۳۴۸۸ قرار میدهد و ۰.۰۳۰۴۳ را هدف میگیرد. این تنظیمات متکی بر عدم پذیرش قیمت در مقاومت و ادامه روند نزولی به سمت حمایت است.

Alpha-GoldFX
آیا COTI آماده انفجار است؟ راز الگوی "گُوِه نزولی" که نوید رشد 650 درصدی میدهد!

COTIUSDT در حال نمایش الگوی گوه کاهشی (Falling Wedge Pattern) است که یکی از قویترین ساختارهای برگشتی صعودی در تحلیل تکنیکال محسوب میشود. این الگو نشان میدهد که روند نزولی فعلی ممکن است در حال از دست دادن شتاب باشد و یک شکست صعودی قوی در راه است. ساختار تنگشونده این گوه، نشاندهنده کاهش فشار فروش و افزایش تقاضا با ورود تدریجی خریداران است. این جفتارز مدتی است که در حال تثبیت (Consolidation) بوده، و این فاز تراکم میتواند به یک حرکت شارپ و شدید صعودی تبدیل شود. حجم معاملات همچنان قوی باقی مانده و تأیید میکند که انباشت (Accumulation) در زیر سطح در حال وقوع است. هنگامی که قیمت از مقاومت بالایی گوه خارج شود، معاملهگران ممکن است شاهد یک رالی انفجاری باشند که به طور بالقوه میتواند در میانمدت، سودی بین ۵۰٪ تا بیش از ۶۵۰٪ به همراه داشته باشد. این نوع ساختار اغلب هم معاملهگران کوتاهمدت و هم سرمایهگذاران بلندمدتی را که به دنبال کسب سود از فرصتهای پرریسک با پاداش بالا هستند، جذب میکند. با نشان دادن علائم قدرت در بازار گستردهتر، احساسات سرمایهگذاران در مورد COTI در حال بهبود است. ترکیب تکنیکالهای صعودی، فعالیت معاملاتی قوی و علاقه مجدد، COTIUSDT را به نامزد امیدوارکنندهای برای شکست قیمتی تبدیل میکند. منطقه شکست را به دقت زیر نظر داشته باشید، زیرا به محض دریافت تأییدیه، شتاب میتواند به سرعت افزایش یابد. ✅ با زدن دکمه لایک، حمایت خود را نشان دهید و ✅ نظر خود را در زیر بنویسید! (نظر شما در مورد این کوین چیست؟) بازخورد و مشارکت شما، من را برای به اشتراکگذاری تحلیلهای بازار روشنگرانه بیشتر، الهام میبخشد!

CryptoWithJames
COTIUSDT UPDATE
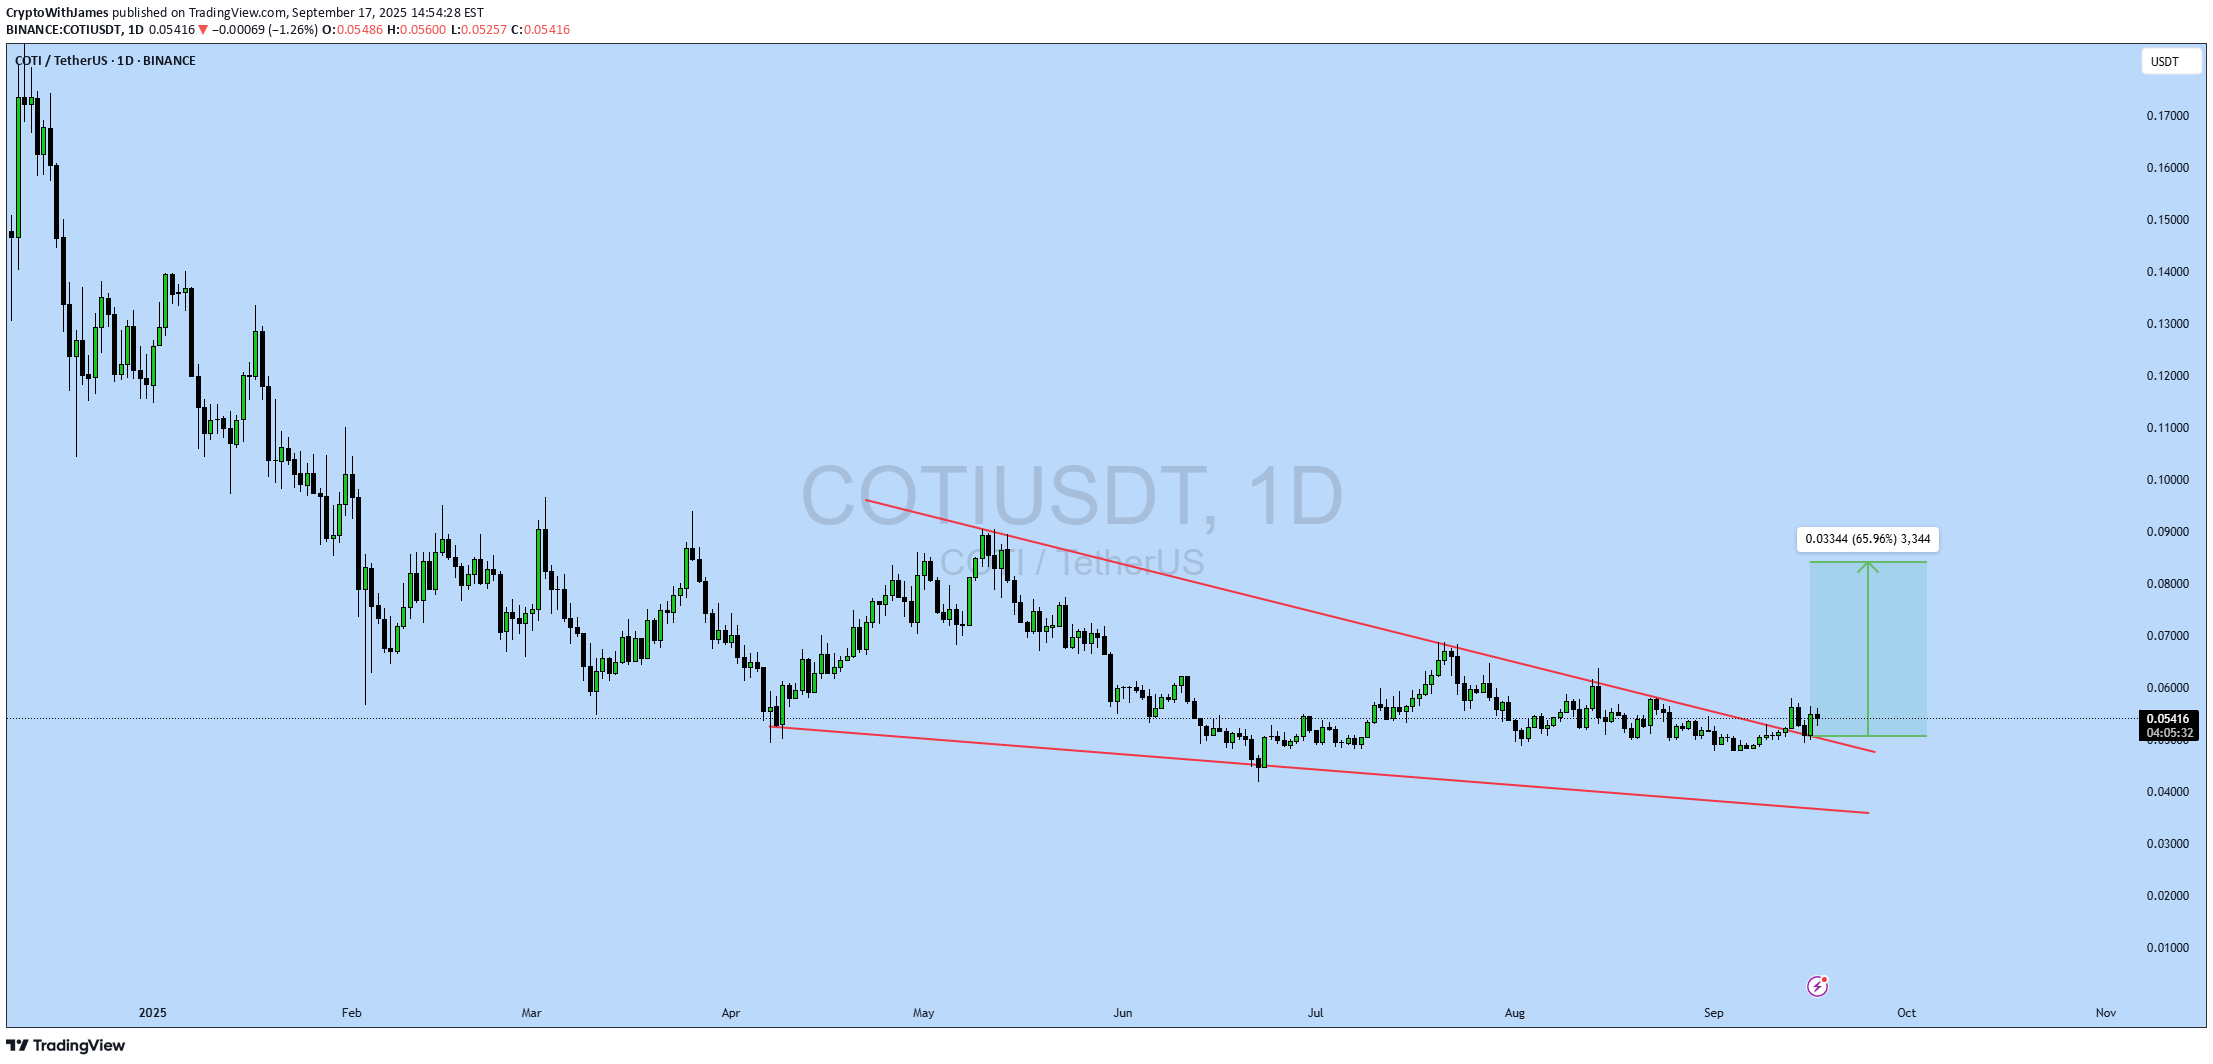
#COTI بروزرسانی COTI راه اندازی فنی الگوی: الگوی گوه در حال سقوط صعودی قیمت فعلی: 0.0541 دلار قیمت هدف: 0.0875 دلار هدف ٪ افزایش: 65.96 ٪ COTI در حال شکسته شدن از گوه در حال سقوط در بازه زمانی 1D است. قیمت فعلی 0.0541 دلار با هدف نزدیک به 0.0875 دلار است که تقریباً 66 ٪ صعود بالقوه را نشان می دهد. این شکست ، حرکت صعودی را با ساختار به نفع ادامه ، تأیید می کند. همیشه از مدیریت ریسک مناسب استفاده کنید. چارچوب زمانی: 1d نکته مدیریت ریسک: همیشه از مدیریت ریسک مناسب استفاده کنید.

Bithereum_io
COTIUSDT 1D

#COTI در نمودار روزانه در داخل یک مثلث متقارن حرکت می کند و در حال حاضر با ابر ایچیموکو و مقاومت مثلث روبرو است. اگر از هر دوی آنها عبور کند (بشکنه)، اهداف احتمالی عبارتند از: 🎯 0.06003 دلار 🎯 0.06563 دلار 🎯 0.07122 دلار 🎯 0.07918 دلار 🎯 0.08932 دلار ⚠️ همیشه به یاد داشته باشید که از حد ضرر (Stop-Loss) نزدیک استفاده کنید و مدیریت ریسک مناسب را رعایت نمایید.

CryptoAnalystSignal
#COTI/USDT - Bottomed out!

«قیمت در یک کانال نزولی در بازه زمانی ۱ ساعته در حال حرکت است و به خوبی به آن پایبند بوده و به سمت یک شکست قوی و پولبک (Retest) در حرکت است. ما یک روند نزولی در اندیکاتور RSI داریم که در آستانه شکسته شدن و پولبک است که از شکست رو به بالا حمایت میکند. یک ناحیه حمایتی major به رنگ سبز در 0.05325 وجود دارد که نشان دهنده یک نقطه حمایت قوی است. ما به سمت تثبیت بالای میانگین متحرک 100 در حرکت هستیم. قیمت ورود: 0.05390 هدف اول: 0.05480 هدف دوم: 0.05580 هدف سوم: 0.05670 یک مسئله ساده را فراموش نکنید: مدیریت سرمایه. هنگامی که به هدف اول رسیدید، مقداری از سود را برداشت کنید و سپس دستور حد ضرر (Stop-Loss) خود را به قیمت ورود تغییر دهید. برای سوالات، لطفا کامنت بگذارید. متشکرم.»

chethanlobo11
COTI/USDT – Symmetrical Triangle Breakout

COTI چندین ماه در یک مثلث متقارن در حال ادغام است ، با اوج پایین تر و پایین آمدن عملکرد قیمت. countions مشاهدات کلیدی اکنون قیمت از مقاومت مثلث با یک شمع سبز سبز قوی خارج شده است. با تأیید مشارکت خریدار ، حجم به طور قابل توجهی افزایش یافت. RSI (14) در 55.9 است ، که به سمت بالا و بالاتر از علامت 50 خنثی است و نشان دهنده بهبود حرکت است. قیمت در حال حاضر با 0.0551 دلار معامله می شود ، بالاتر از منطقه Breakout Key در حدود 0.052 دلار - 0.053 دلار. 📊 سناریوی صعودی نگه داشتن بالاتر از 0.052 دلار ، شکست را معتبر نگه می دارد. مقاومت اول: 0.060 دلار مقاومت بعدی: 0.070 دلار (major سطح روانشناختی). شکستن و بسته شدن بالاتر از 0.070 دلار می تواند مسیر را به سمت 0.080 دلار - 0.090 دلار باز کند. ⚠ سناریوی نزولی اگر قیمت به زیر 0.052 دلار برگردد ، ممکن است دوباره وارد محدوده مثلث شود. پشتیبانی کلیدی: 0.050 دلار - 0.048 دلار 0.045 دلار (پایه مثلث و پشتیبانی مهم) خرابی زیر 0.045 دلار باعث ایجاد صعودی می شود.

Aviator315
COTI/USDT potential 200%+++

COTI/USDT پتانسیل 200 ٪ +++ منطقه 0.04 دلار - 0.06 دلار بخرید اهداف داده شده در نمودار 200 ٪ تا 300 ٪ COTI یک محرمانه بودن سریع و سبک layer در Ethereum است. با استفاده از پروتکل رمزنگاری موفقیت آمیز مدارهای گنج زده و توسط Ethereum تضمین شده است ، COTI پیشرفته ترین و سازگار ترین راه حل برای محافظت از data در blockchain عمومی را معرفی می کند. در منطقه خرید ما 0.04 دلار - 0.06 $

erbil1299
Cotı

به نظر میرسد شکست خط روند در نمودار ساعتی رخ داده و با نشانههای کاهش قیمت نیز پشتیبانی میشود، بنابراین انتظار یک صعود خوب را دارم.

evasivesteering
Long COTI

COTI خط روند مقاومتی را که از ابتدای سال 2025 تشکیل شده بود، شکسته است. موقعیت خرید (Long) مطابق نمودار تنظیم شده است. سلب مسئولیت: این تحلیل بر اساس دیدگاه شخصی من است و توصیه مالی نیست. ریسک تحت کنترل شماست.
سلب مسئولیت
هر محتوا و مطالب مندرج در سایت و کانالهای رسمی ارتباطی سهمتو، جمعبندی نظرات و تحلیلهای شخصی و غیر تعهد آور بوده و هیچگونه توصیهای مبنی بر خرید، فروش، ورود و یا خروج از بازارهای مالی نمی باشد. همچنین کلیه اخبار و تحلیلهای مندرج در سایت و کانالها، صرفا بازنشر اطلاعات از منابع رسمی و غیر رسمی داخلی و خارجی است و بدیهی است استفاده کنندگان محتوای مذکور، مسئول پیگیری و حصول اطمینان از اصالت و درستی مطالب هستند. از این رو ضمن سلب مسئولیت اعلام میدارد مسئولیت هرنوع تصمیم گیری و اقدام و سود و زیان احتمالی در بازار سرمایه و ارز دیجیتال، با شخص معامله گر است.