
MELANIA
Official Melania Meme
| تریدر | نوع سیگنال | حد سود/ضرر | زمان انتشار | مشاهده پیام |
|---|---|---|---|---|
No results found. | ||||
Price Chart of Official Melania Meme
سود 3 Months :
سیگنالهای Official Melania Meme
Filter
Sort messages by
Trader Type
Time Frame

behdark
MELANIA Analysis (8H)
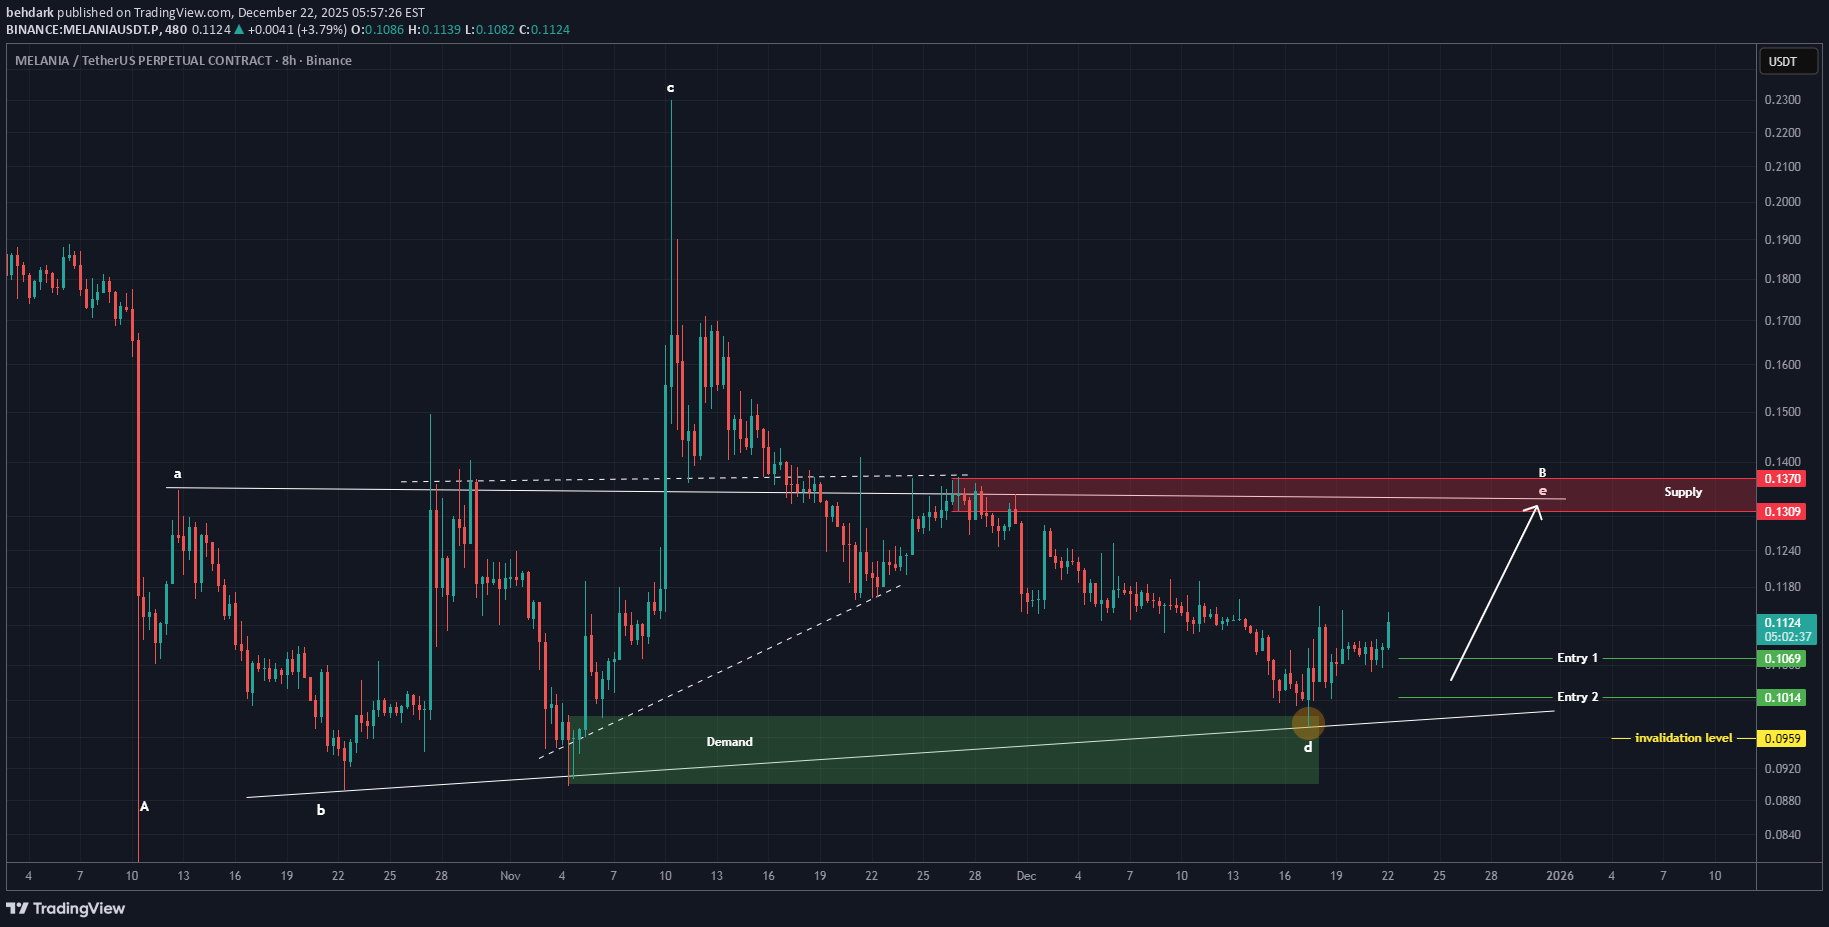
It seems that a triangle is forming, and wave D has not yet completed. The price could make a bullish move for wave E. We have marked two entry points for this wave, which should be entered using DCA. The targets are marked on the chart. A 4-hour candle close below the invalidation level will invalidate this analysis. For risk management, please don't forget stop loss and capital management When we reach the first target, save some profit and then change the stop to entry Comment if you have any questions Thank YouAfter hitting the first entry point, it has pumped more than 11%. Take some profit and move the stop loss to breakeven.

asilturk
ملانیا (MELANIA): آیا این میم کوین پس از یک سال خواب، آماده انفجار است؟
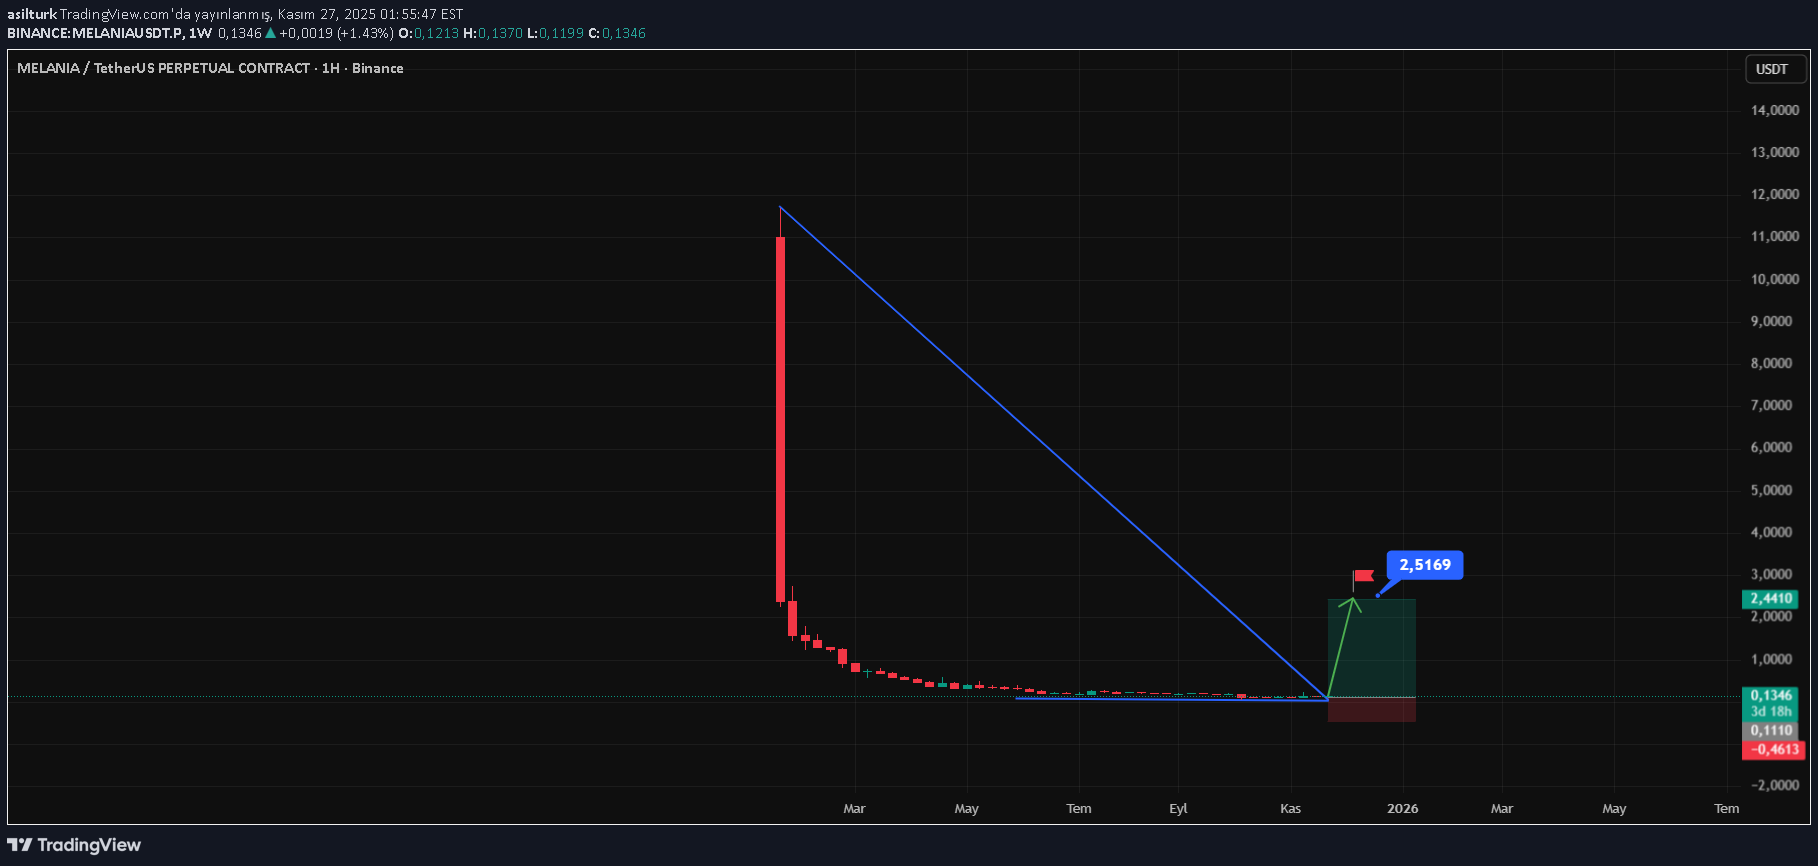
Another cryptocurrency that we will add to the portfolio today is MELANIA at a price of 0.1350 cents. Market value is 135 Million dollars. Actual circulation is 1 Billion units. Market dominance weight is 0.0041%. When we examine it technically, we see that the MELANIA coin traded on the SOL network tested the 11.69 $ price band on the supply date and continued with sharp declines for almost a year, retreating to 0.1360 cent prices. Since it is a Meme coin, there can definitely be very sharp upward and downward price movements. After all, it is necessary to remind that it is a meme coin. However, we have been able to observe gradual price movements and volumetric increases for the last week. In the last week, which has been sleeping for a year, it has had its share of the general downward trend, but BTC has shown great resistance in its pricing and fluctuations. The main reason why I am sharing the weekly chart is that I believe that those who wait with a cost of $11 will see harsh corrections in the coming days for MELANIA, those who move in the 0.1 cent price band. As a result, we can say that medium and long-term investors are at investable levels for MELANIA, but I strongly recommend that they make gradual purchases. I believe that it would be correct to invest gradually due to its very strong upward and downward movements.

Mihai_Iacob
چرا سرمایهگذاران کریپتو زود فراموش میکنند؟ شبیه به قماربازان کازینو!
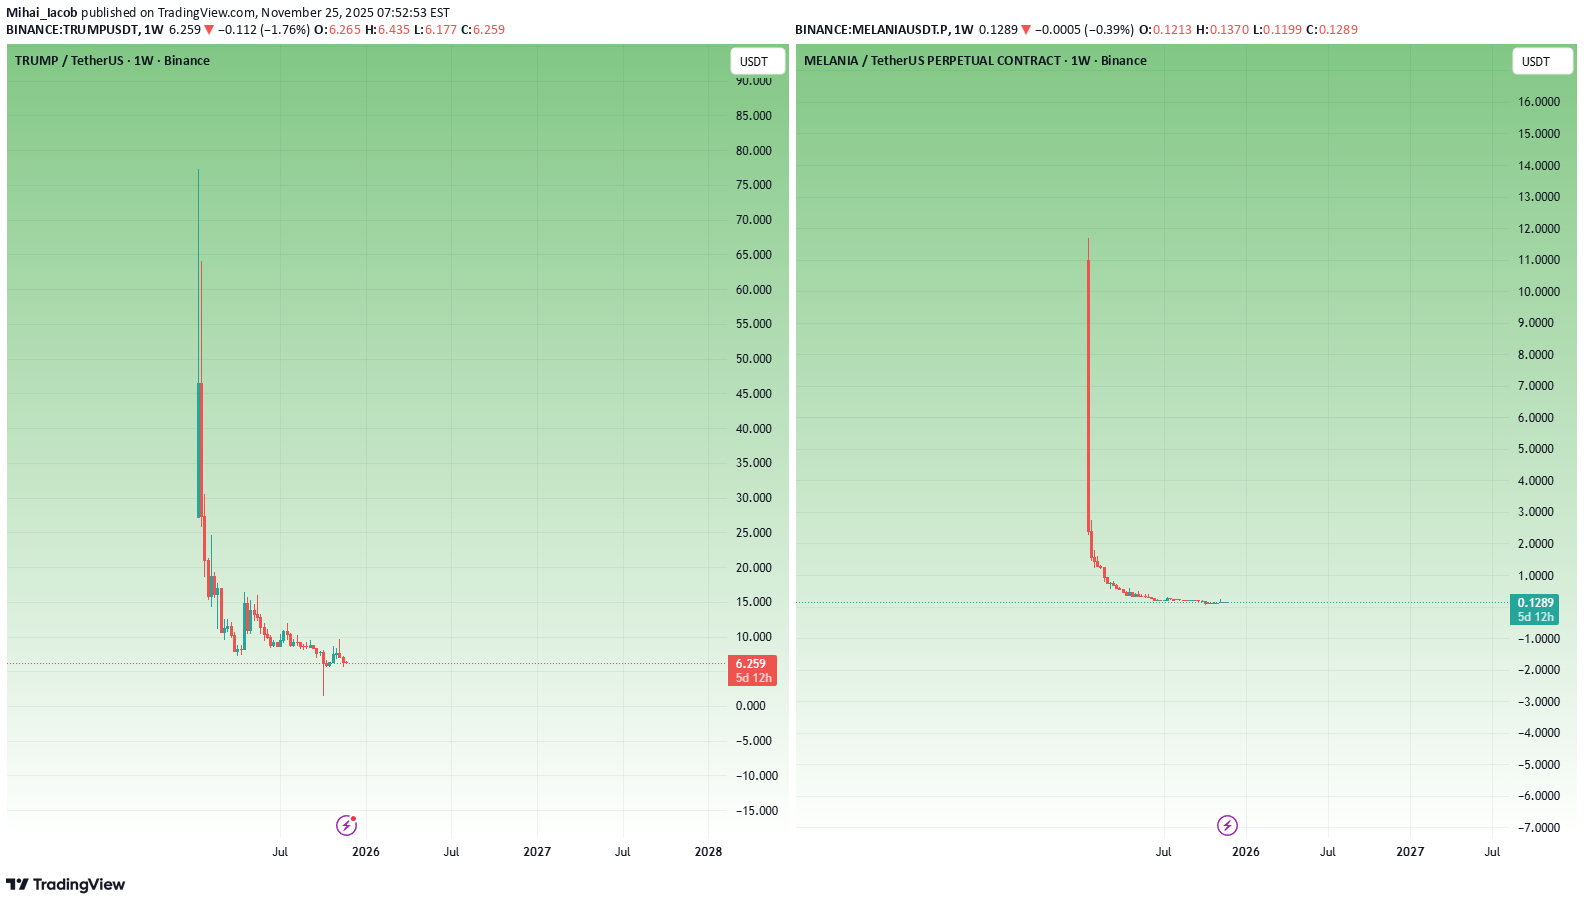
I’ve never been much of a gambler. I don’t chase roulette, I don’t play blackjack regularly, and casinos have never been my second home. But on the rare occasions when I did go—usually dragged by friends who actually like gambling—something strange happened to me. I ended up losing considerable amounts of money. - Not because I thought I’d win. - Not because I had a “system.” - Not because I felt lucky. It was the environment: - the lights - the noise - the adrenaline - the drinks - the atmosphere that hijacks logic And the next morning, the internal monologue was always the same: “See, idiot? Again you drank one too many and managed to lose a Hawaii vacation.” - The regret is real. - The pain is real. - The stupidity is, HOHO, WAY TOO REAL. But the disturbing part? Even though I don’t gamble… even though I don’t chase casinos… the environment alone was enough to override my reasoning. And if that can happen to someone who isn’t a gambler, imagine what happens to someone who willingly walks into a casino every day —because that’s exactly what crypto "investors" do. Crypto markets are casinos with better screens, countless memes, screaming influencers and worse odds. And "investors" forget far too quickly. Crypto "Investors" Forget Too Quickly — Just Like Casino Gamblers Who Keep Coming Back for More Crypto "investors" have one of the shortest memories in financial markets. - Not because they are stupid. - Not because they don’t care. - But because the entire crypto environment is engineered to erase pain and preserve hope — exactly like a casino. Put a gambler in a casino, and he forgets last night’s disaster the moment he sees the lights again. This comparison is not metaphorical. It is psychologically identical. Let’s break it down properly. 1. The Human Brain Is Not Built for Crypto — or Casinos Both environments share the same psychological architecture: - bright colors - fast feedback loops - uncertainty - intermittent rewards - emotional highs - catastrophic lows - near-wins that feel like wins - an illusion of control Neuroscience calls this: Intermittent Reinforcement The most addictive reward structure ever discovered. Slot machines are built on it. Most crypto charts mimic it. Volatility fuels it. When rewards arrive unpredictably: - dopamine spikes - memory of losses fades - the brain overvalues the next opportunity - the pain of the past gets overwritten - the hope of future reward dominates This is why gamblers return. And this is why crypto "investors" buy the same s..ts. 2. The Crypto Cycle Erases Memory by Design After every bull run for an obscure coin: - big money is made (by insiders) - screenshots are posted - what if you have bought with 100usd appear - influencers multiply - everyone becomes a “trading wizard” - Twitter becomes an ego playground - greed replaces rationality After every strong bear move: - portfolios crash 90-95% - people swear “never again” - Telegram groups die - influencers delete posts - conviction collapses - despair dominates But then… When a new "narrative" appears: - Everything resets. - Crypto "investors" forget instantly. No other financial market resets memory this fast. - In stocks, a crash leaves scars. - In forex, blown accounts create caution. - In real estate, downturns shape behavior for years. But in crypto? The new "narative"/ the new hyped coin erases the old one like chalk on a board. 3. The TrumpCoin & MelaniaCoin Episode (Just an Example): The Best Proof That Crypto Traders Forget Too Quickly TrumpCoin and MelaniaCoin didn’t have real value. They weren’t serious projects. They weren’t even clever memes. They were psychological traps built on celebrity gravity. People bought because: - the names were big - the media amplified the narrative - the symbolism felt powerful - the story was exciting And the wipeout was brutal. But the key point is: traders forgot instantly. Within weeks, they were already hunting for: - “the next TrumpCoin” - “the next politician meme” - “the next celebrity pump” - “the next token with a ‘name’ behind it” - "the next 100x" "the next, the next, the next" and is always the same - Not the next valuable project. - Not the next real innovation. - Not the next sustainable investment. No. The next symbol. This is not market behavior. This is casino relapse psychology. 4. These Coins Didn’t Fail Because They Were Memes —They Failed Because They Were Nothing TrumpCoin & MelaniaCoin ( Again, is just an example) pretended to matter because the names mattered. - Traders didn’t buy utility. - They bought a fantasy. The same way gamblers believe a “lucky table” changes their odds. In crypto, people believe: - the celebrity matters - the narrative matters - the hype matters Reality doesn’t. 5. Why Crypto "Investors" Don’t Learn: Because They Don’t Remember Crypto "investors" are not stupid. They are forgetful. They forget the months of pain and remember only the few happy moments. They forget: - drawdowns - stress - panic - illusions - scams - broken promises - influencers lies They remember: - one good run - one moonshot - one dream This is why most altcoins and memes thrive. Not because they deserve to. But because forgetting resets demand every time. 6. The Industry Is Designed to Exploit This Amnesia If traders remembered: - Luna - FTX - SafeMoon - ICO (2017) crashes - NFT (2021) collapses - Meme mania recently …the most of the altcoin sector would evaporate overnight. But "investors" forget —so altcoins with a "nice" story resurrect. Like slot machines resetting after every gambler walks away. 7. The Cure: You Don’t Need Better Tools — You Need a Better Memory The greatest edge in crypto is not fancy indicators, bots to be the first in, or whatever invention comes next. It’s remembering. Remember: - why you lost - how you lost - which narrative fooled you - how the market humiliated you - what the casino environment does to your brain - how celebrity tokens wiped people out Crypto trading requires memory, not optimism. Conclusion: Crypto "Investors" Forget Too Quickly —And That’s Why They Keep Losing Crypto "investors" don’t think like REAL investors. They think like gamblers: - emotional - hopeful - impulsive - forgetful convinced “this time will be different” The latest meme mania proved this perfectly. Crypto is not dangerous because it is volatile. Crypto is dangerous because it erases your memory. The "investor" who forgets loses. The "investor" who remembers wins. Because in crypto: The moment you stop forgetting is the moment you finally start winning. P.S. (A Necessary Clarification, Said Gently — and Honestly) Throughout this article I used the word “investors” in quotation marks — and it wasn’t an accident. Most of the people who call themselves investors in crypto are not actually investing. They are speculating, chasing, hoping, and gambling on meme coins and obscure altcoins purely because “they have 100x potential.” Let’s be honest: - buying a token named after a frog - or a coin launched yesterday by anonymous developers - or a “next big narrative” pump with zero product - or a celebrity meme coin - or something that exists only on Twitter…is not investing. It’s gambling dressed in nice vocabulary. And that’s okay — as long as you know what it is. Also, to be clear: When I critique “altcoins,” I am not talking about all of them. There are real infrastructure projects, real protocols, real technology, and real builders out there. But let’s not pretend: 90% of altcoins exist for hype, for extraction, for speculation, and for the dopamine of “maybe this one will moon.” I’m talking about those coins — the ones that behave like slot machines and survive only because traders forget too quickly. If this article made you uncomfortable, good. Sometimes the truth has to sting before it can help.

CryptoVhagar
آیا ریزش میلینا تمام شد؟ پیشبینی حرکت برگشتی و فرصتهای خرید!
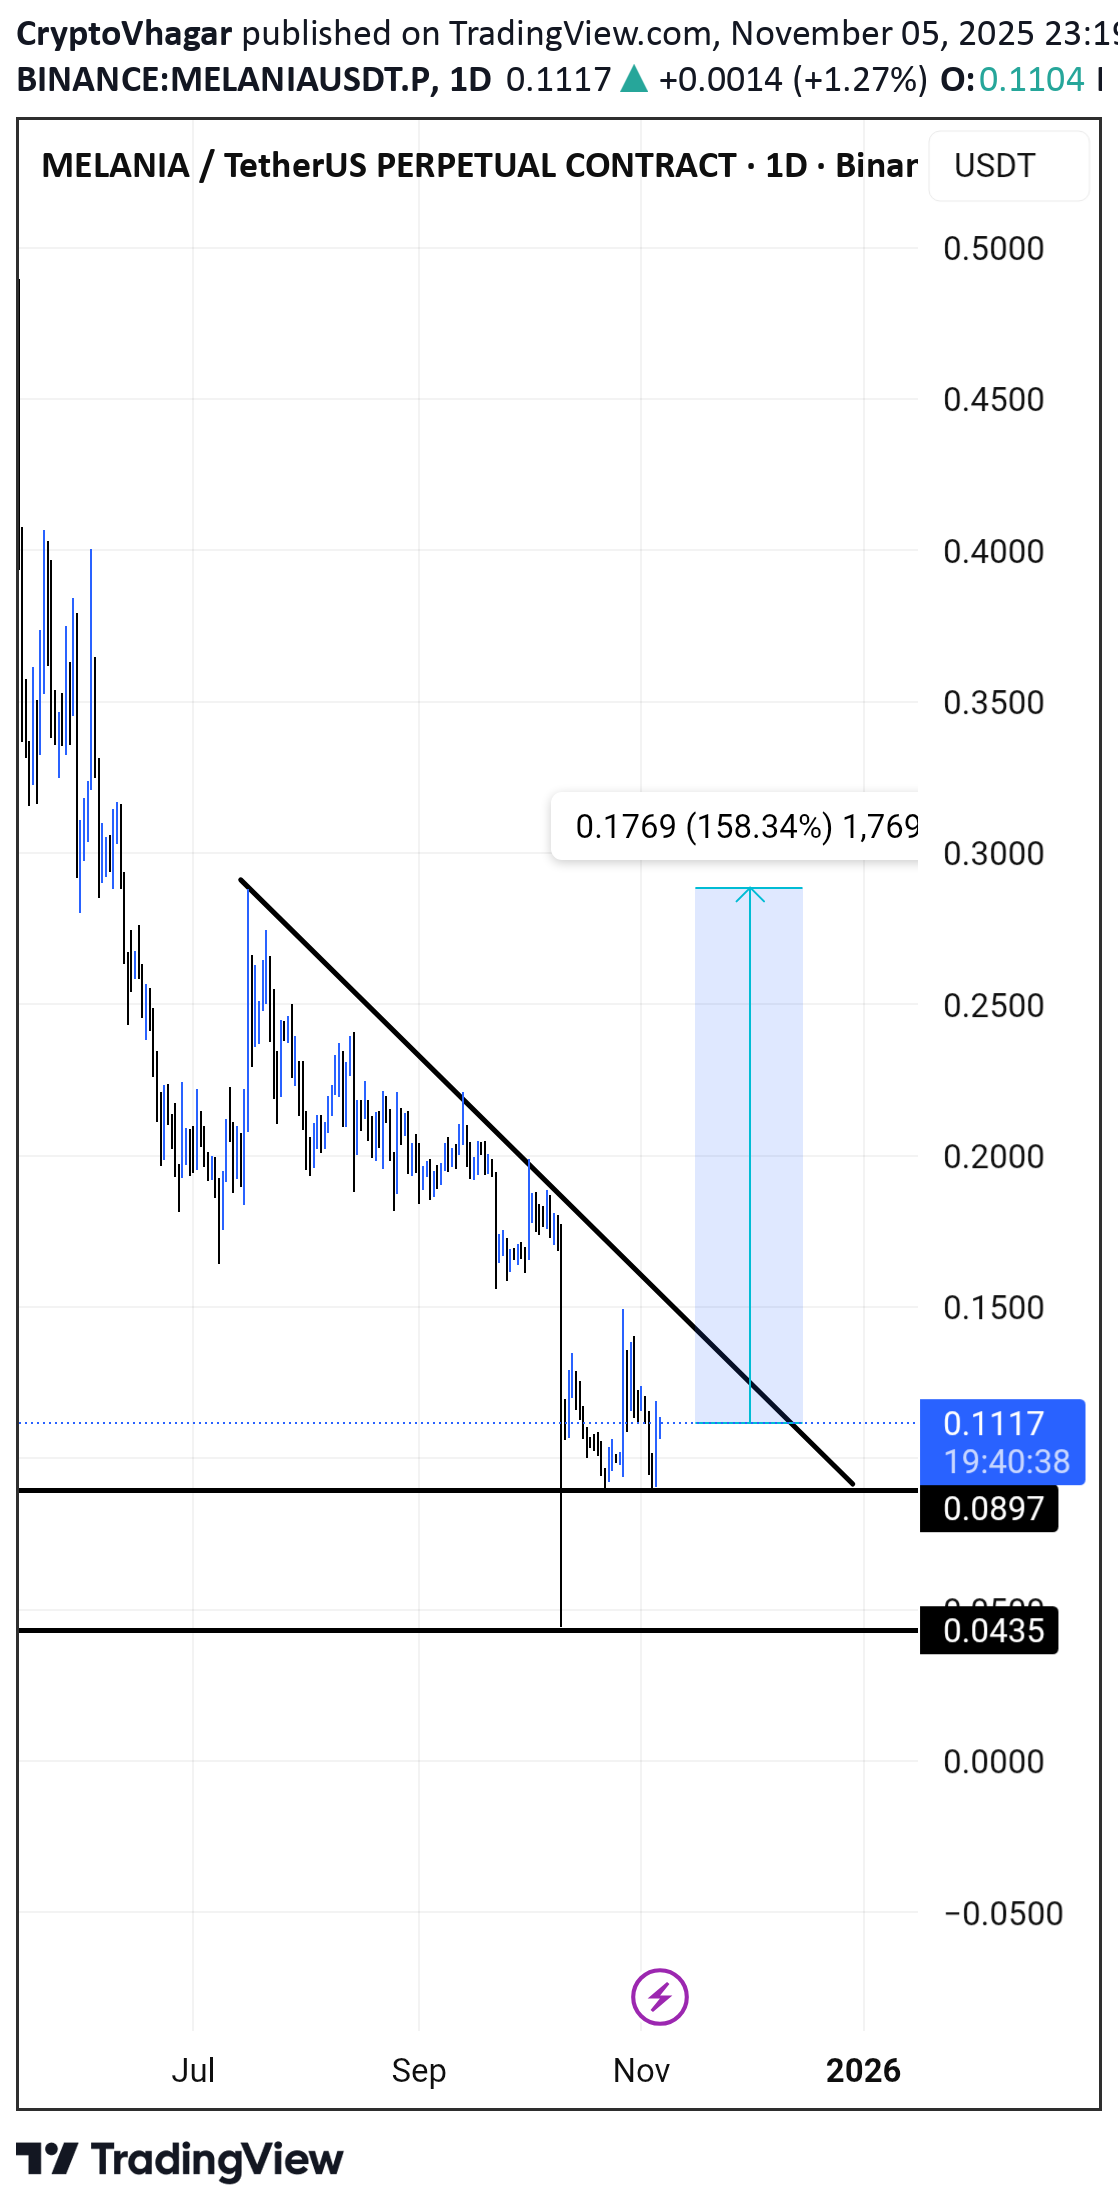
Melania dropped so much. I think the bottom is in reversal will take place.

SevenStarBuySell
سیگنال فروش داغ در ملانیا: آیا وقت خروج است؟ (تحلیل با اندیکاتور 7 ستاره)
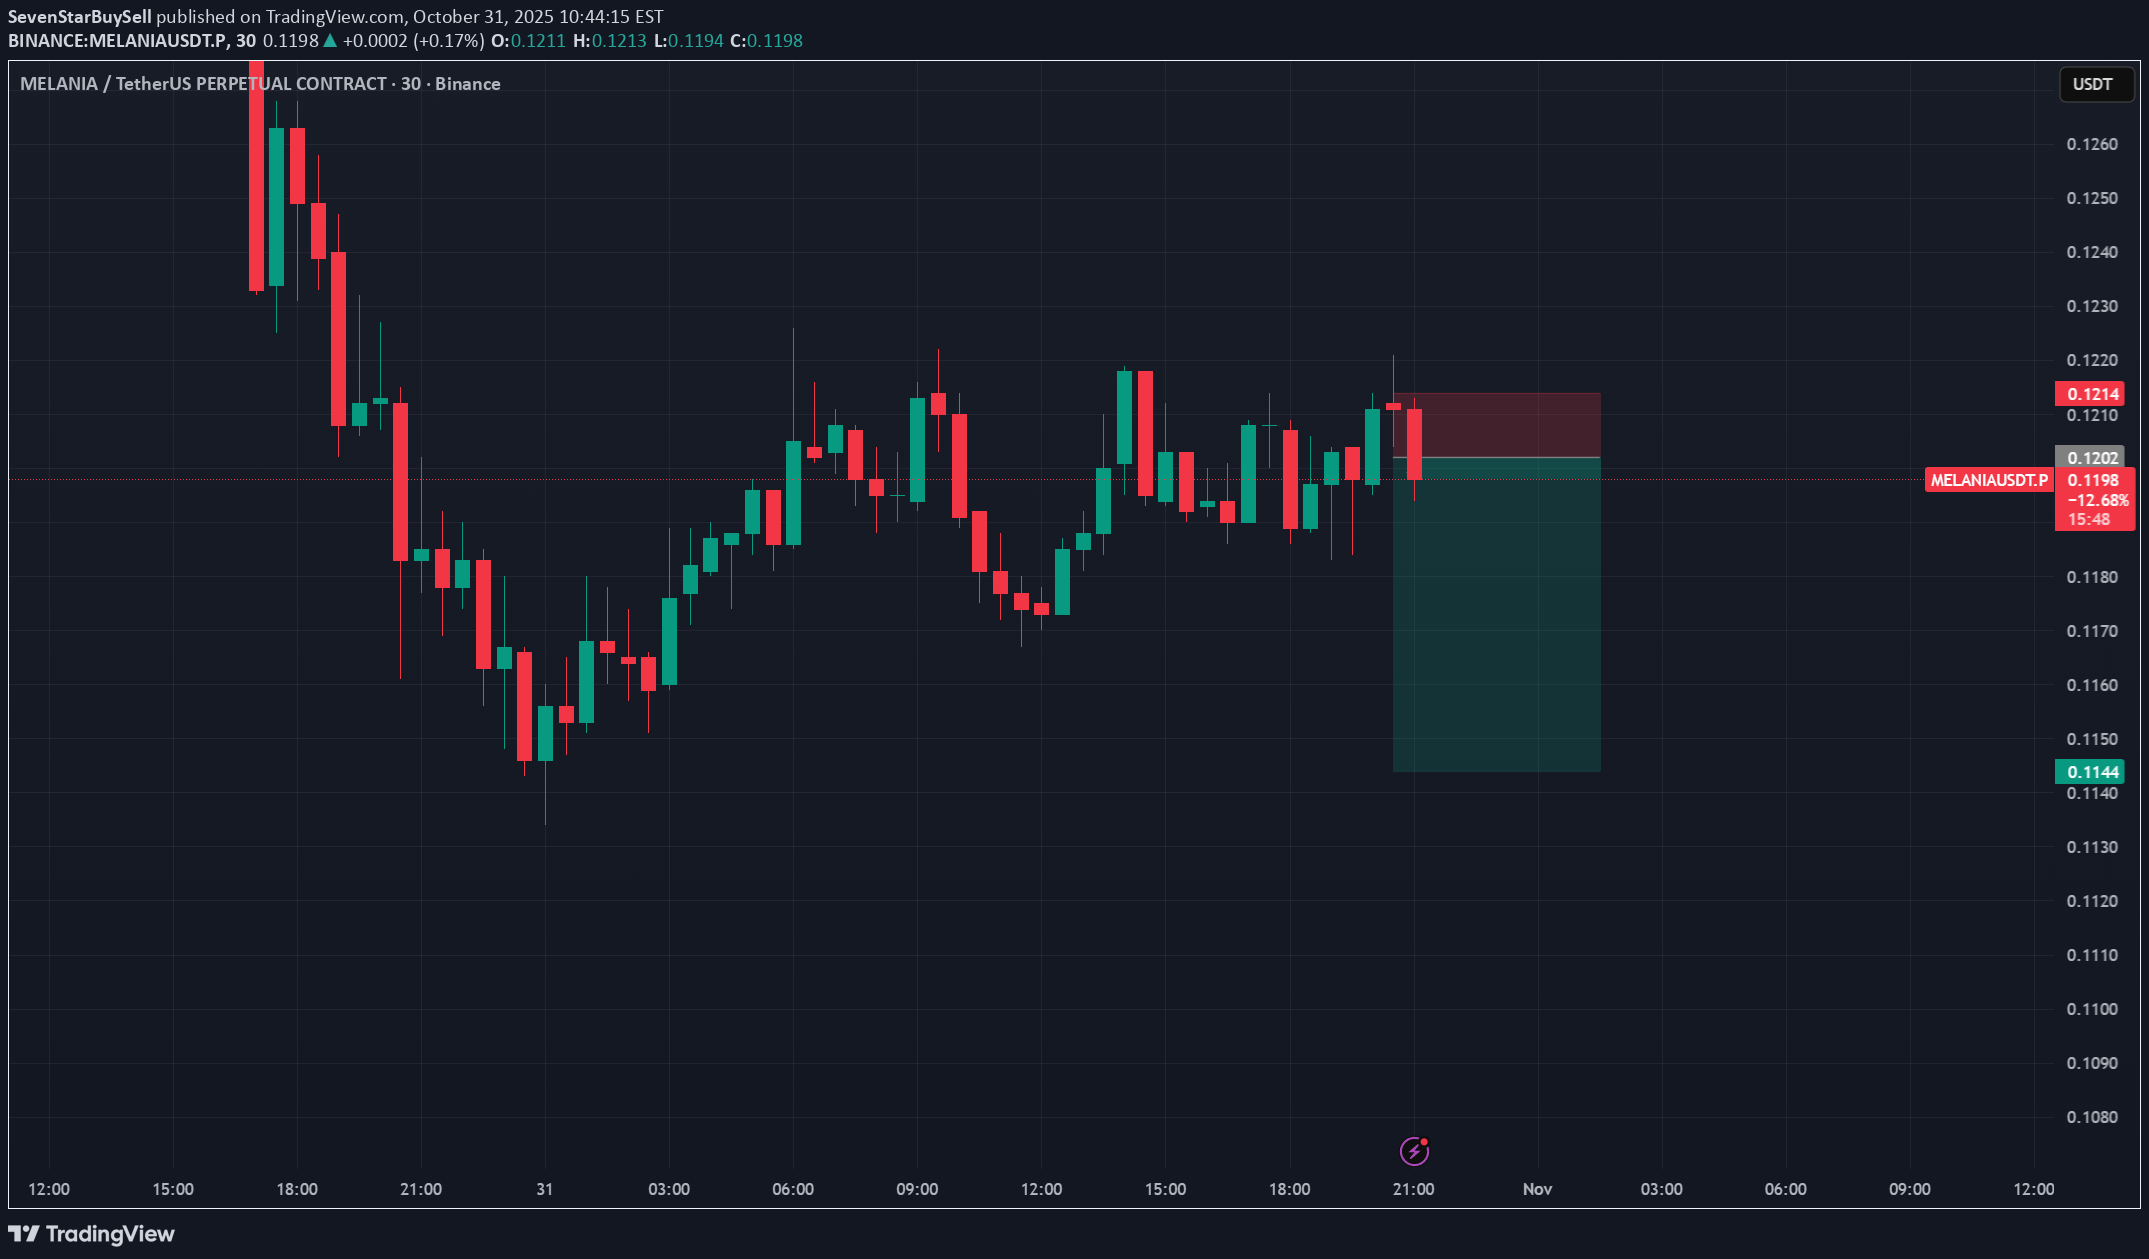
We have a sell print in Melania according to our 7-star buy and sell indicator. Let's see how it plays out. Targets on the charts. For Indicator access you can contact. me. D Y O RMore than 50% profit after our call. For indicator access you can contact me.
SevenStarBuySell
سیگنال شگفتانگیز در ملانیا: آیا ریزش قطعی است؟ (پیشبینی فوری)
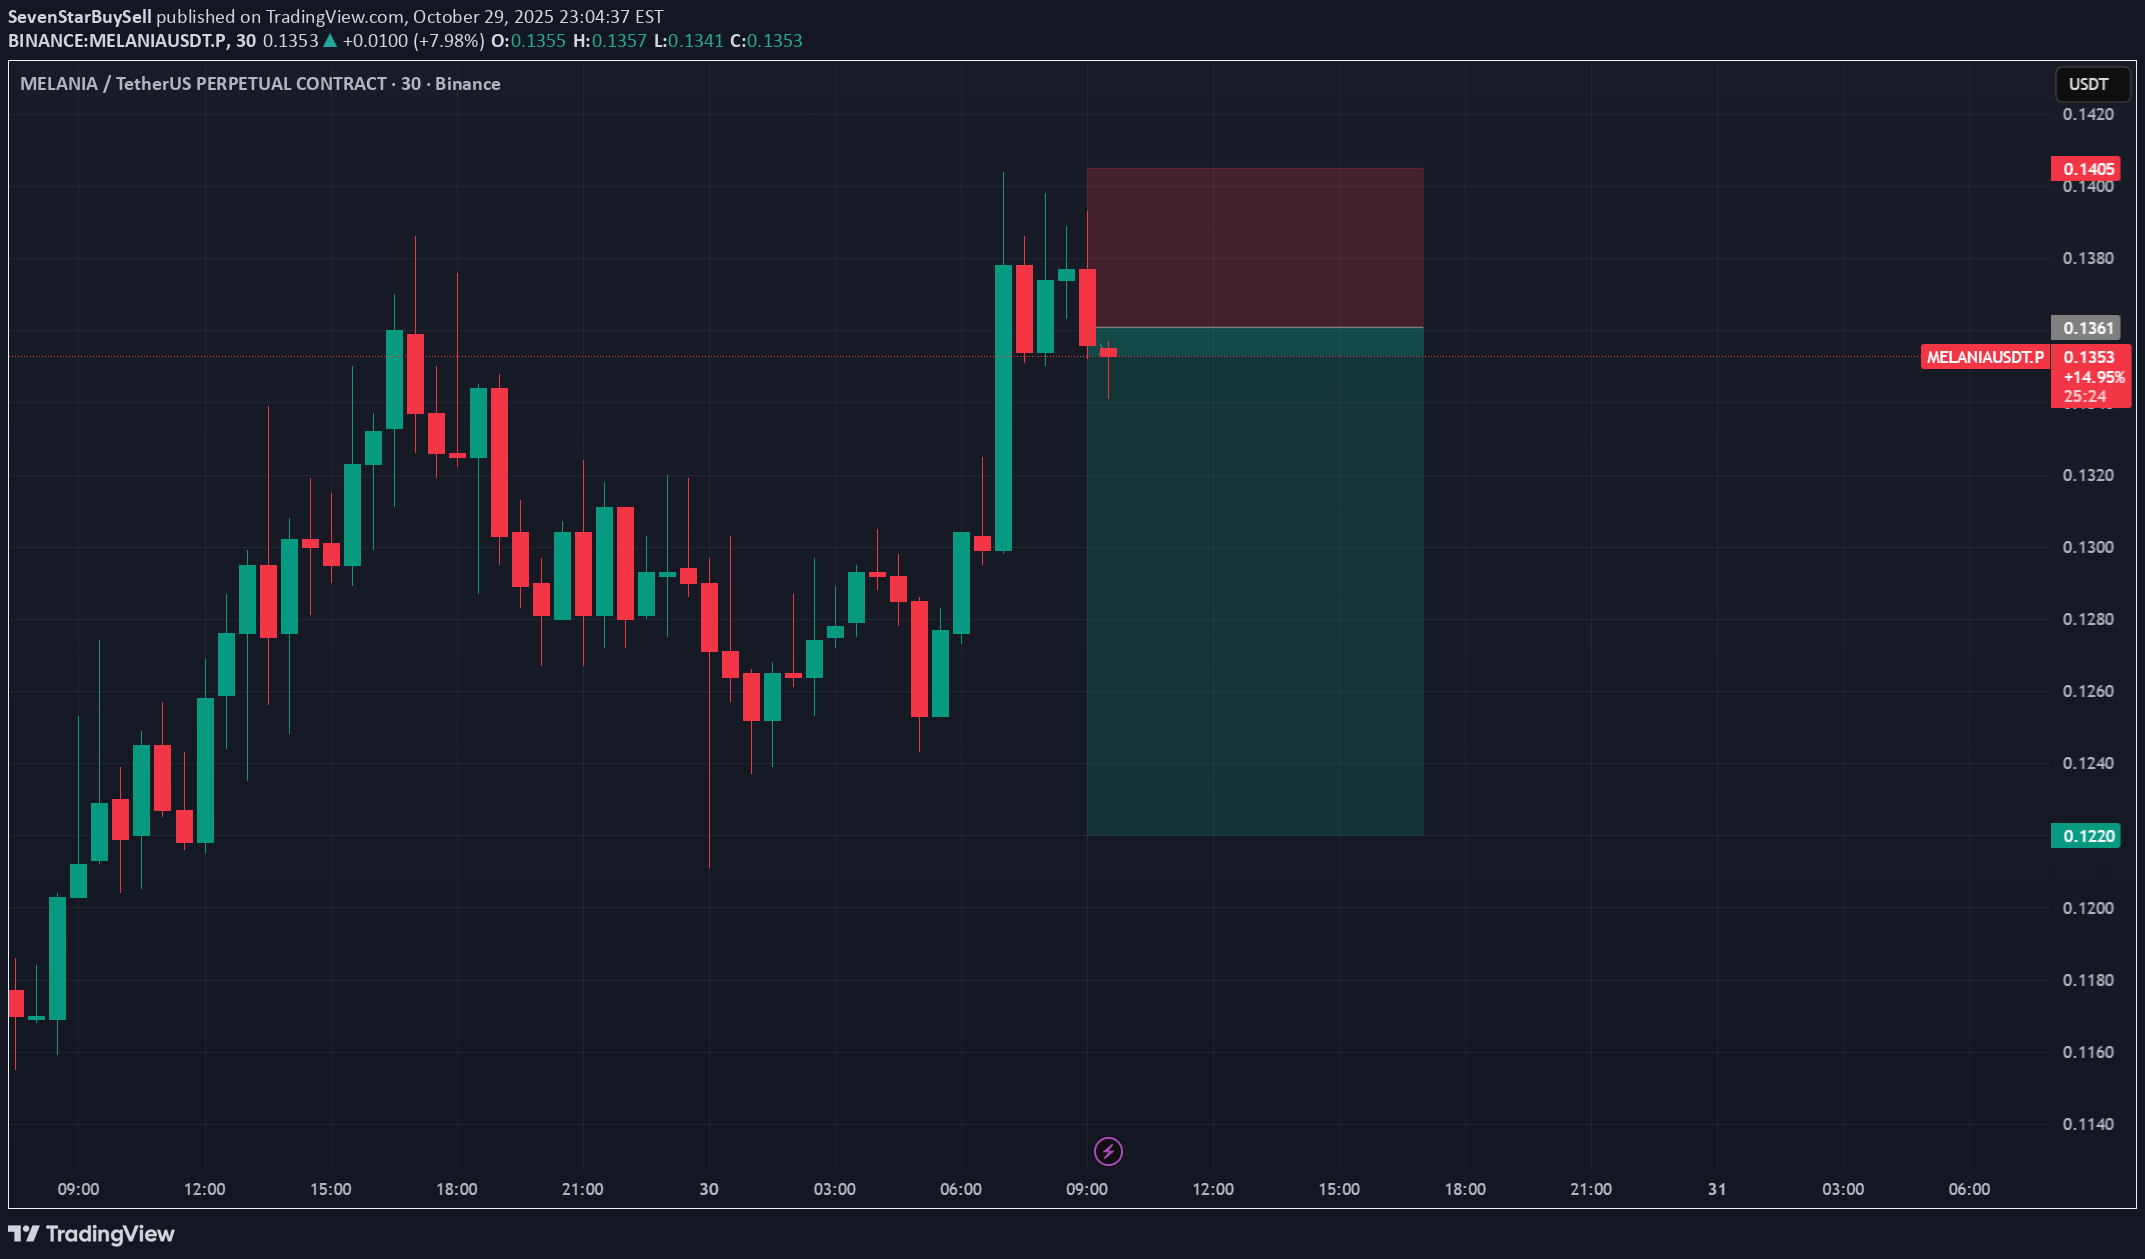
We have a short print in Melania according to our 7-star indicator. Let's see how it plays out. For earlier access to our signals you can use our indicator. DYOR

MasterAnanda
Melania Meme · 877% Profits Potential & Technical Analysis

After 22-April, trading volume starts to go up, hard. MELANIAUSDT starts a final descent. 8-July marks the downtrend bottom and once more trading volume goes up, hard. It goes up really high but still, sideways. Not very strong bullish action but at least the downtrend is gone. Yesterday, 25-August; MELANIAUSDT produces a higher low compared to July, and again my dear friend and reader trading volume starts to go up. Really strong. We are ready for a new bullish wave. MELANIAUSDT is moving above EMA8 and EMA34 today on the daily timeframe. This chart setup can lead to some very good results. This is exactly what we like to find on a chart. The first thing is low prices, the action happening near support. This is a positive here and we have a higher low. We not only want low prices but we want to see recovery signals, reversal signals and confirmation signals. » The recovery signal is the higher low. The reversal signal is the move above the moving averages and the confirmation signal is the rising volume. This is a strong combination. A medium strength bullish wave can hit a target of $1.26 for a nice 487% profits potential. MELANIAUSDT can easily go higher. You can notice on the chart a target at $2.10 for 877%. There is room for more, this is only mid-term. I am showing only a portion of the chart. Namaste.

Crypto-by-PRIME
Melania / USDT : Buy every dip

MELANIA/USDT has successfully broken above the descending trendline, confirming the breakout. This shift suggests a bullish move, with the price now aiming towards the next target at $0.40 . The breakout indicates a change in market sentiment, and if the price continues to hold above this level, we could see further upward movement. Ensure proper risk management as the trend develops.

SpartaBTC
MELANIA Main Trend. Memes with high hype and risk. July 17, 2025
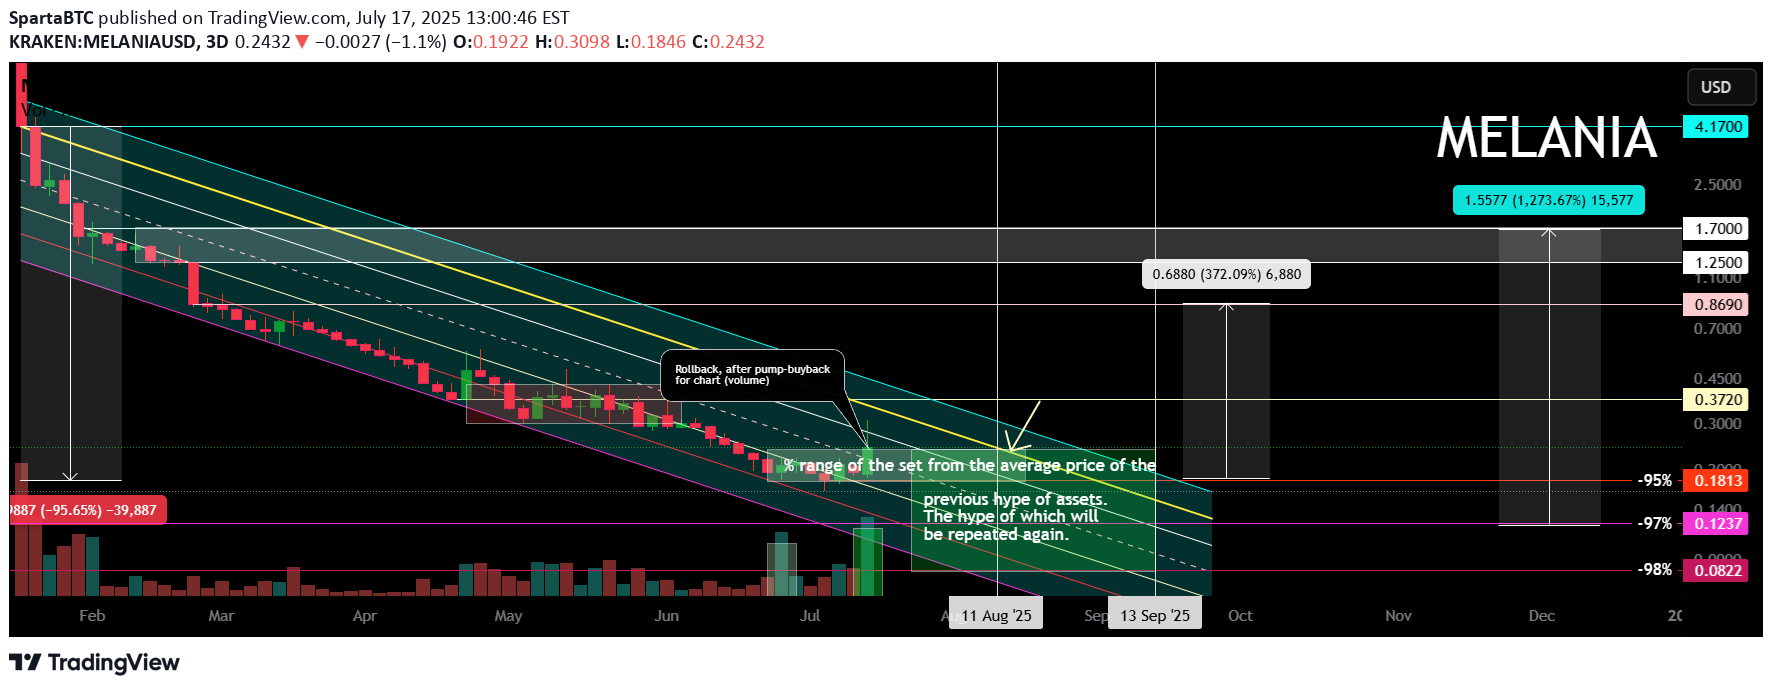
Main trend. Time frame 3 days (less is not necessary). Showed conditional levels (zones near them), and percentages of decrease from the maximum (note, I showed from the zone where the main retail of “affected investors” began to connect, that is, the maximum is much lower than on the chart). Note that now a conditionally large volume “enters”, it is displayed on the price chart (this is important), a sideways squeeze has begun. Local impulse and rollback are now in the moment. Also showed a large % (intentionally) for orientation, from minimum to maximum zones. On such hype assets, as a rule, medium-term - long-term holding (bought in the right zone) shows significant income. All level zones are conditional, due to liquidity, but the price will most likely “play” after the breakdown of the downward trend in this range, another alt season (which many do not notice due to the slow breakdown of their opinions, news chaff, and inadequate goals). As for me, above these huge % (resistance zone, or up to 0.869, so as not to waste time), you should get rid of this meme, or its % from the previous position should already be minimal (5-10%). There are hype zones, there are zones of potential gain (fading hype, interest, and a large % from the maximums). On such assets of "manual trading", where cryptocurrency has no value, it is always sold little by little (many do not understand this), but in order to sell, you sometimes need to make interest, and "instill hope" in previously deceived "investors" who want to get out at least at a loss (it is unlikely to happen). At the right time, 1-2 tweets - statements from the "powers that be" - are pumped up due to low liquidity by a huge percentage. On such cryptocurrencies, you do not need to guess the “bottom” or maximums. Pricing is formed differently here, as there is no real supply/demand, utility, but only psychology and "hitting the jackpot" of gambling addicts. Be smarter. Diversify such assets, distribute the risk in advance. Make purchases/sales according to plan, without emotions. When the price goes up, you think it will go much higher, but even if it does, you must sell a certain volume in certain planned zones, without any emotions or sense of lost profit. Similarly, when the price goes down, people are driven by fear and refuse to buy, and these were probably the minimums of fear. The average price of the set and reset is important. No minimums and maximums are needed. Be patient and consistent in your actions and plans.21 07 2025 very local "trump's wife-pump".November 19, 2025 the price is in the capitulation zone (under the conditional accumulation channel, meaning that they always sell "without loading the order book"), with large volume buybacks. To continue selling, you need to generate interest and restore hope, meaning volatility and pumps. Perhaps an exit from this zone. If this happens, then, as a rule, with such assets with such low liquidity and a huge connection to "dumb money" traffic (millions and hundreds of thousands of Twitter followers), the price is reduced by a large percentage, but the chart still roughly follows logic. How to adhere to money management and what trading tactics to use on such useless hyped cryptocurrencies has been written about many times before, so I won't repeat myself. Those who have intelligence will hear, those who don’t, as always.

TehLamboX
$MELANIA | Descending Channel Breakout Confirmed
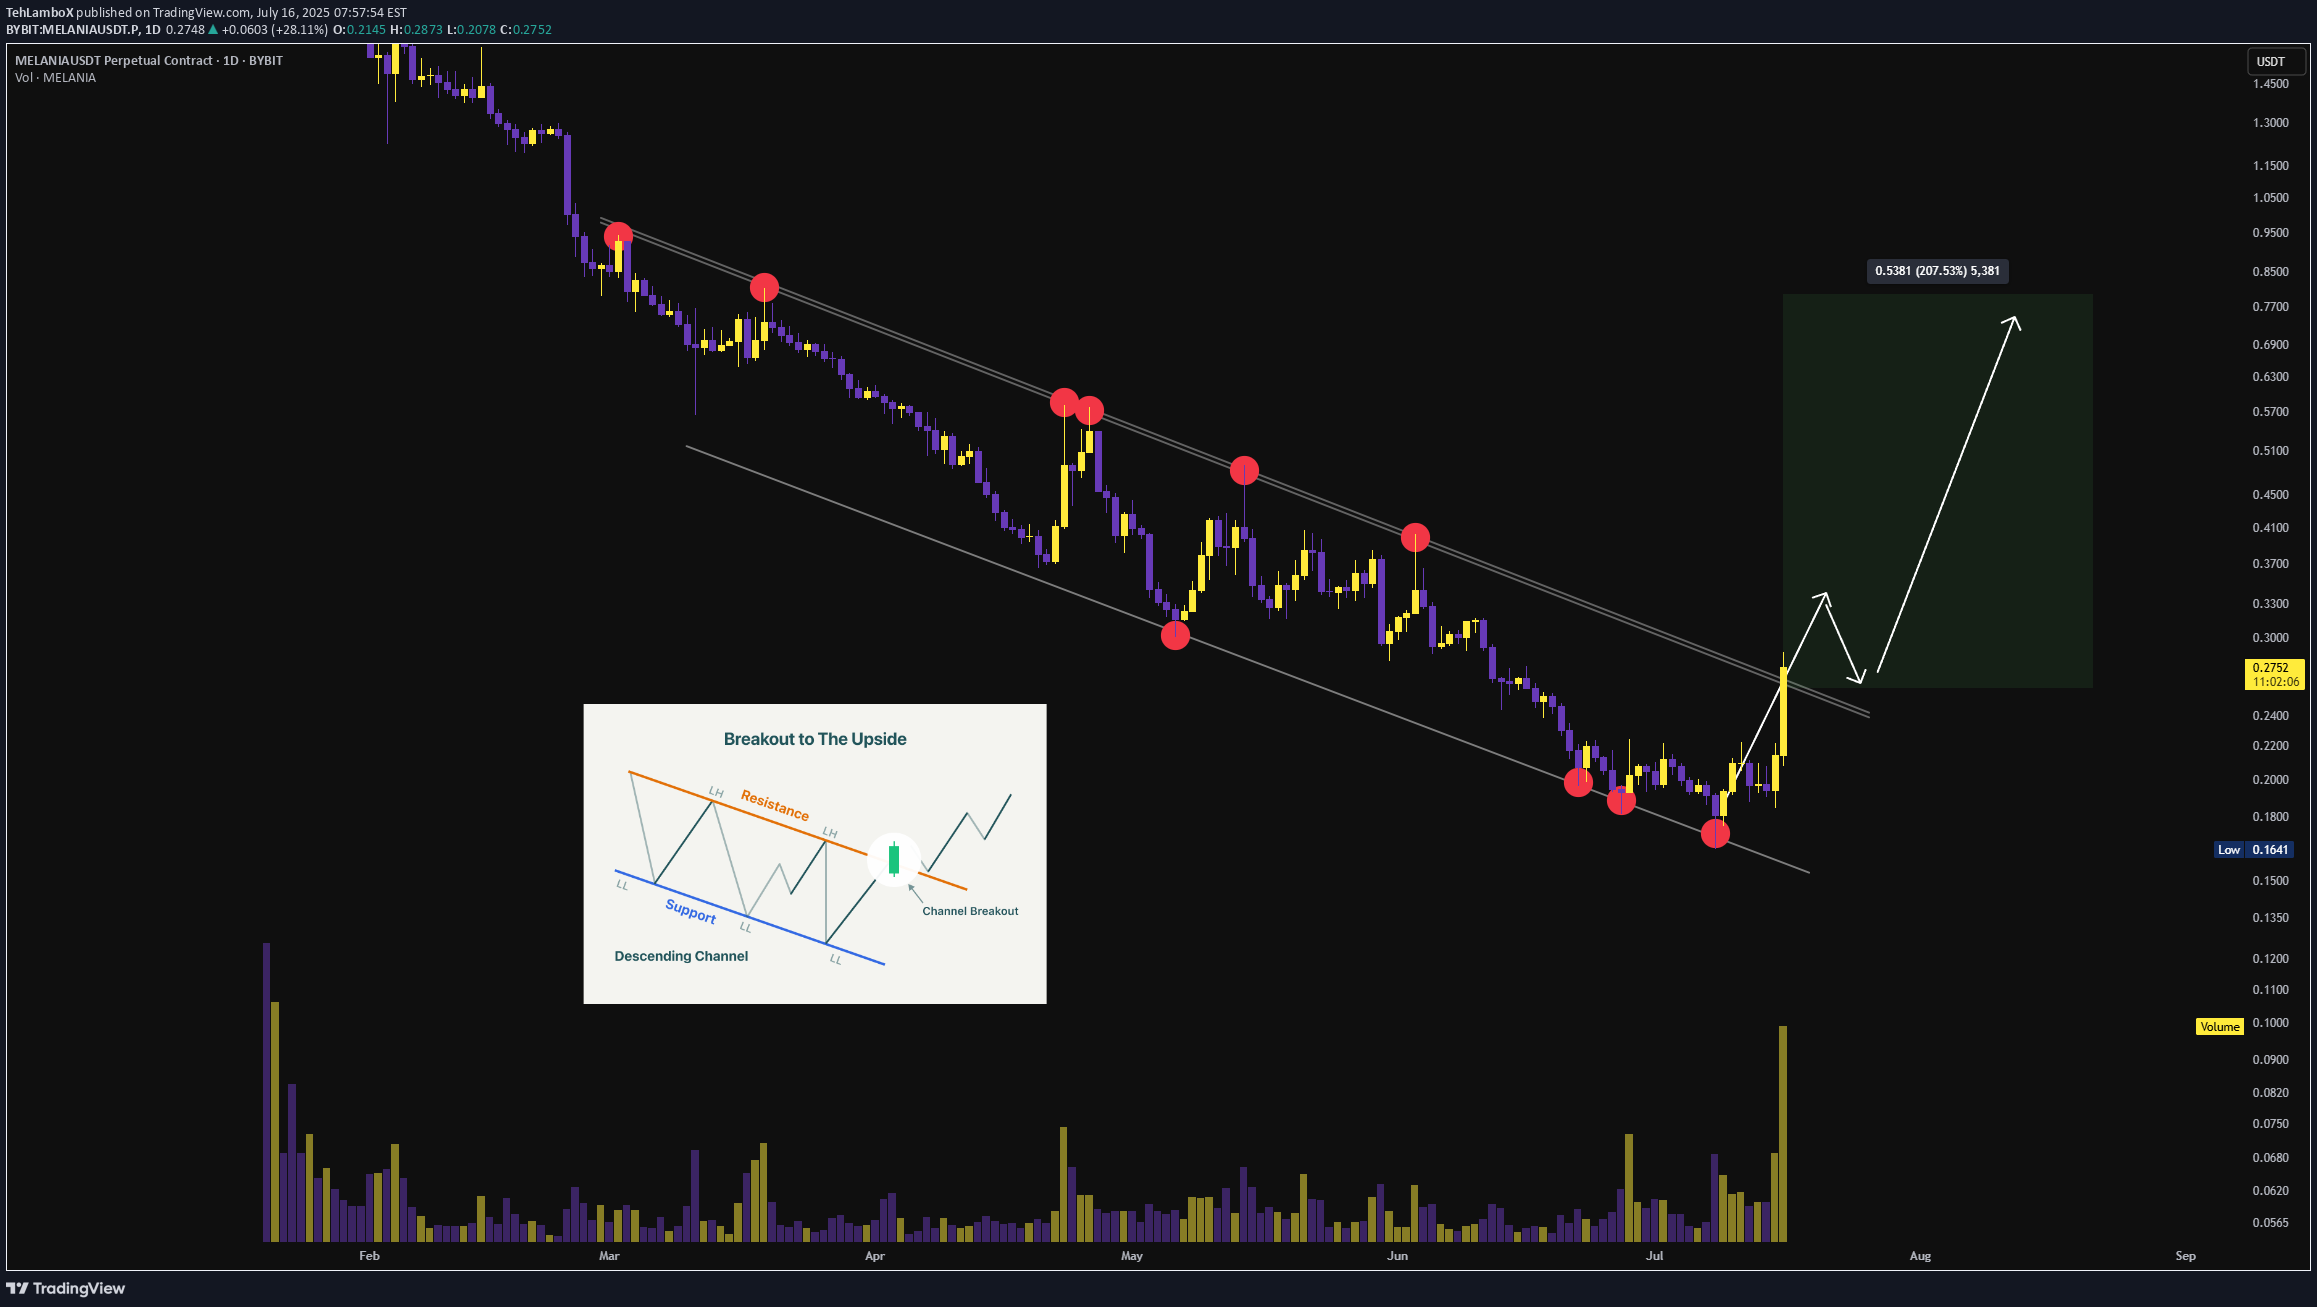
After months of compression within a well-respected falling channel, #MELANIA has printed a high-volume breakout above the channel resistance — confirming a reversal structure with strong momentum expansion. 🔍 Technical Confirmation: • Breakout from long-term downtrend resistance • Multiple clean touches on channel boundaries (valid structure) • Bullish engulfing candle with volumetric confirmation • Price action suggests potential retest before continuation 🎯 Upside Targets based on measured move and fib projections: → $0.40 (structural pivot zone) → $0.50 (supply confluence) → $0.80 (channel height projection) Watch for bullish retest of breakout zone to confirm continuation
Disclaimer
Any content and materials included in Sahmeto's website and official communication channels are a compilation of personal opinions and analyses and are not binding. They do not constitute any recommendation for buying, selling, entering or exiting the stock market and cryptocurrency market. Also, all news and analyses included in the website and channels are merely republished information from official and unofficial domestic and foreign sources, and it is obvious that users of the said content are responsible for following up and ensuring the authenticity and accuracy of the materials. Therefore, while disclaiming responsibility, it is declared that the responsibility for any decision-making, action, and potential profit and loss in the capital market and cryptocurrency market lies with the trader.