
MasterAnanda
@t_MasterAnanda

What symbols does the trader recommend buying?
Purchase History
پیام های تریدر
Filter
MasterAnanda
Bitcoin recovers, set to move back above $100,000

Bitcoin just hit the highest price since the bearish breakdown, we have a local uptrend, a technical confirmation of the relief rally and recovery. First, we used the chart signals to predict a reversal and relief rally. Now, it is confirmed based on Bitcoin's price action. We have higher highs and higher lows since 21-November. This fully reveals that we are headed higher in the coming weeks. All the altcoins are also recovering and/or moving forward for a while now. In the last 24 hours, $216.2M worth of SHORT positions have been liquidated, vs only $11.7M worth of LONGs. This clearly reveals an overwhelming bearish bias and sentiment on Bitcoin and the altcoins market. What happens when the sentiment changes from bearish to bullish? What happens when the market realizes that we are headed up? I'll tell you, a massive bullish run. Namaste.
MasterAnanda
BOOK OF MEME · Leverage vs Spot · Should I Plan or Not?
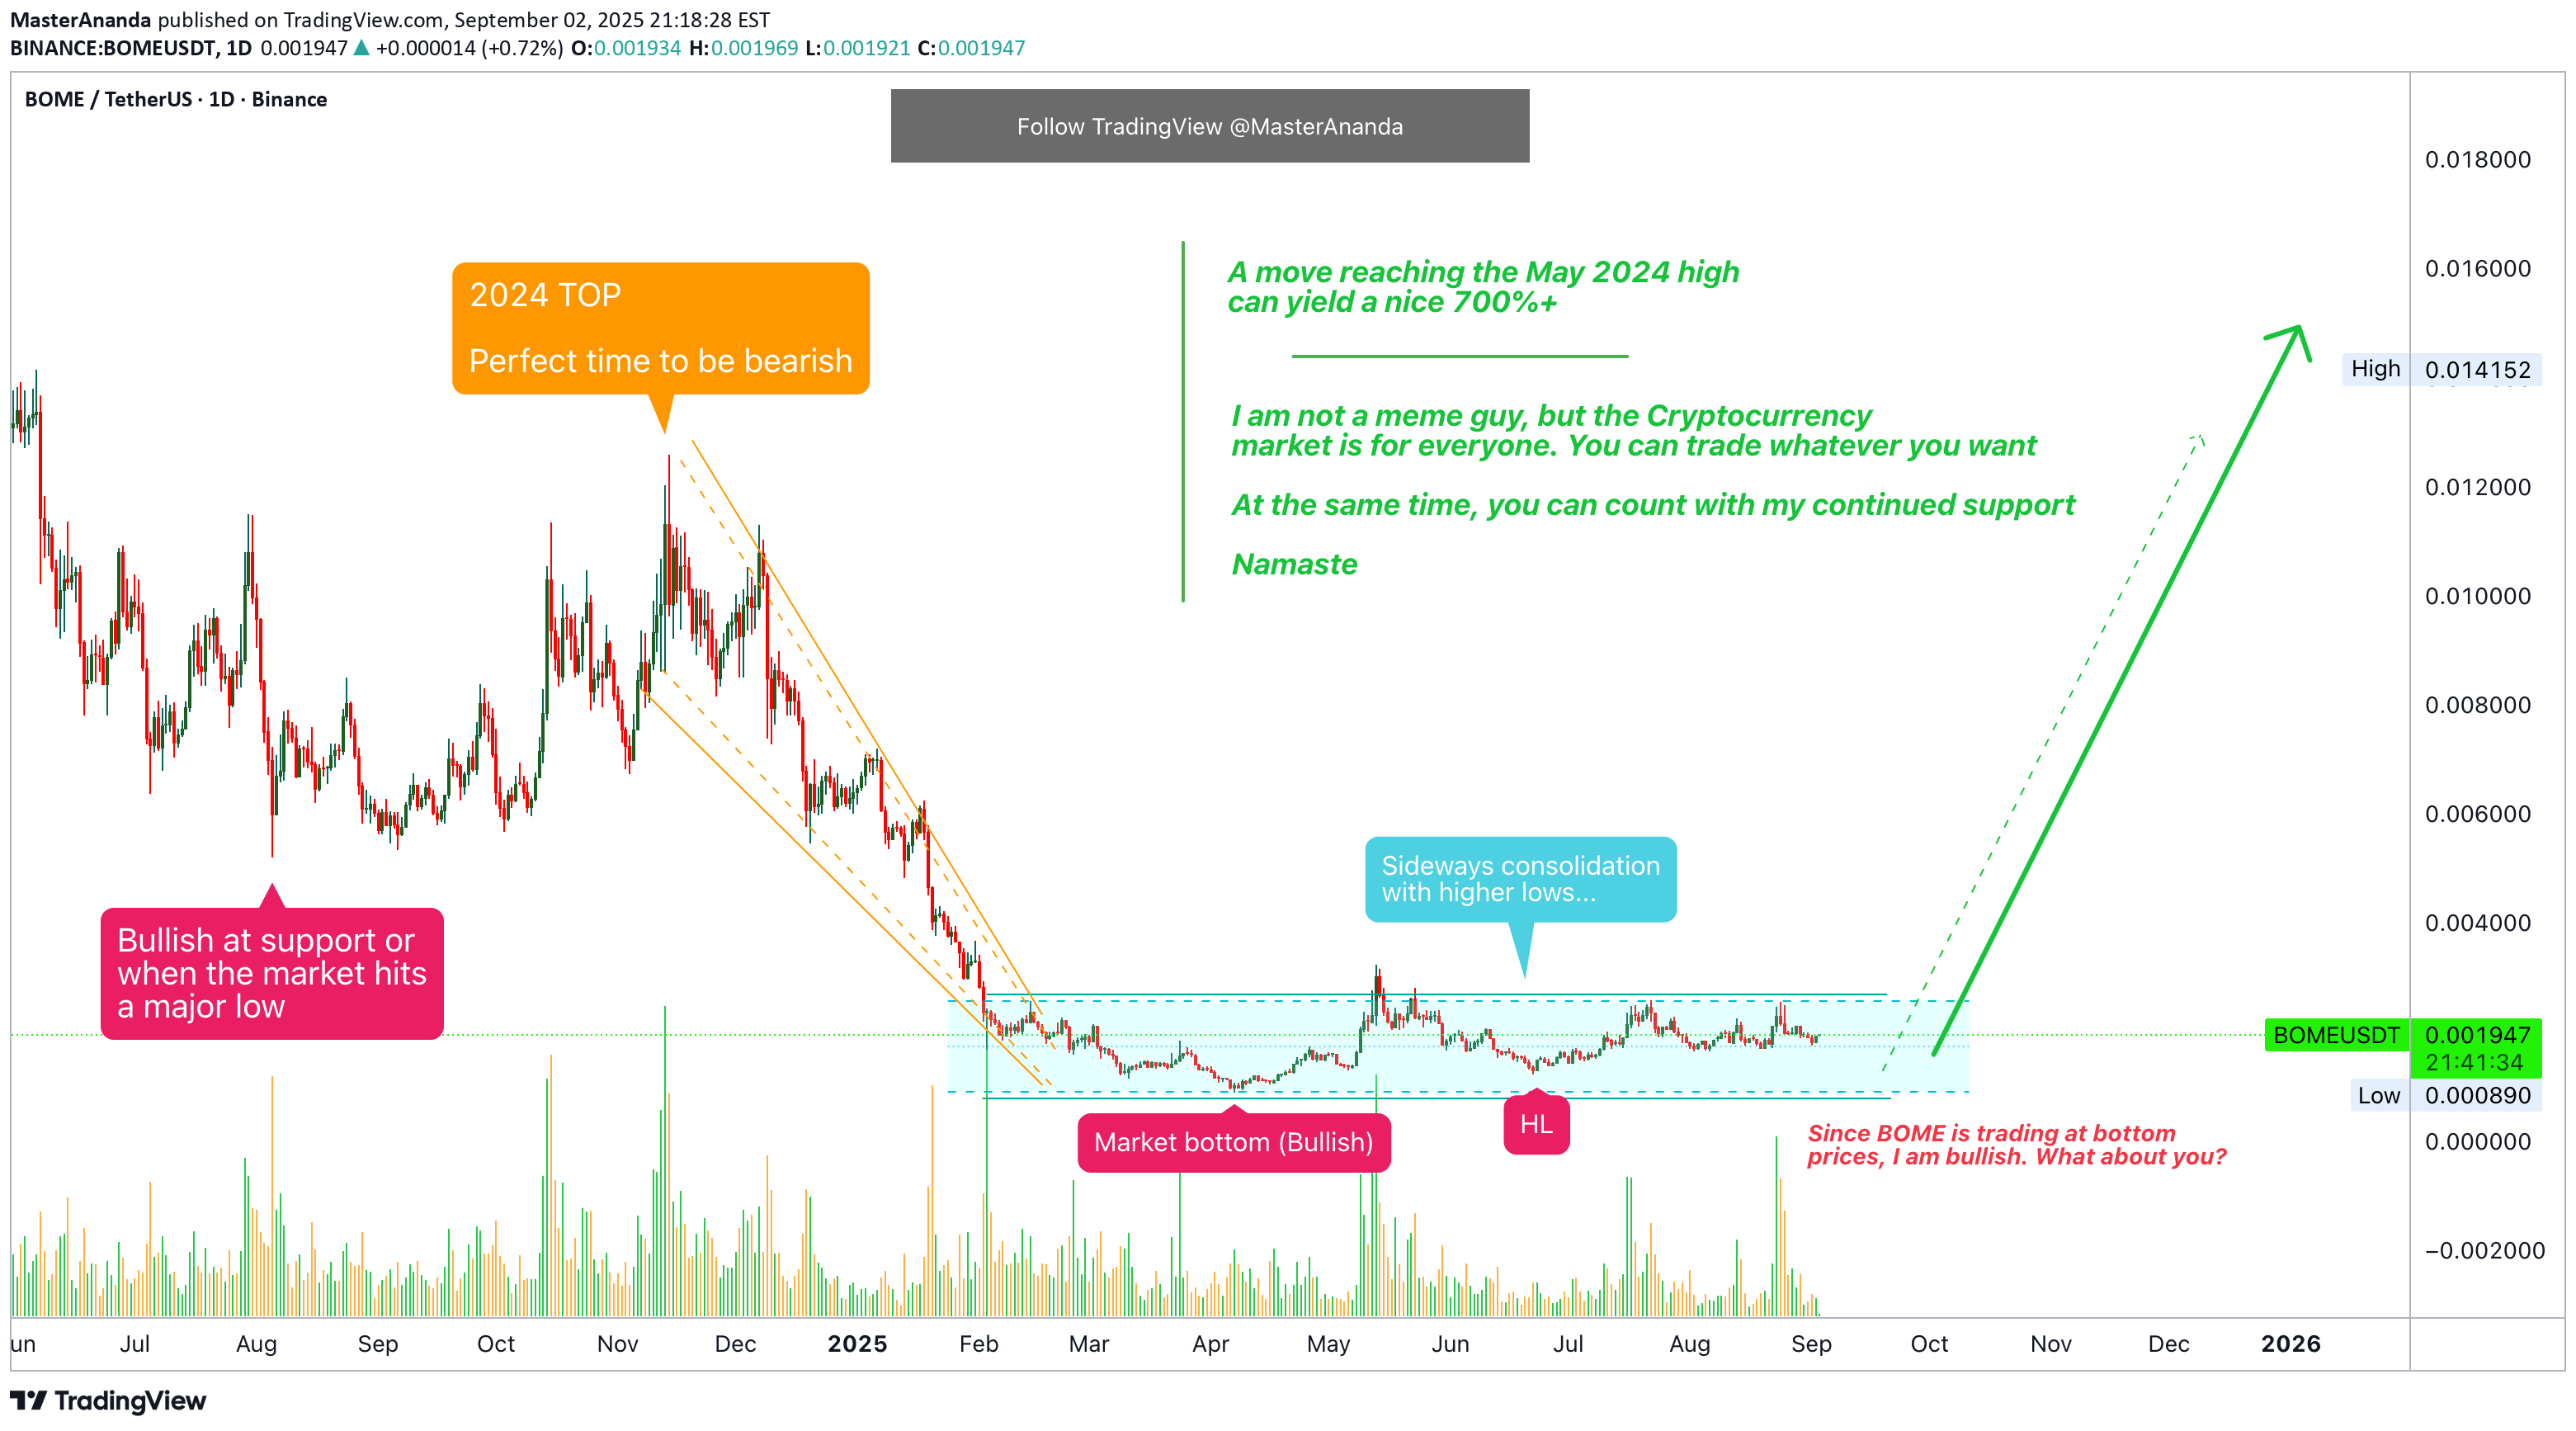
With the log chart we can focus on growth potential, the all-time high, highs and lows, the bigger picture, the chart structure and long-term cycles. With the linear chart, we can know the truth of a pair. Are we looking at a cycle top or bottom prices? BOMEUSDT (BOOK OF MEME) is bullish based on current price action and trading volume. Looking at this linear chart, it is easy to see BOME consolidating sideways after hitting bottom. It is easy to see a major cycle (left), a major crash and then the market going sideways. If I were to show a log chart, the action after February would be really pronounced and you would see lots of bullish and bearish moves. These are indeed happening but are minimum—small—compared to how the market actually moves. Market noise. If I were to focus on the short-term, I would have to become Nostradamus in order to be able to predict the next move. If I focus on the long-term as I usually do, I can easily predict what is going to happen next. As a group, we cannot beat the market because we are the market; but, there is no need to "beat" the market, we only need to make money and there are many ways to make money; choose what works for you. We choose low risk vs a high potential for reward. We choose simplicity and a strategy that works. Literally, just buy and hold. I understand leverage (margin) and I use it of course, but I cannot cry if I incur a major loss. I cannot cry, blame and complain if things go wrong; why? Because before making the first purchase, the first move; before making a decision or any trade, the first thing to consider, adapt and accept, is the fact that all money can be gone in a flash, that's the thing about leverage trades. If things go right, you get to win big but, if things go wrong, you get to lose everything... Not really, if you control your position size your risk is limited. Ok. Asymmetric risk/reward. Maximum 5% out of the risky trading capital goes on a single trade. It can be 3% or even 2% or 1%. If you can't make money slow, you won't be able to make it fast. Making money is an art and trading is the same. It is a craft, a profession, a job, a career; call it what you want, but it takes effort, and, since there are so many smart people doing the same, we have to be smart when we decide to participate. How can I be smart when trading? Build a plan before taking action. I love you. I am literally feeling true love right now as I write this, I hope it reaches you. Thanks a lot for your continued support, it is appreciated. Namaste.
MasterAnanda
Bitcoin Daily MACD & RSI, Most Likely Scenario & How To Trade
To many people Bitcoin is mixed right now or even bearish. The $125,000 price tag is the cycle top and we are due a massive bull market. To me, Bitcoin is bullish and more growth is definitely possible. If this is true, we should find some hints on the chart. If I am wrong, most of the signals should point lower. It would be impossible to fine dozens of bullish signals on this chart. Let's read the chart and see what happens. Bitcoin's daily RSI doesn't look great but we have an interesting signal, let me show it to you. And the indicator right now leans more bullish rather than bearish. We are looking at the daily timeframe. BTCUSDT (D) RSI There was a low 22-June followed by a bullish move. The next major low happened very recently, late August. Notice how the late August low managed to reached below the 22-June low, a lower low. A weak one so it can also be considered a double-bottom. BTCUSDT is quite different. 22-June we had a low $98,186. In Late August, the lowest Bitcoin did was $107,250; a higher low. This is a classic hidden bullish divergence. This signal is not very strong but it is a start. A divergence can show up for weeks or even months before it reflects on the price. The fact that Bitcoin continues to trade above $110,000 more than 52 days after peaking is also positive. But these are not definitive signals, it is more of a mix. The MACD is in a different situation, trading within the bearish zone with a bullish bias. The bullish bias comes from the fact that the MACD is rising after hitting the lowest point since March—but it can still move lower before recovering. BTCUSDT (D) MACD In March Bitcoin was bearish and crashing as the 2025 correction low happened on the 7th of April. So it is the first time the MACD moves below zero after the April recovery. See the MACD chart. First there is a drop and once a low is hit we get a small bounce, the bounce is followed by a new drop and then the indicator starts to rise. While the MACD bottomed in March, Bitcoin bottomed in April, this is the classic lag, a lagging indicator. The MACD can bottom anytime and as it hits bottom, we know what follows is a wave of growth even if it takes a while to show up on Bitcoin's price. Bearish Signals The double-top is a bearish signal but this one has been consumed with the recent down-move. Bitcoin can indeed move lower but this isn't a necessity, not a market compulsion. If Bitcoin continues lower, we know this is only short-term based on the other signals we are seeing. The RSI is still below 50 even if rising. The MACD is in the bearish zone even if it is starting to turn. We need strong signals and strong indicators to confirm a major advance. Conclusion Bitcoin is likely to continue growing short-term, mid-term and long-term. On the very short-term, say one to two weeks, anything is possible. On this very short time horizon Bitcoin can easily crash according to the chart. Most Likely Scenarios More sideways, more neutral, more bearish action followed by growth. Bitcoin is likely to continue in this kind of mixed period for sometime. If we consider the bigger picture, we are still locked within the $100,000 and $125,000 price range. For LONG or SHORT, wait for the trend. For spot accumulation, focus on the altcoins. For Bitcoin, the best is to wait. The time to buy was when prices were below $100,000 or $90,000. There are better choices right now. The next time to buy is when the signals become really strong, or when prices are trading at support. It all depends on your trading style, risk tolerance and your goals of course. Do not be distracted by market noise. When we focus on the short-term, we tend to miss the bigger picture. The truth is that the most money is made when the market is in a trend. Since we are in a bull market, we wait for support and go LONG. When the bull market is over, each time there is a bounce or a price advance it becomes an opportunity to go SHORT. We trade in the same direction of the market. Thanks a lot for your continued support. Namaste.
MasterAnanda
Perfect Solana · Keep Holding · Too Early To Give Up

Solana is in a perfect position. Notice the last four days that closed red. 29-Aug through 1-Sept. All these days of bearish action but no major drop. This is a marketwide bullish signal. Marketwide because Solana is one of the big projects. Solana is Crypto: What one does, the rest follows. If Solana is set to continue growing, as it is shown by its massive strength, then we know the other projects that move together will do the same thing. Some pairs can look weak and we don't know if they will continue to drop or instead reverse to start (resume) moving higher. Seeing SOLUSDT and the perfect rising triangle; how easy Solana continues to move higher even while Bitcoin was experiencing strong bearish action, reveals what is happening behind the scenes. Money is being shuffled around. Whales are loading up. The plan is being implemented and the resutls will be awesome. Do you see a bullish chart here? Does the drawings on the chart reveal the tendency and bias for this pair? Look, the market can move lower of course, but we have a rising channel. Any drop will be bought. Solana has much more to give. Too early to give up. Thank you for reading. Namaste.
MasterAnanda
XRP Full Green Candle · Great News · Reaction at Support
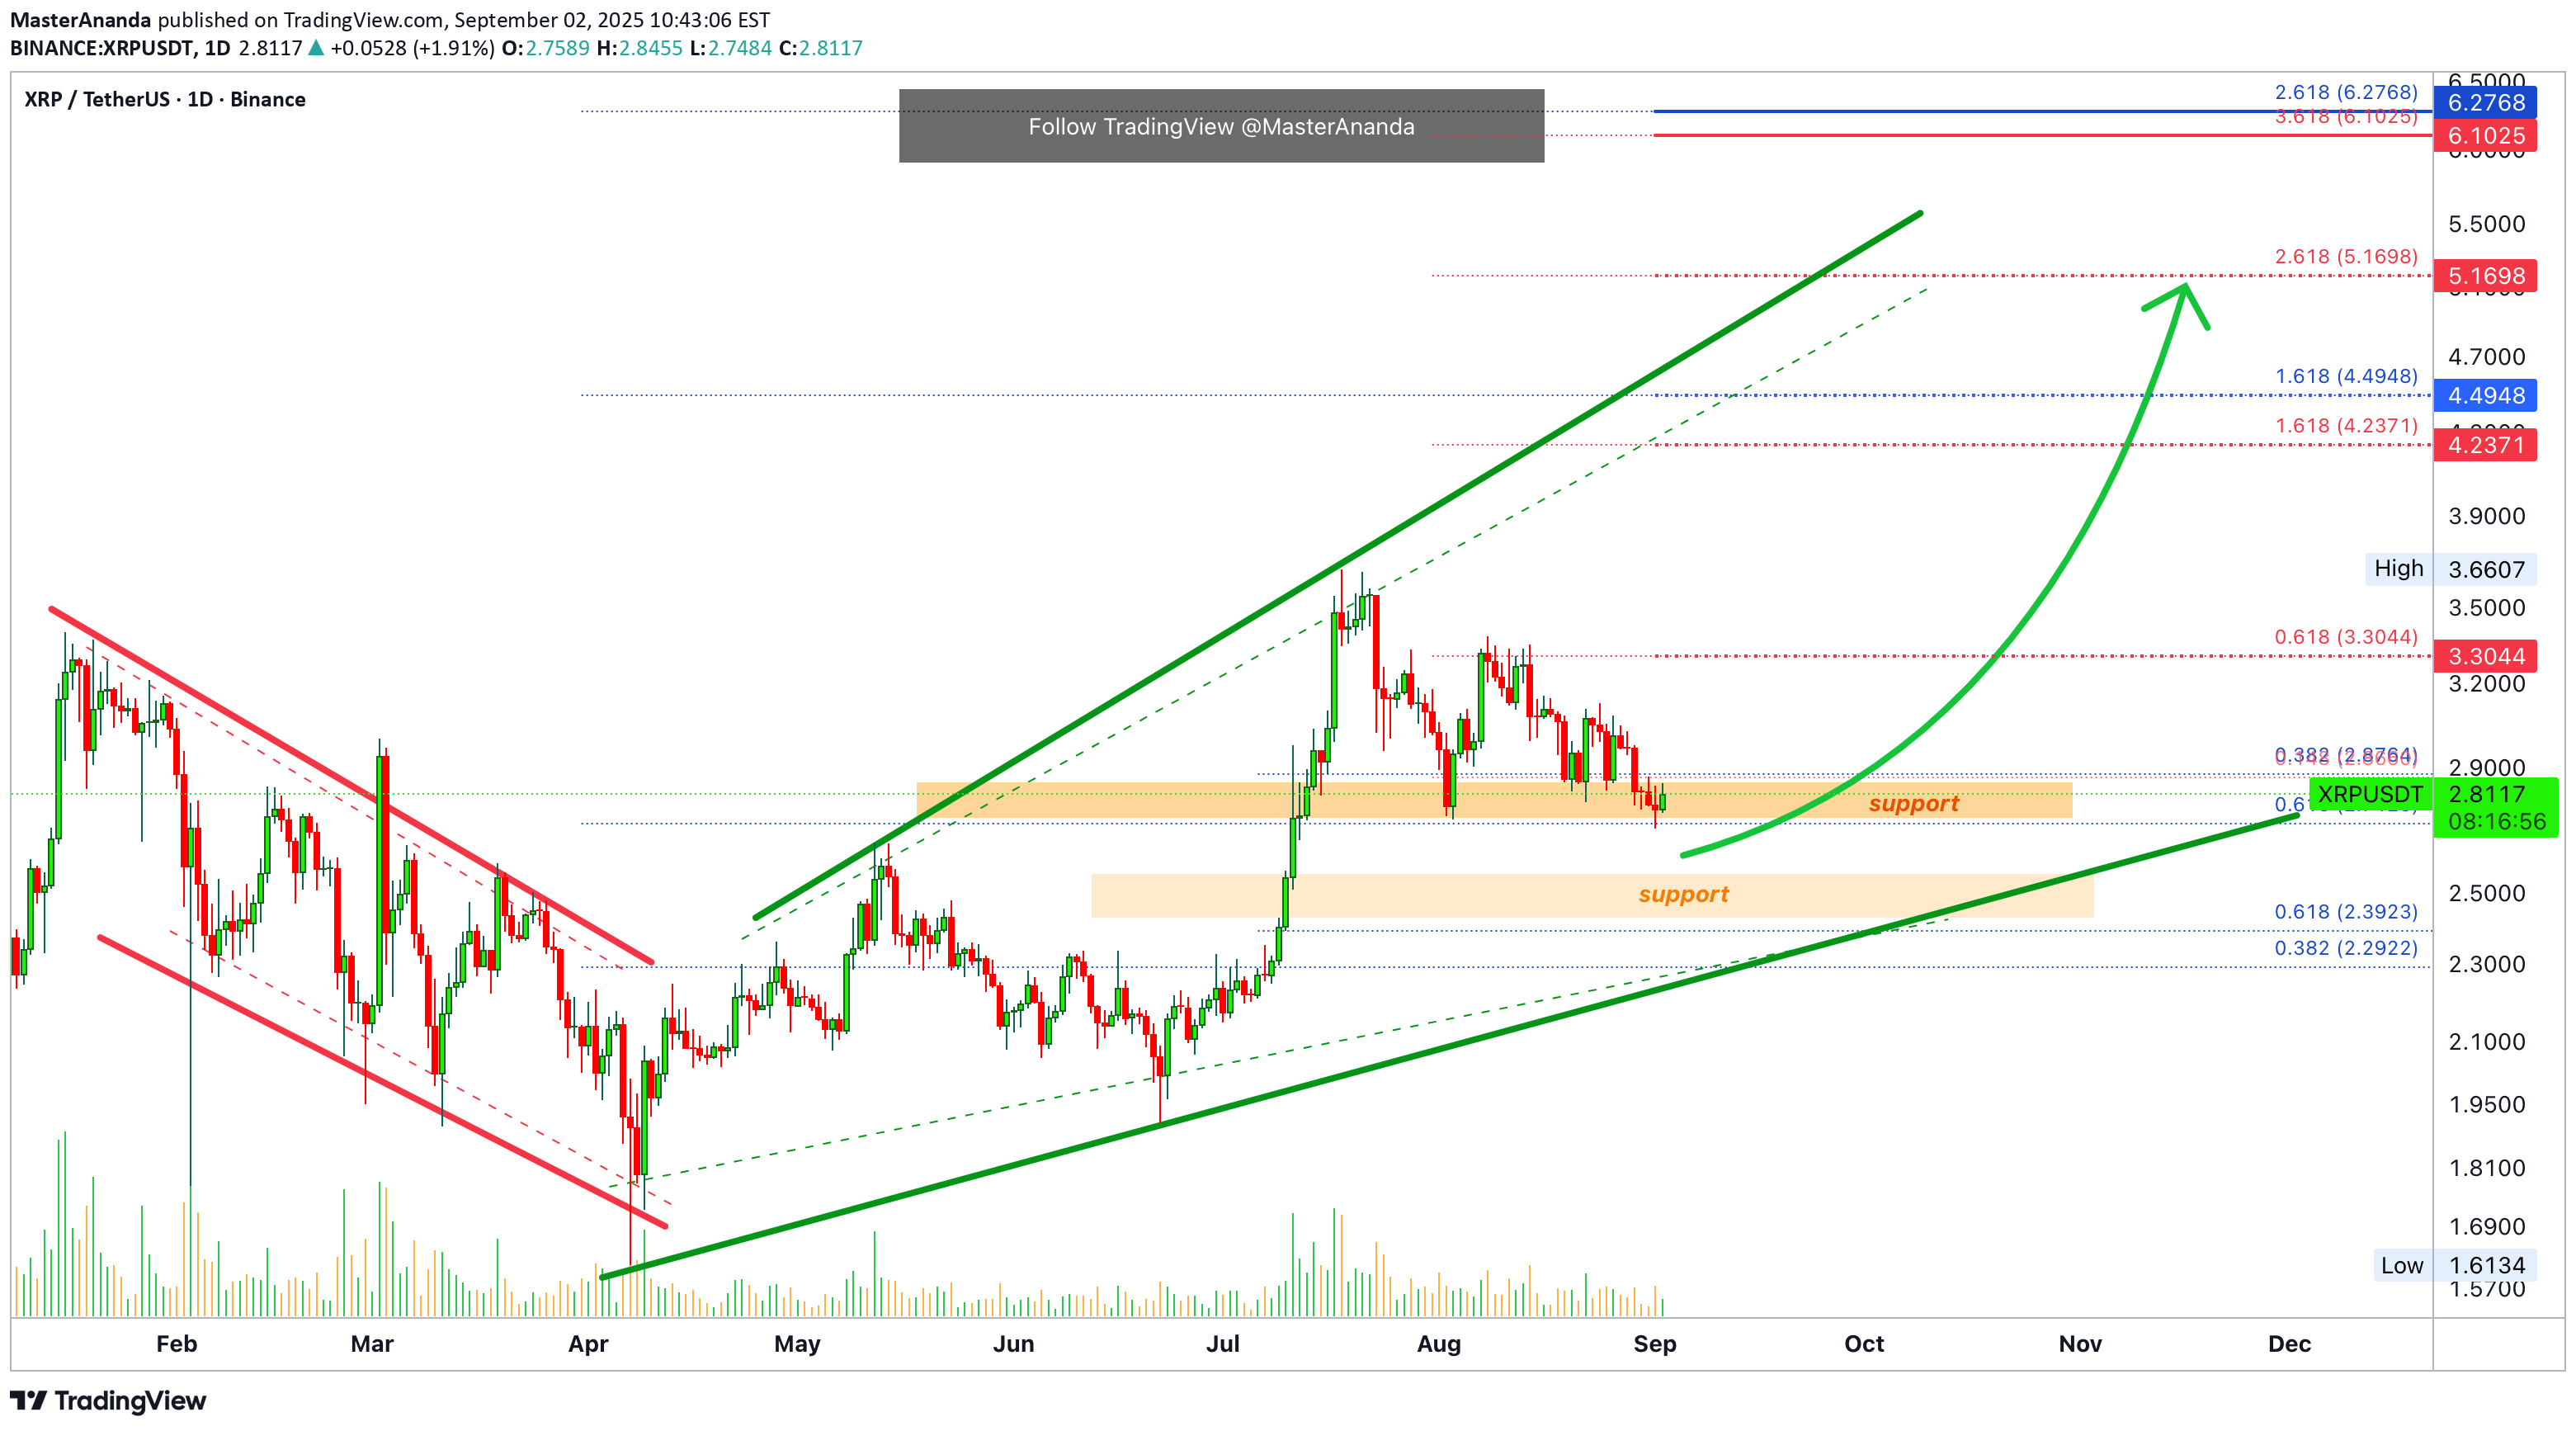
XRP is looking great right now. There is nothing better than a good reaction at support. Remember this support zone? The orange space on the chart. This support zone has been tested multiple times since 2-Aug., a month ago. 30 days holding and this time we have the first bullish candle—full green—around this level and this means that the bulls are finally showing their face. It is hard to believe that it has been already 45 days since the last high, but this is good because the retrace is running its course and as soon as it ends we get the next bullish wave. More good news. The next major advance will be nothing like before. The last one lasted less than a month, the next one can go for 2-3 months or more. So at least twice the length of the previous one. There is still plenty of room available for growth. Targets These are the numbers based on the short-term. For the numbers we were using previously, more accurate, please find a previous publication. You can do so by going to MasterAnanda and typing XRPUSDT on the search filter. Go a bit lower and you will see hundreds of charts with long-term targets and all-time high projections. Thanks a lot for your continued support. Namaste.
MasterAnanda
Dusk Network Primed 4 730% Potential Profits · Easy Target 259%
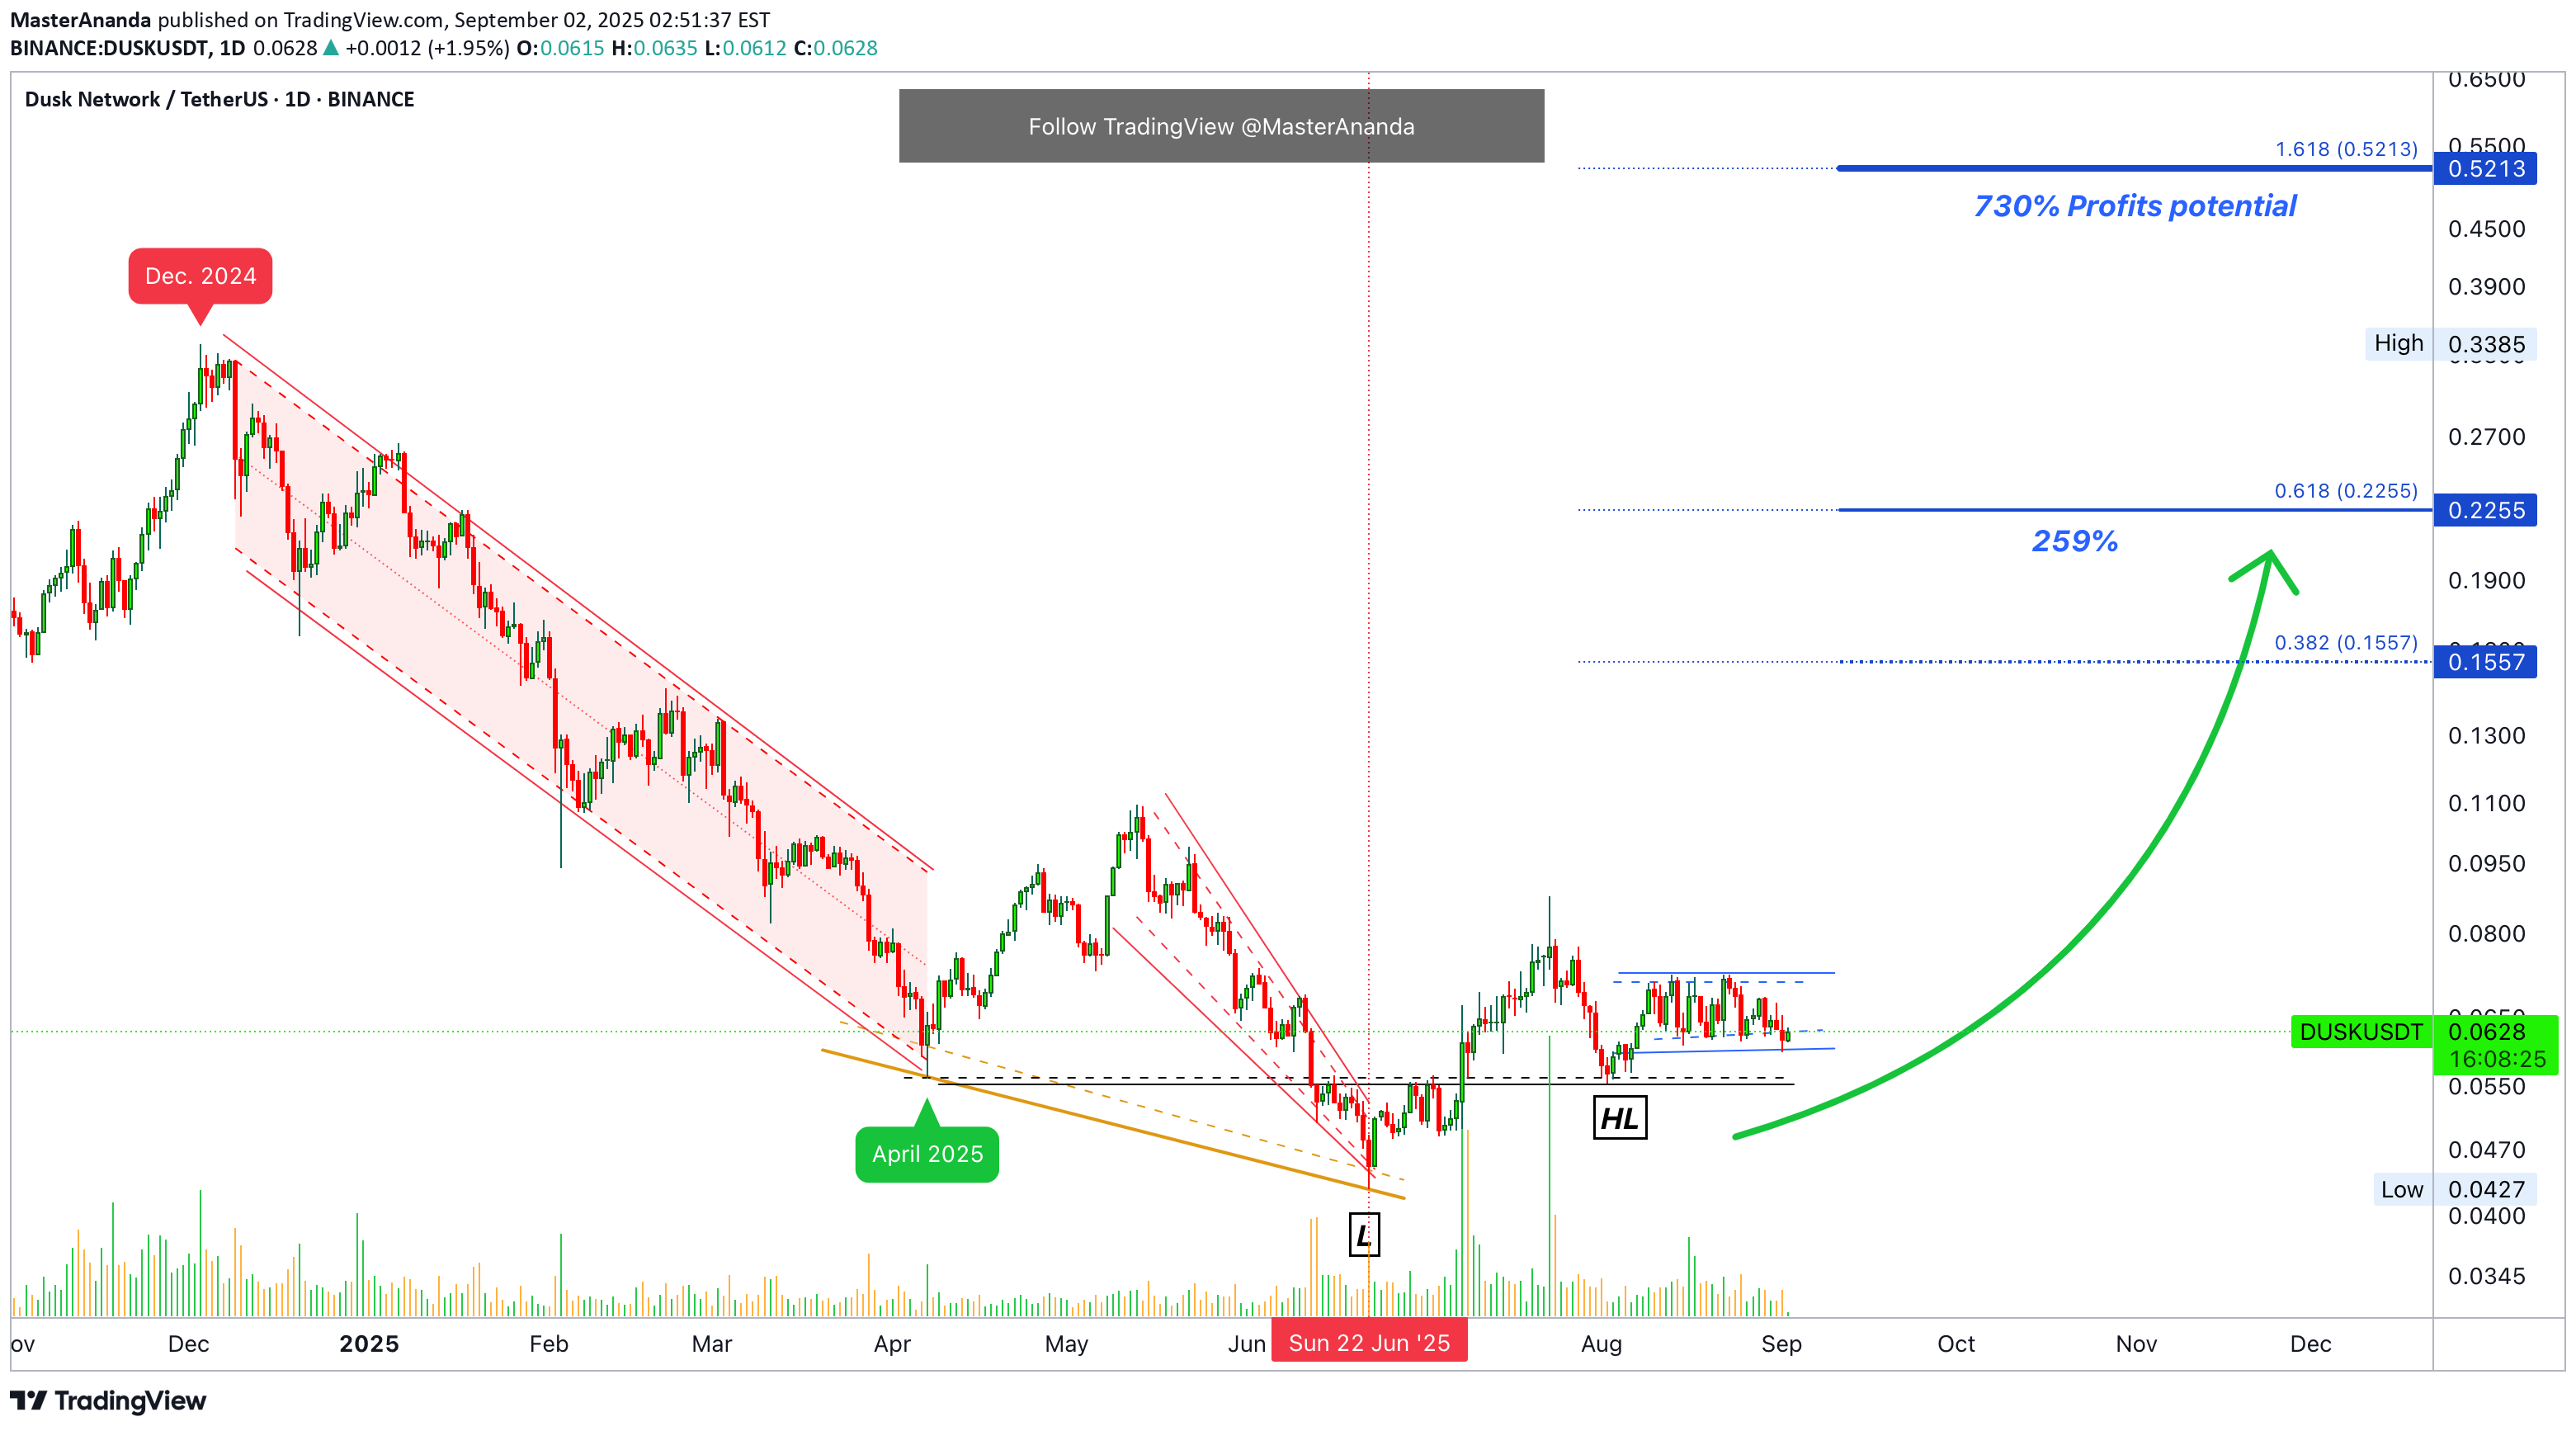
DUSK has been sideways after the HL. An entire month of consolidation. It has been 72 days since the market bottom (22-June). Recovery followed by sideways; Sideways will be followed by a strong bullish wave. DUSK is preparing for a major rise with a mid-term target of 730% potential profits. The pair is so strong right now—strong as in huge potential for growth—that the easy target goes beyond 200% to reach 259%. The price tag for this one is 0.2255, hold strong. Whatever you are thinking of doing with this pair, make sure to practice patience, it always pays. This is a classic and long-term project from the small cap. camp. It has been around very long. With a proven track-record, withstood the test of time, the 2025 bull market will make sure to reward those who took the jump. It is not easy to buy when there is uncertainty, doubt and fear in the air. It is not easy to buy at bottom prices; but this is the best action you can take. The best action if what you want is huge profits and strong success. We are ready for the altcoins market bullish wave. We already waited long enough. Thank you Crypto, but we are ready for some fun. We become bored when we don't earn. We want to be entertained... So give us the profits. Namaste.
MasterAnanda
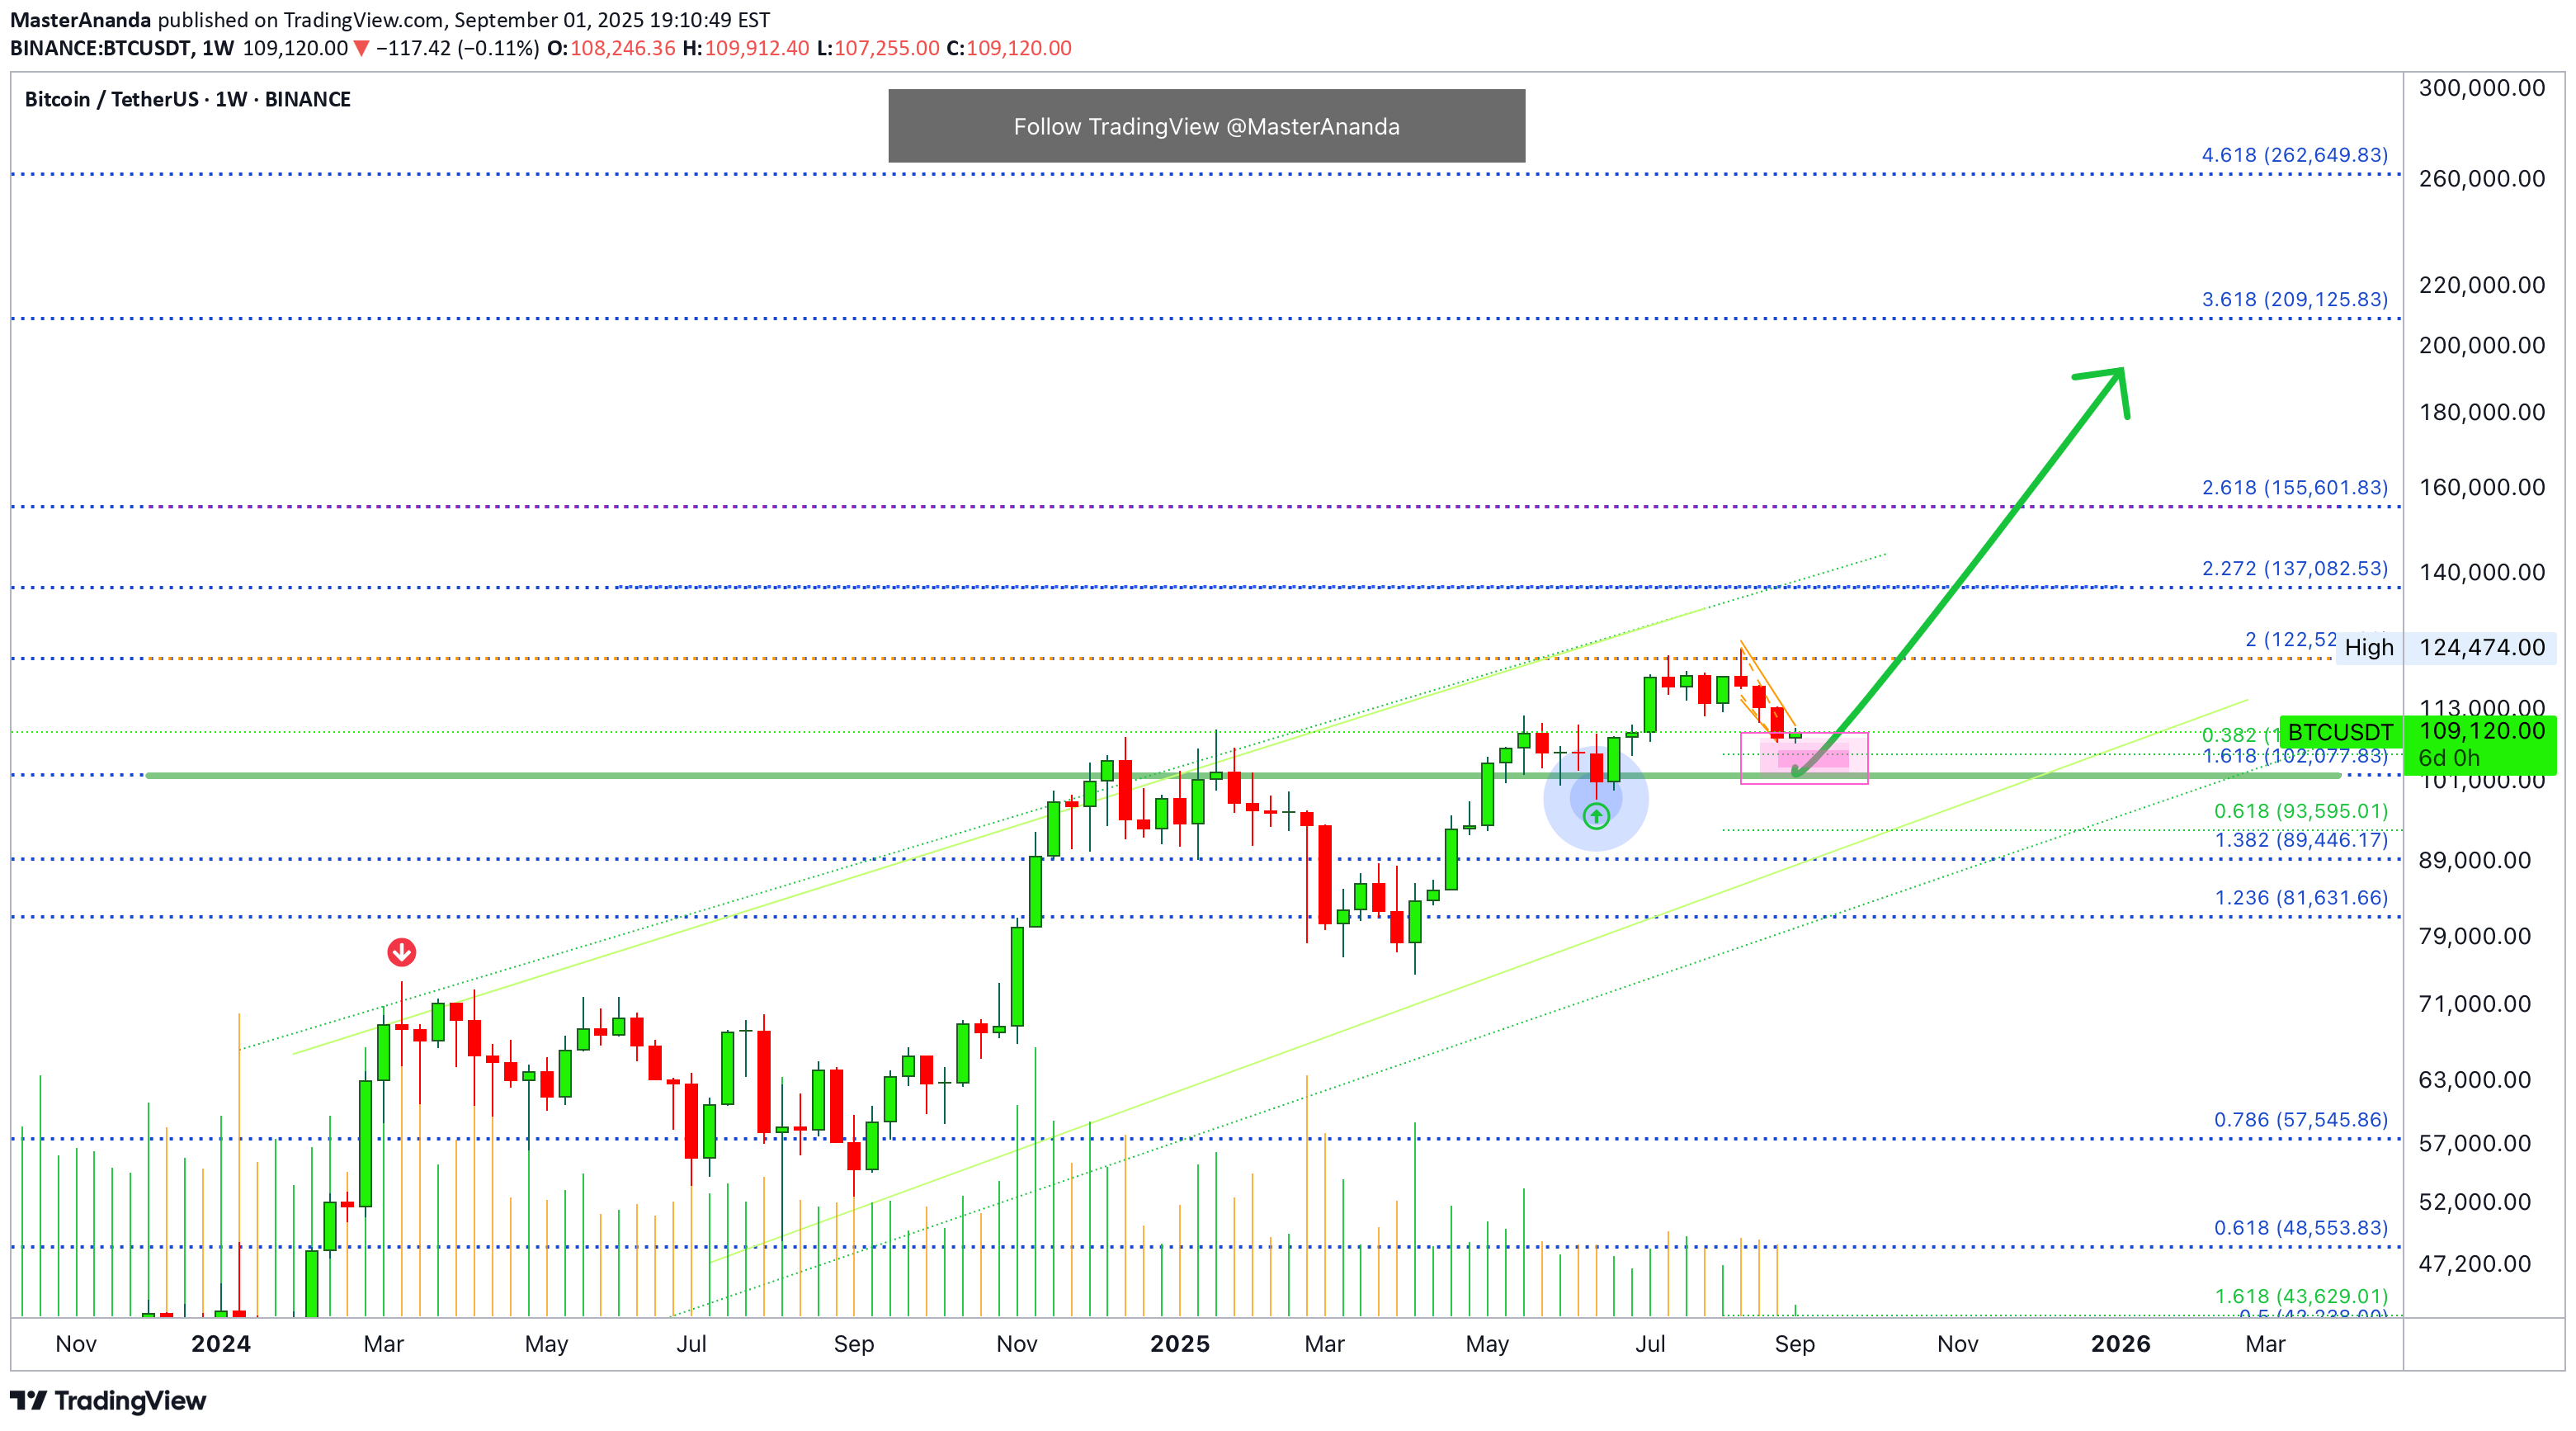
Bitcoin Above $110,000, Major Bullish Development · Bulls Wins
Bitcoin is now trading back above $110,000, one of the most important levels in this cycle and also on the short-term. I don't think you are surprised to see this as we've been LONG but still, this is a major development. Support is found based on a long-term moving average with perfect precision. Bitcoin closed below 110 only four days. Four days below this level and is now recovering. EMA144 has a reading of $107,000. BTCUSDT bottomed today at $107,000. On a previous drop June 2022, Bitcoin found support at EMA89. This time this level broke and the action is happening below, just barely. This is another classic. The action moves below previous support just to recover after a few days. This is a strong bullish signal, it shows that the last drop was a bear trap but confirmation only comes when the day ends. Bitcoin will continue to grow, the chart is saying so. I think it will take months to reach a new major high and this cycles top and final all-time high. It will take time but it will be all worth it. We are changing the world. Crypto will continue to evolve; Our capital will continue to mature and grow. Everything looks great and we expect period of sustained growth. Don't be distracted by market noise. Focus on the long-term and hold. There is no way to beat the exchanges, the whales and the bots, they have all of your info and you have none of theirs. The way to beat all these entities is to buy holding long-term. Since there is a no way to remove a strong hand, you will be able to reap the reward. See how Ether trades at a new all-time high only four months after hitting a multiple years long bottom; the rest of the market will do the same. First the biggest projects, then the medium sized ones and finally, the rest of the market. It never fails; it always works... » Bitcoin's next target is $137,000 followed by $155,000. » Ethereum is moving to $6,000 - $8,000. » XRP will continue to hit new all-time highs. » Cardano will hit several new milestones and Solana will do the same. The market is set to continue with its 2025 bull market. We are missing the bull run phase. Thank you for reading. Namaste.
MasterAnanda
Litecoin · Support Confirmed —Buy & Hold!
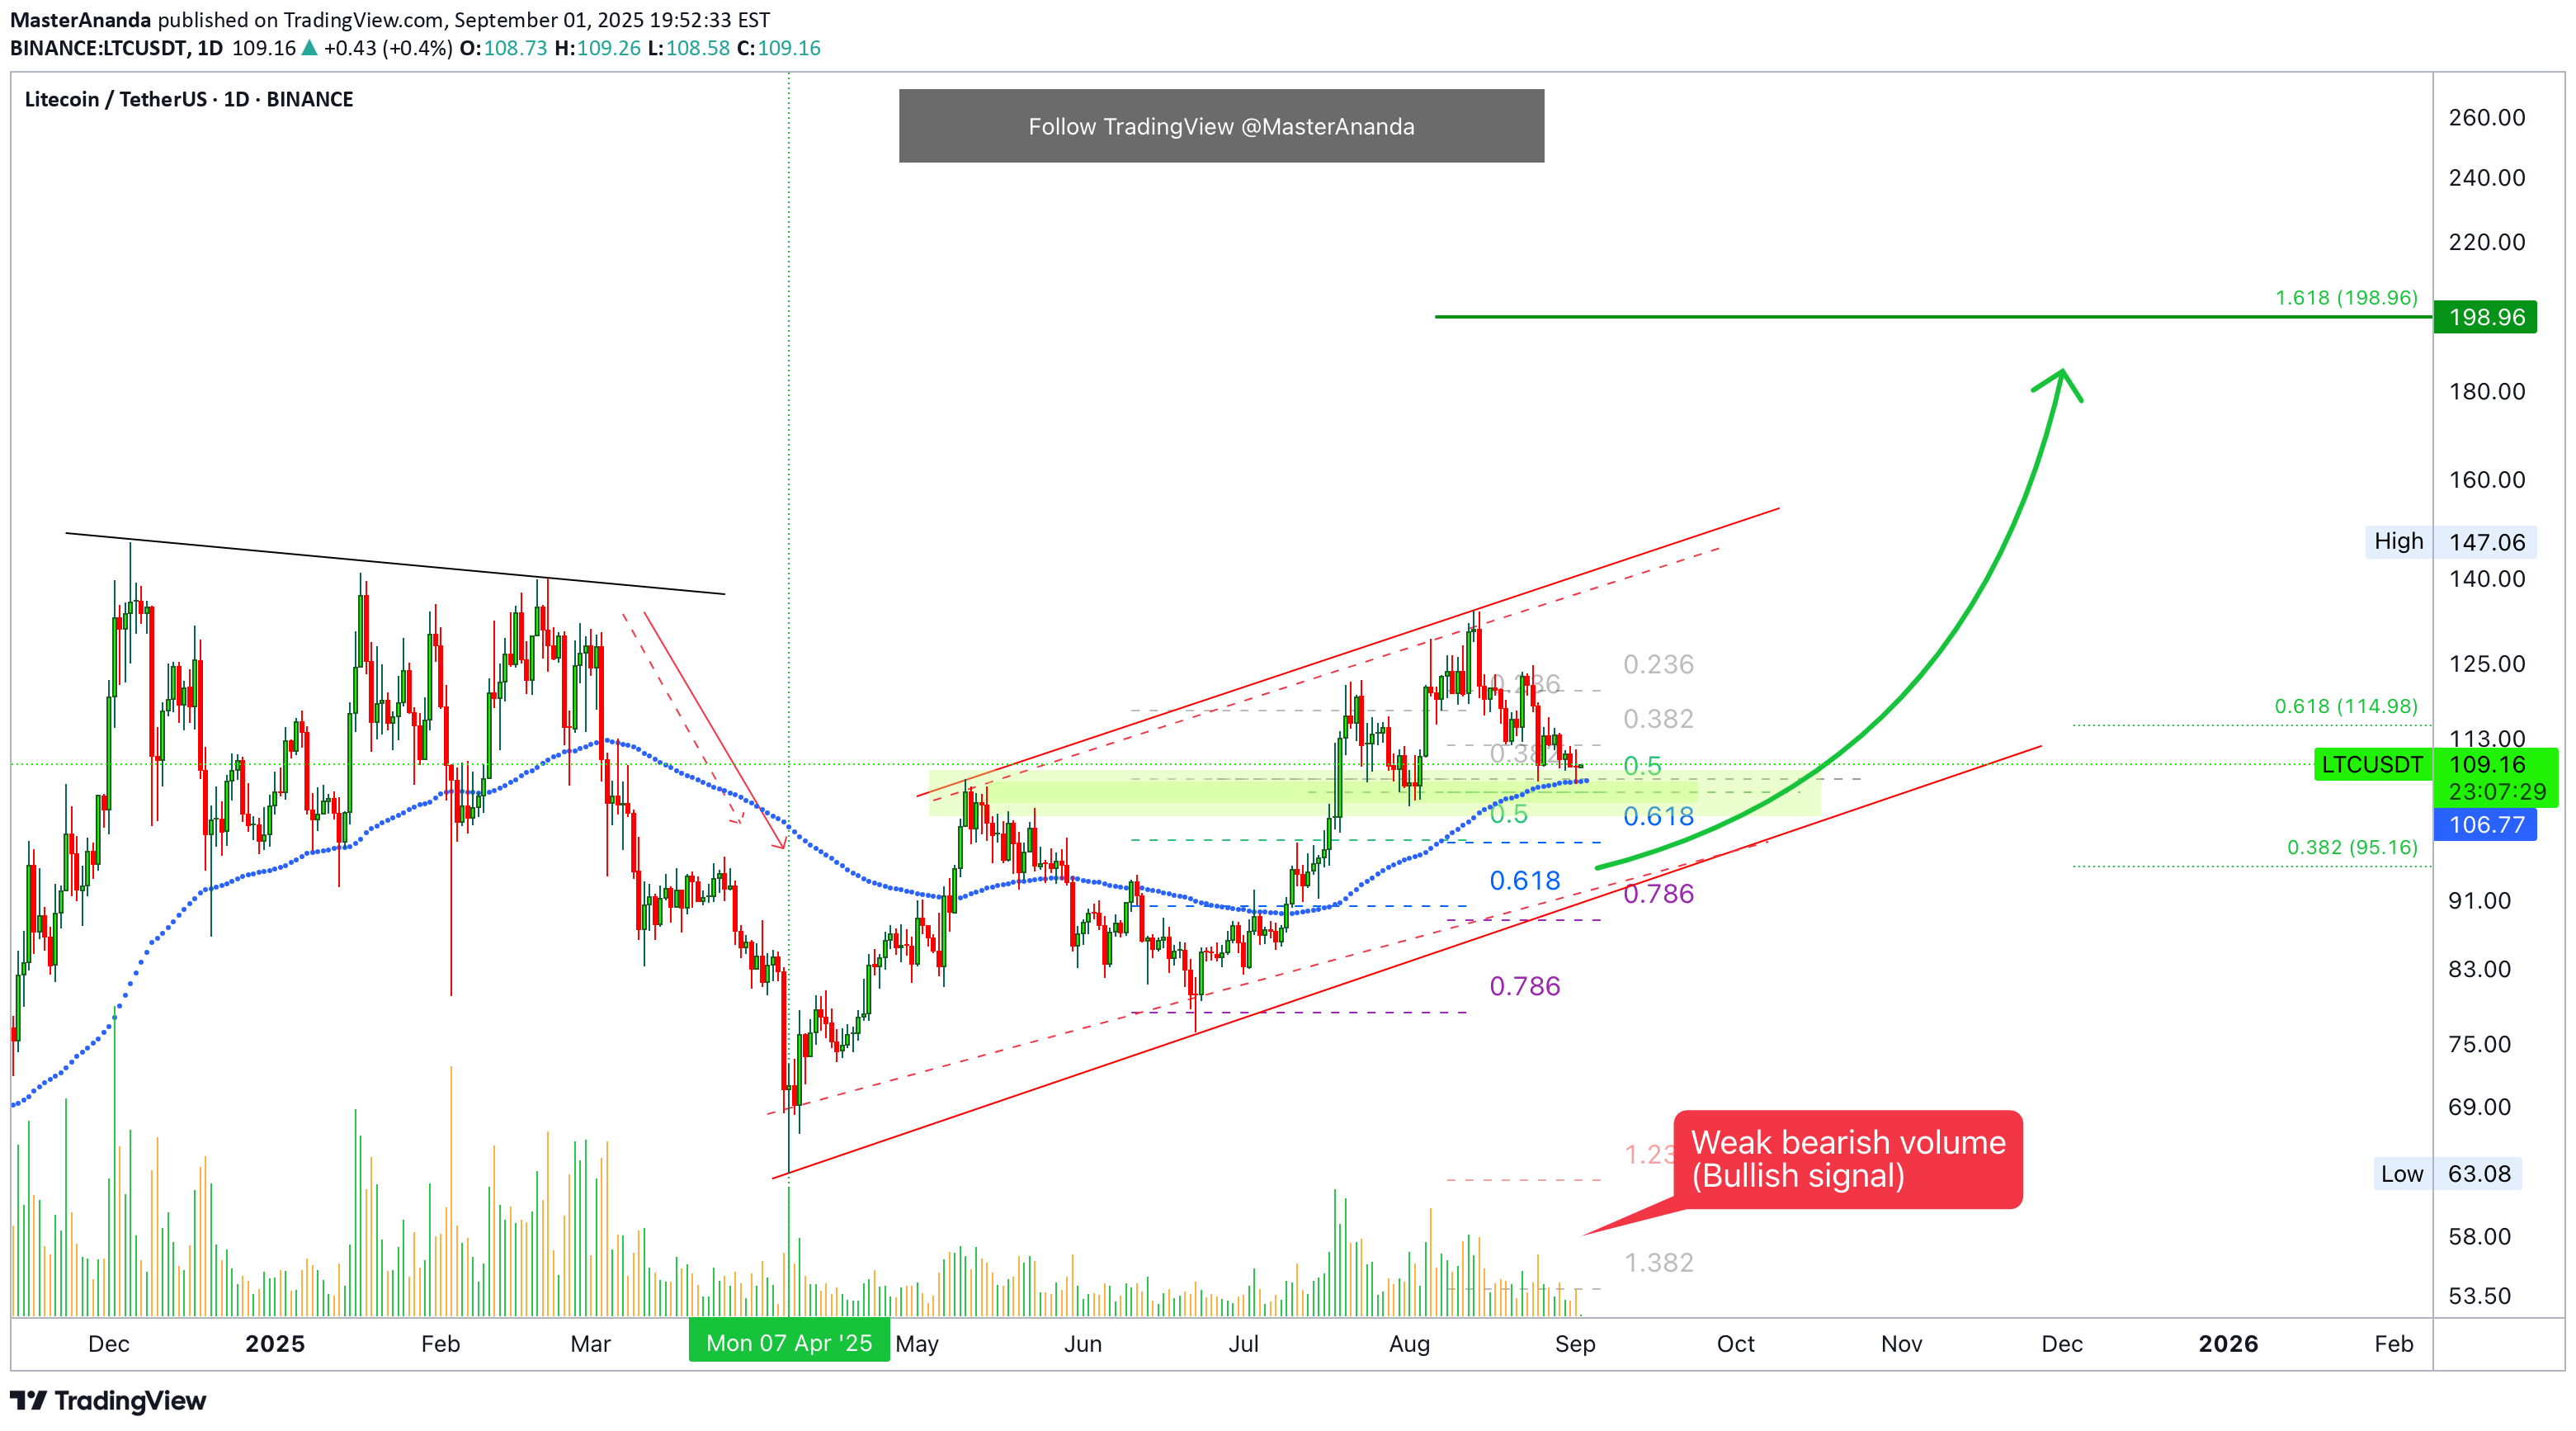
I am focusing on the daily and the current retrace; you already know the bigger picture—Litecoin is going up. Short-term though, we are looking at a potential confirmation of support. We have a very good situation here, a simple and classic rising channel. Support is being tested at exactly EMA89 which matches the 0.382 Fib. retracement level in relation to the move from April through August. When the market is bullish, as it is now, a reversal can easily happen at this level. This same support zone is also a previous resistance, the 10-May high. Resistance flipped support. This gives further strength to EMA89 and Fib. retracement, it makes the signal that much stronger when there is a combination of events all pointing in the same direction. See the ultra-low volume in the most recent trading days, it continues to drop and drop as the bears have their turn. Weak bearish action; no sellers pressure. This is my interpretation of the current chart. Since I am always saying "buy at resistance, sell at support," Litecoin is in a great position right now to buy and hold. Namaste.
MasterAnanda
Cardano Above Support, Safe · Bullish Action Will Continue
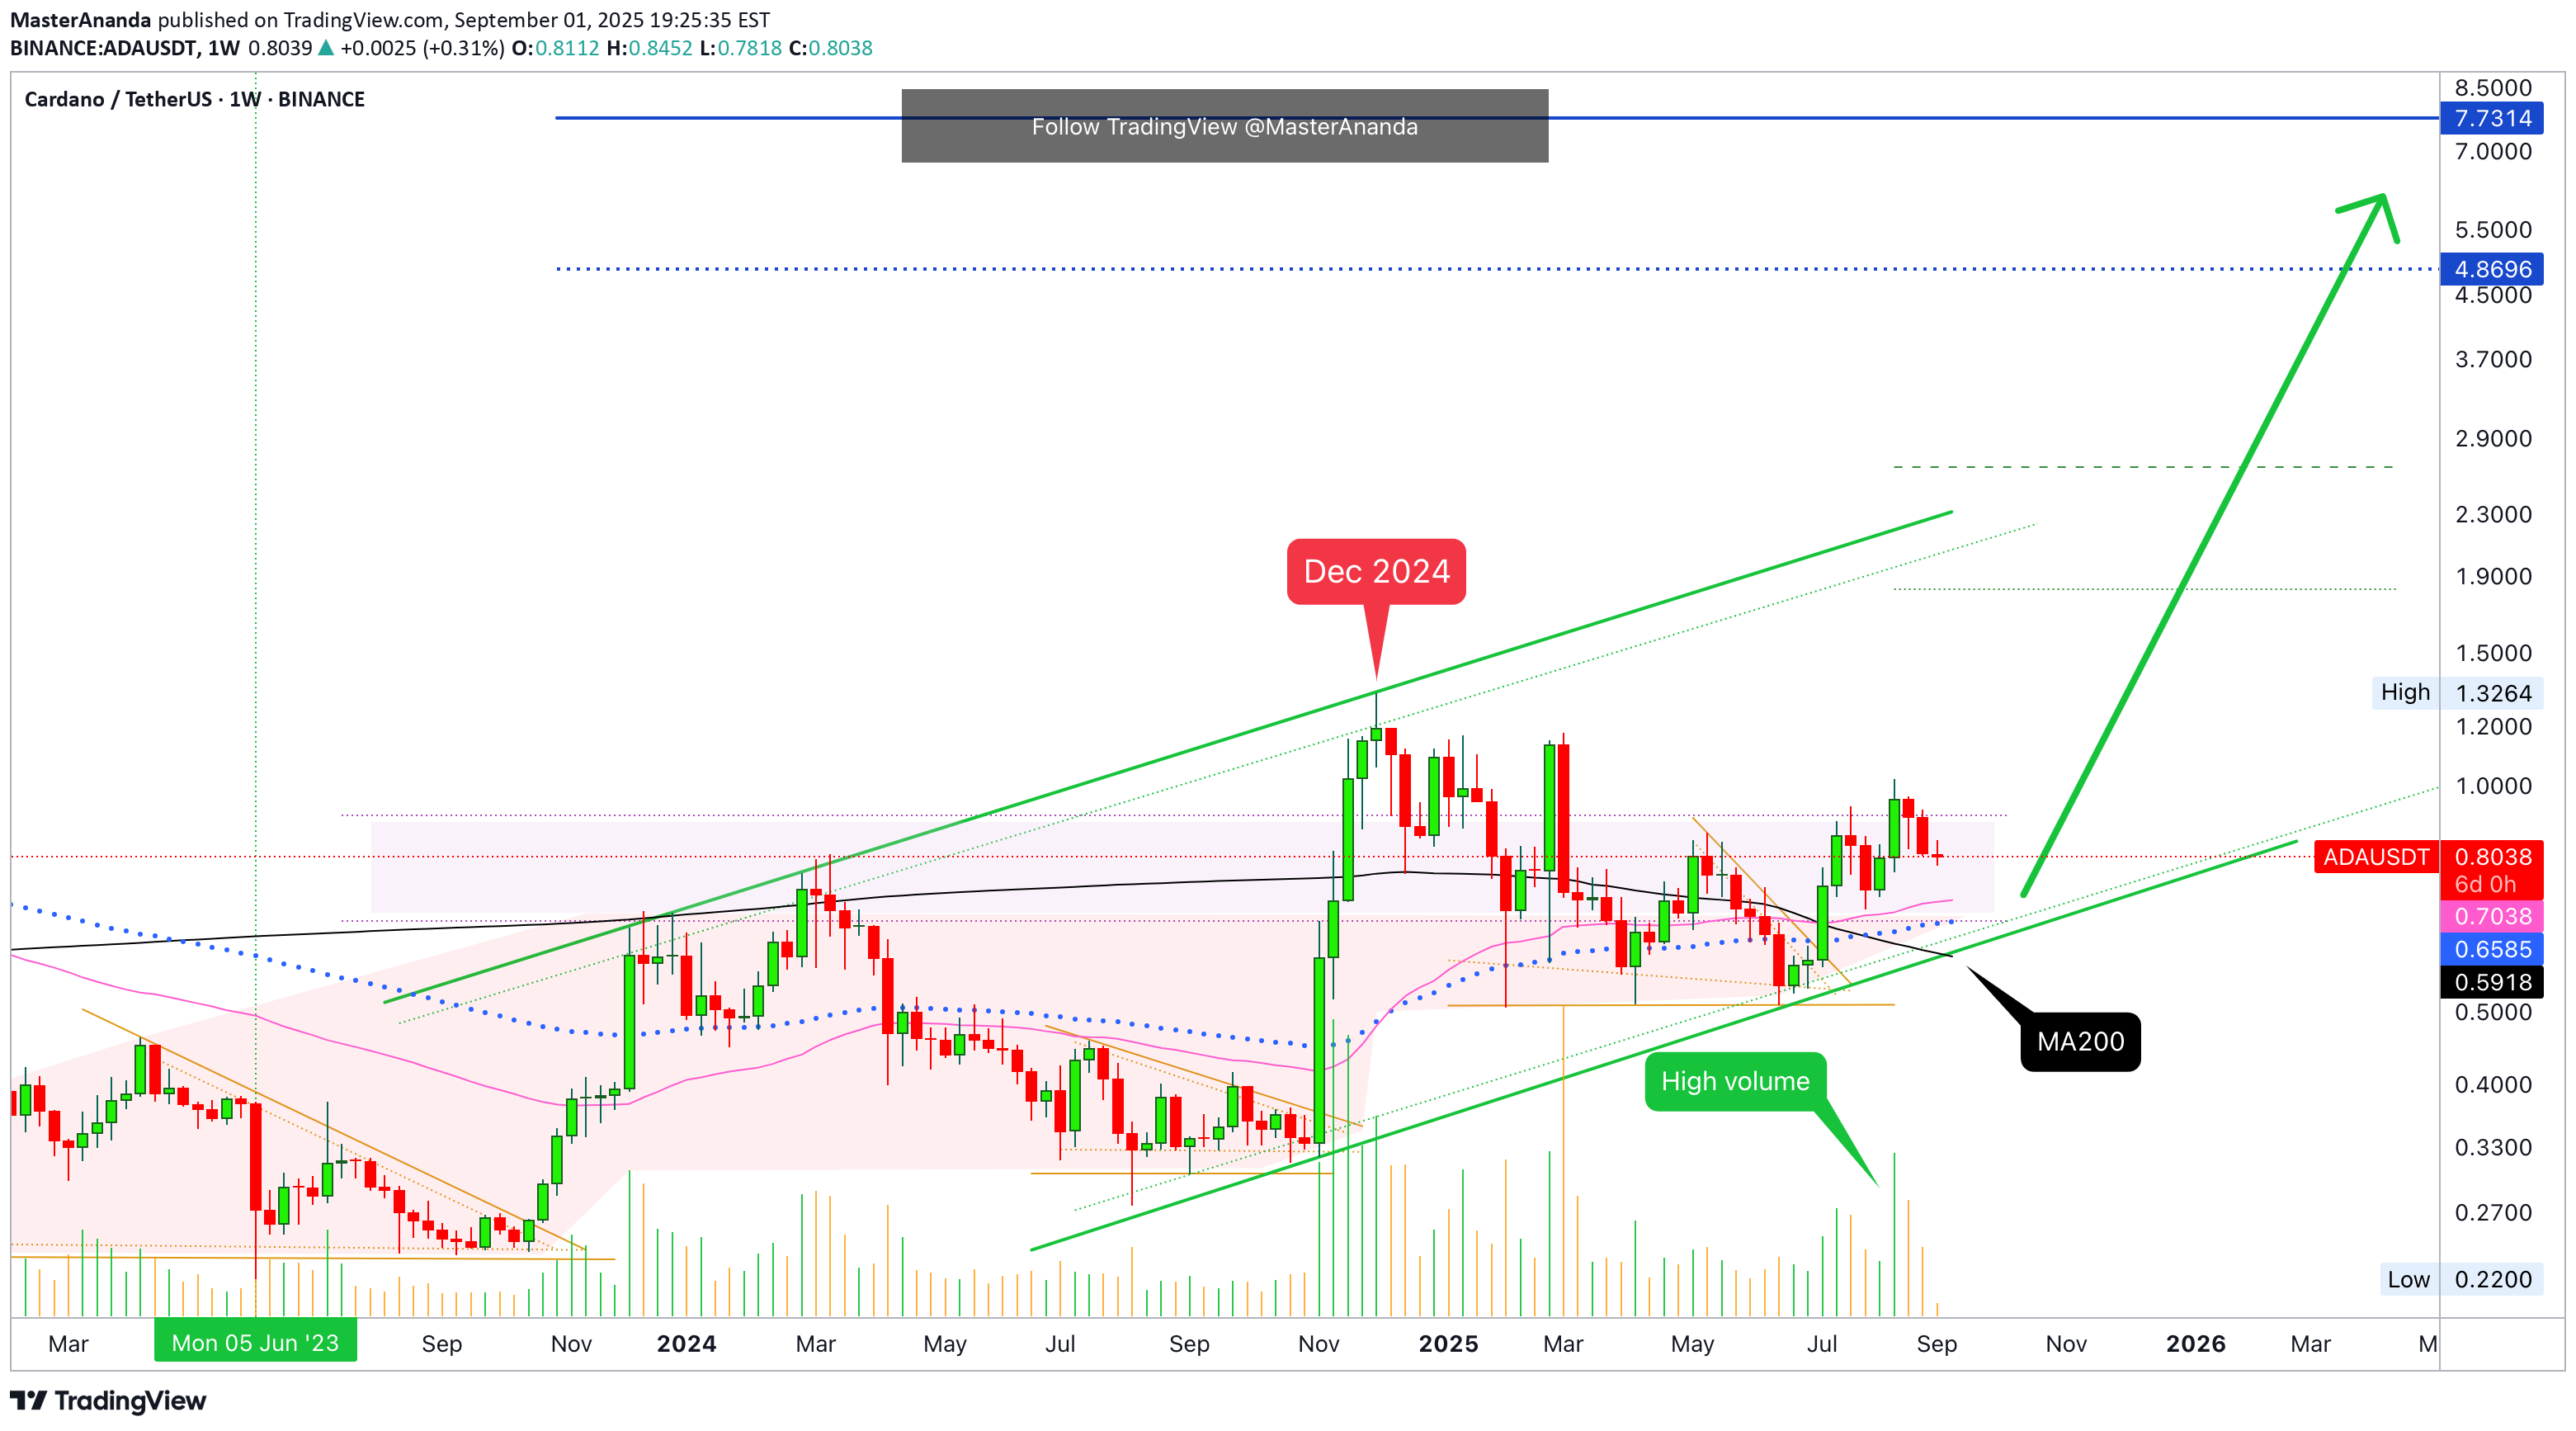
Here we have Cardano with a bullish chart and market conditions. ADAUSDT weekly has been trading above EMA55, EMA89 and MA200 for weeks. Seven weeks to be exact. As the action happens above these levels, bearish momentum and sellers pressure has been very weak. Naturally, weak bearish action favors the bulls. The highest volume bar since the strong March drop and rejection happened in August and it was bullish. Two weeks closed red recently and yet again there is low bear volume. EMA55/89 and MA200 long-term are just too strong support. These are not being tested by the way. Three weeks red and yet ADAUSDT continues with local higher lows and ready to grow. These weeks are just a small pause, which is great. When the market is growing long-term as ADA is doing, there is never any hurry, the market grows but fluctuates with prices rising and dropping with the classic upward bent. Remember, Cardano has been growing since June 2023, it is a rising trend. The last major move and high was an advance that ended in December 2024. It's been nine months. This is all the consolidation we need for a new and strong advance. An advance tend to happen every 6-10 months. 10 months being the maximum and Cardano is now at 9. You know what this means? We are getting very close. 2025 produced a triple-bottom pattern. This is a very strong bullish signal. The 16-June 2025 week (22-June) marks the final low and the break above MA200 7-July marks the start of the 2025 bull market bullish wave. Cardano is already, right now, on a path to hit a new all-time high. This will be happening within a few months at max—or less. Thank you for reading. Namaste.
MasterAnanda
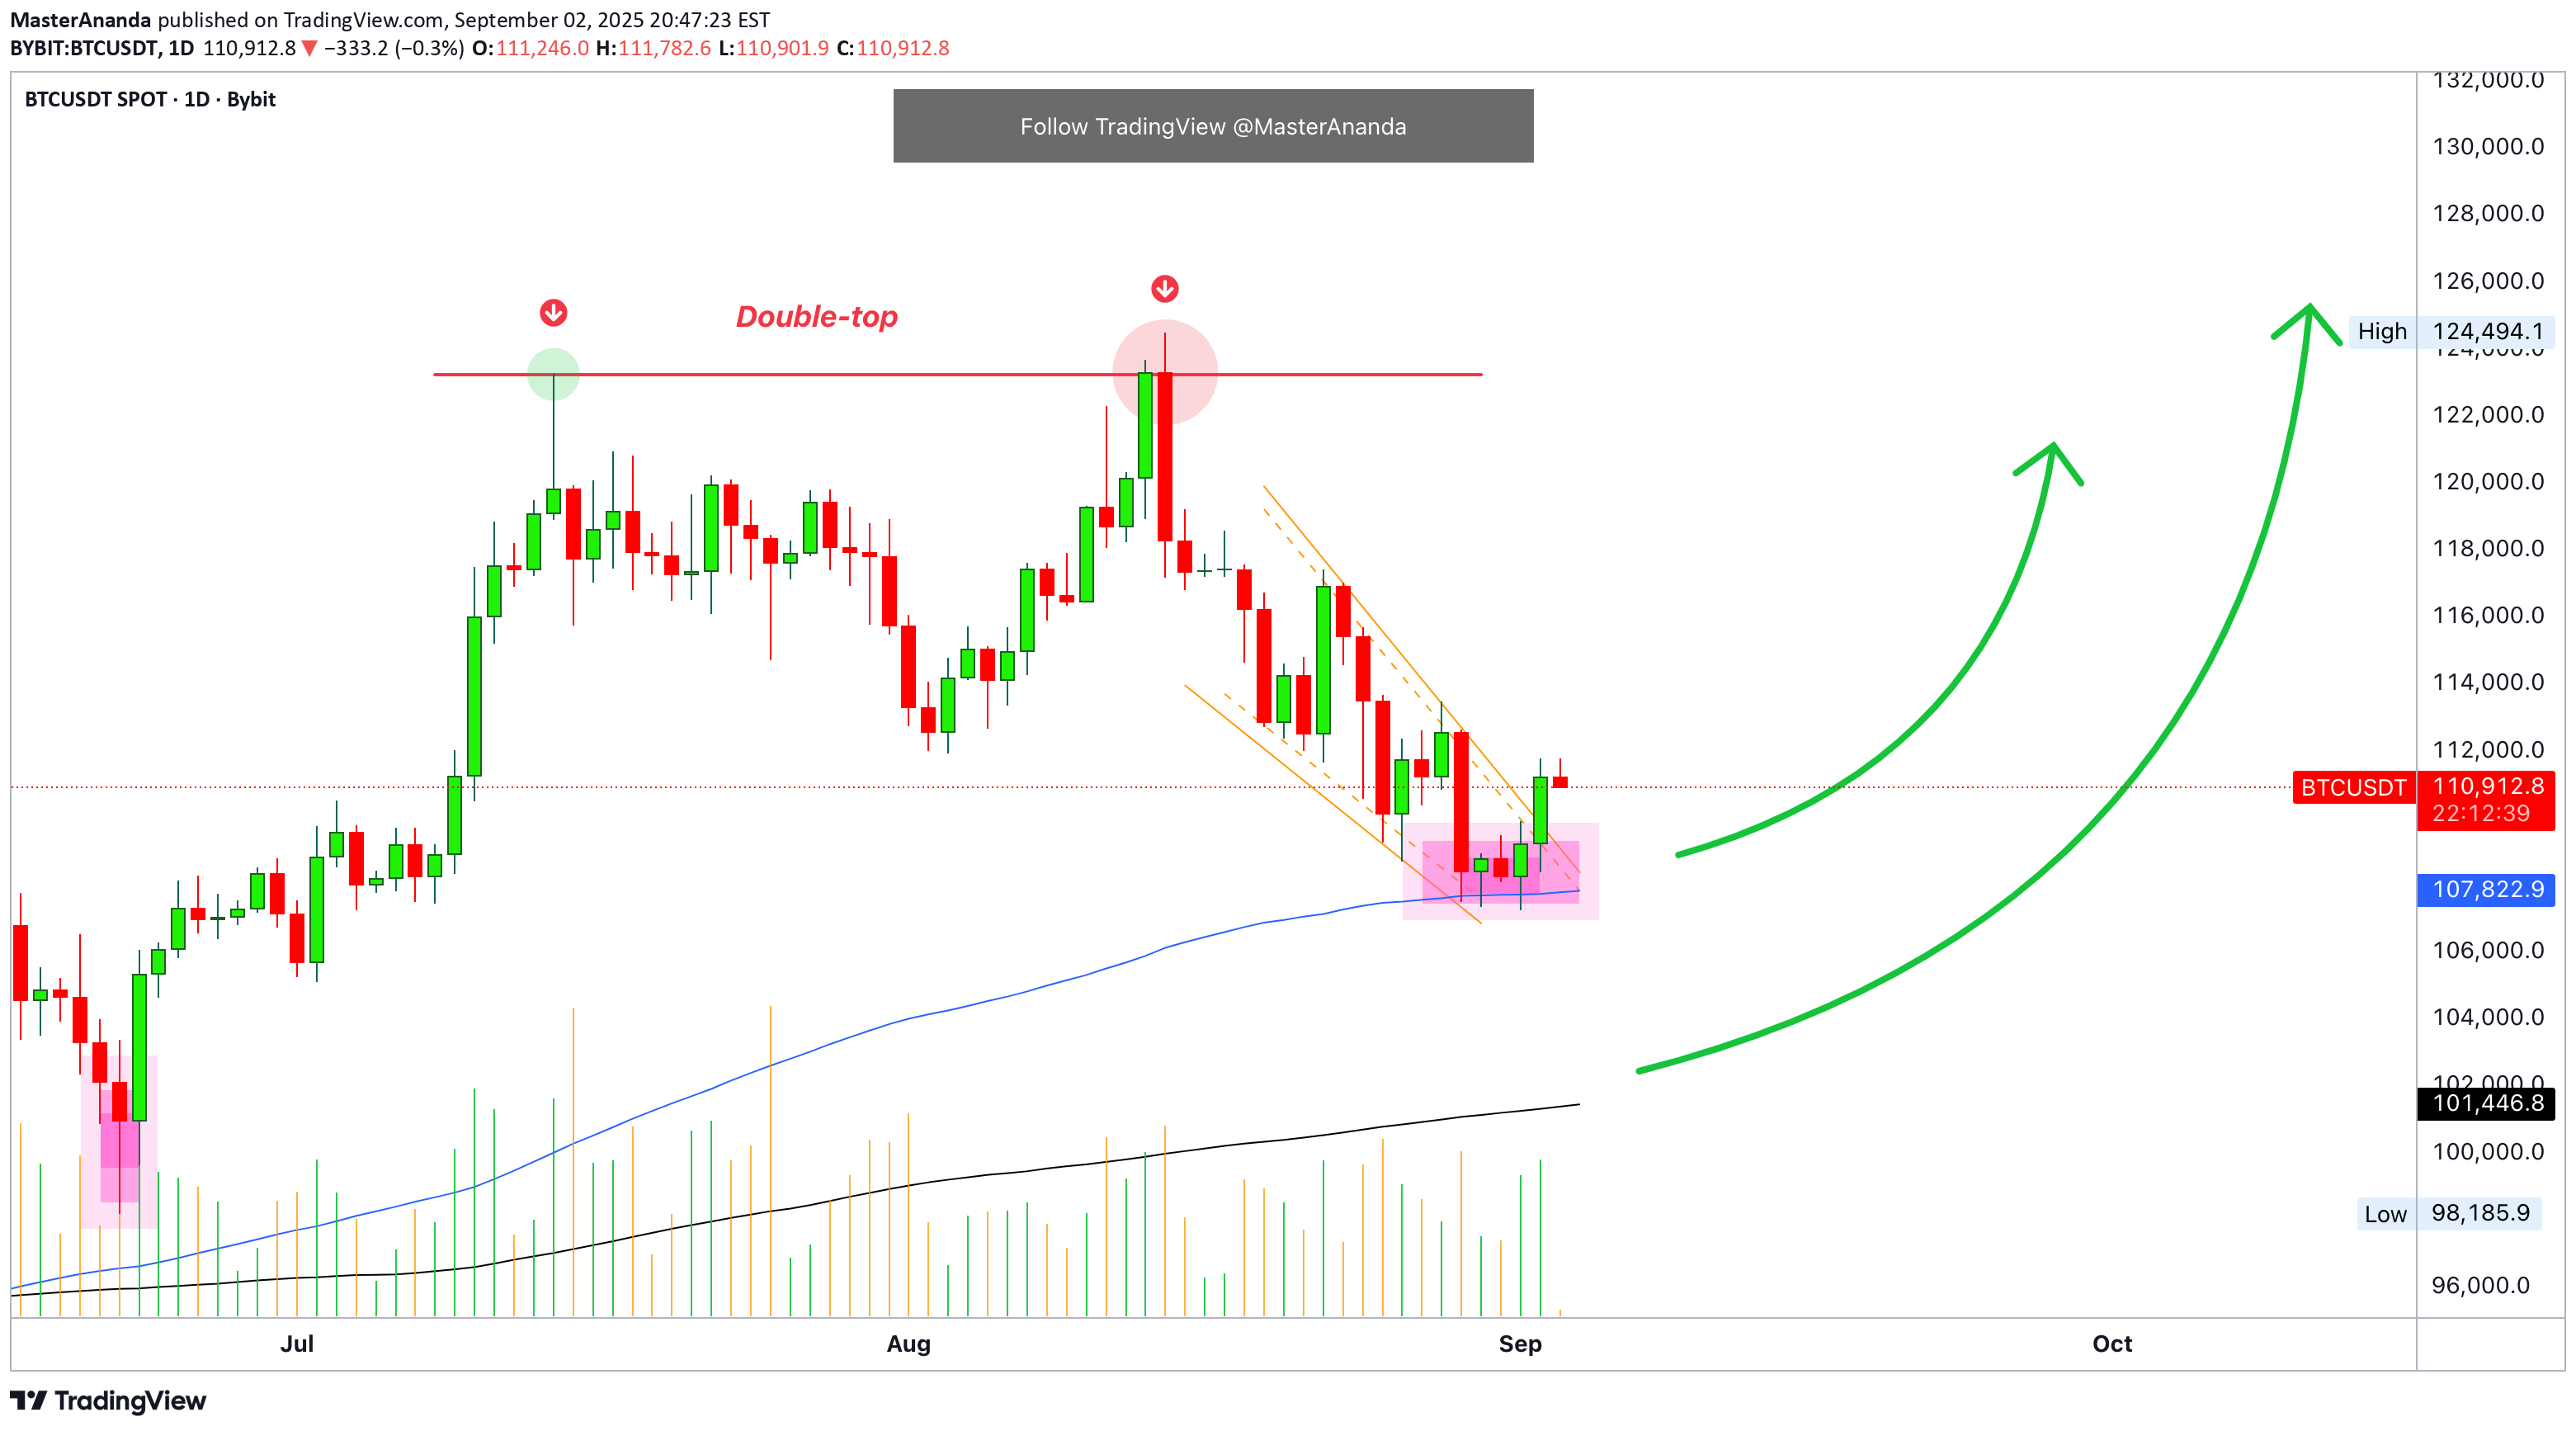
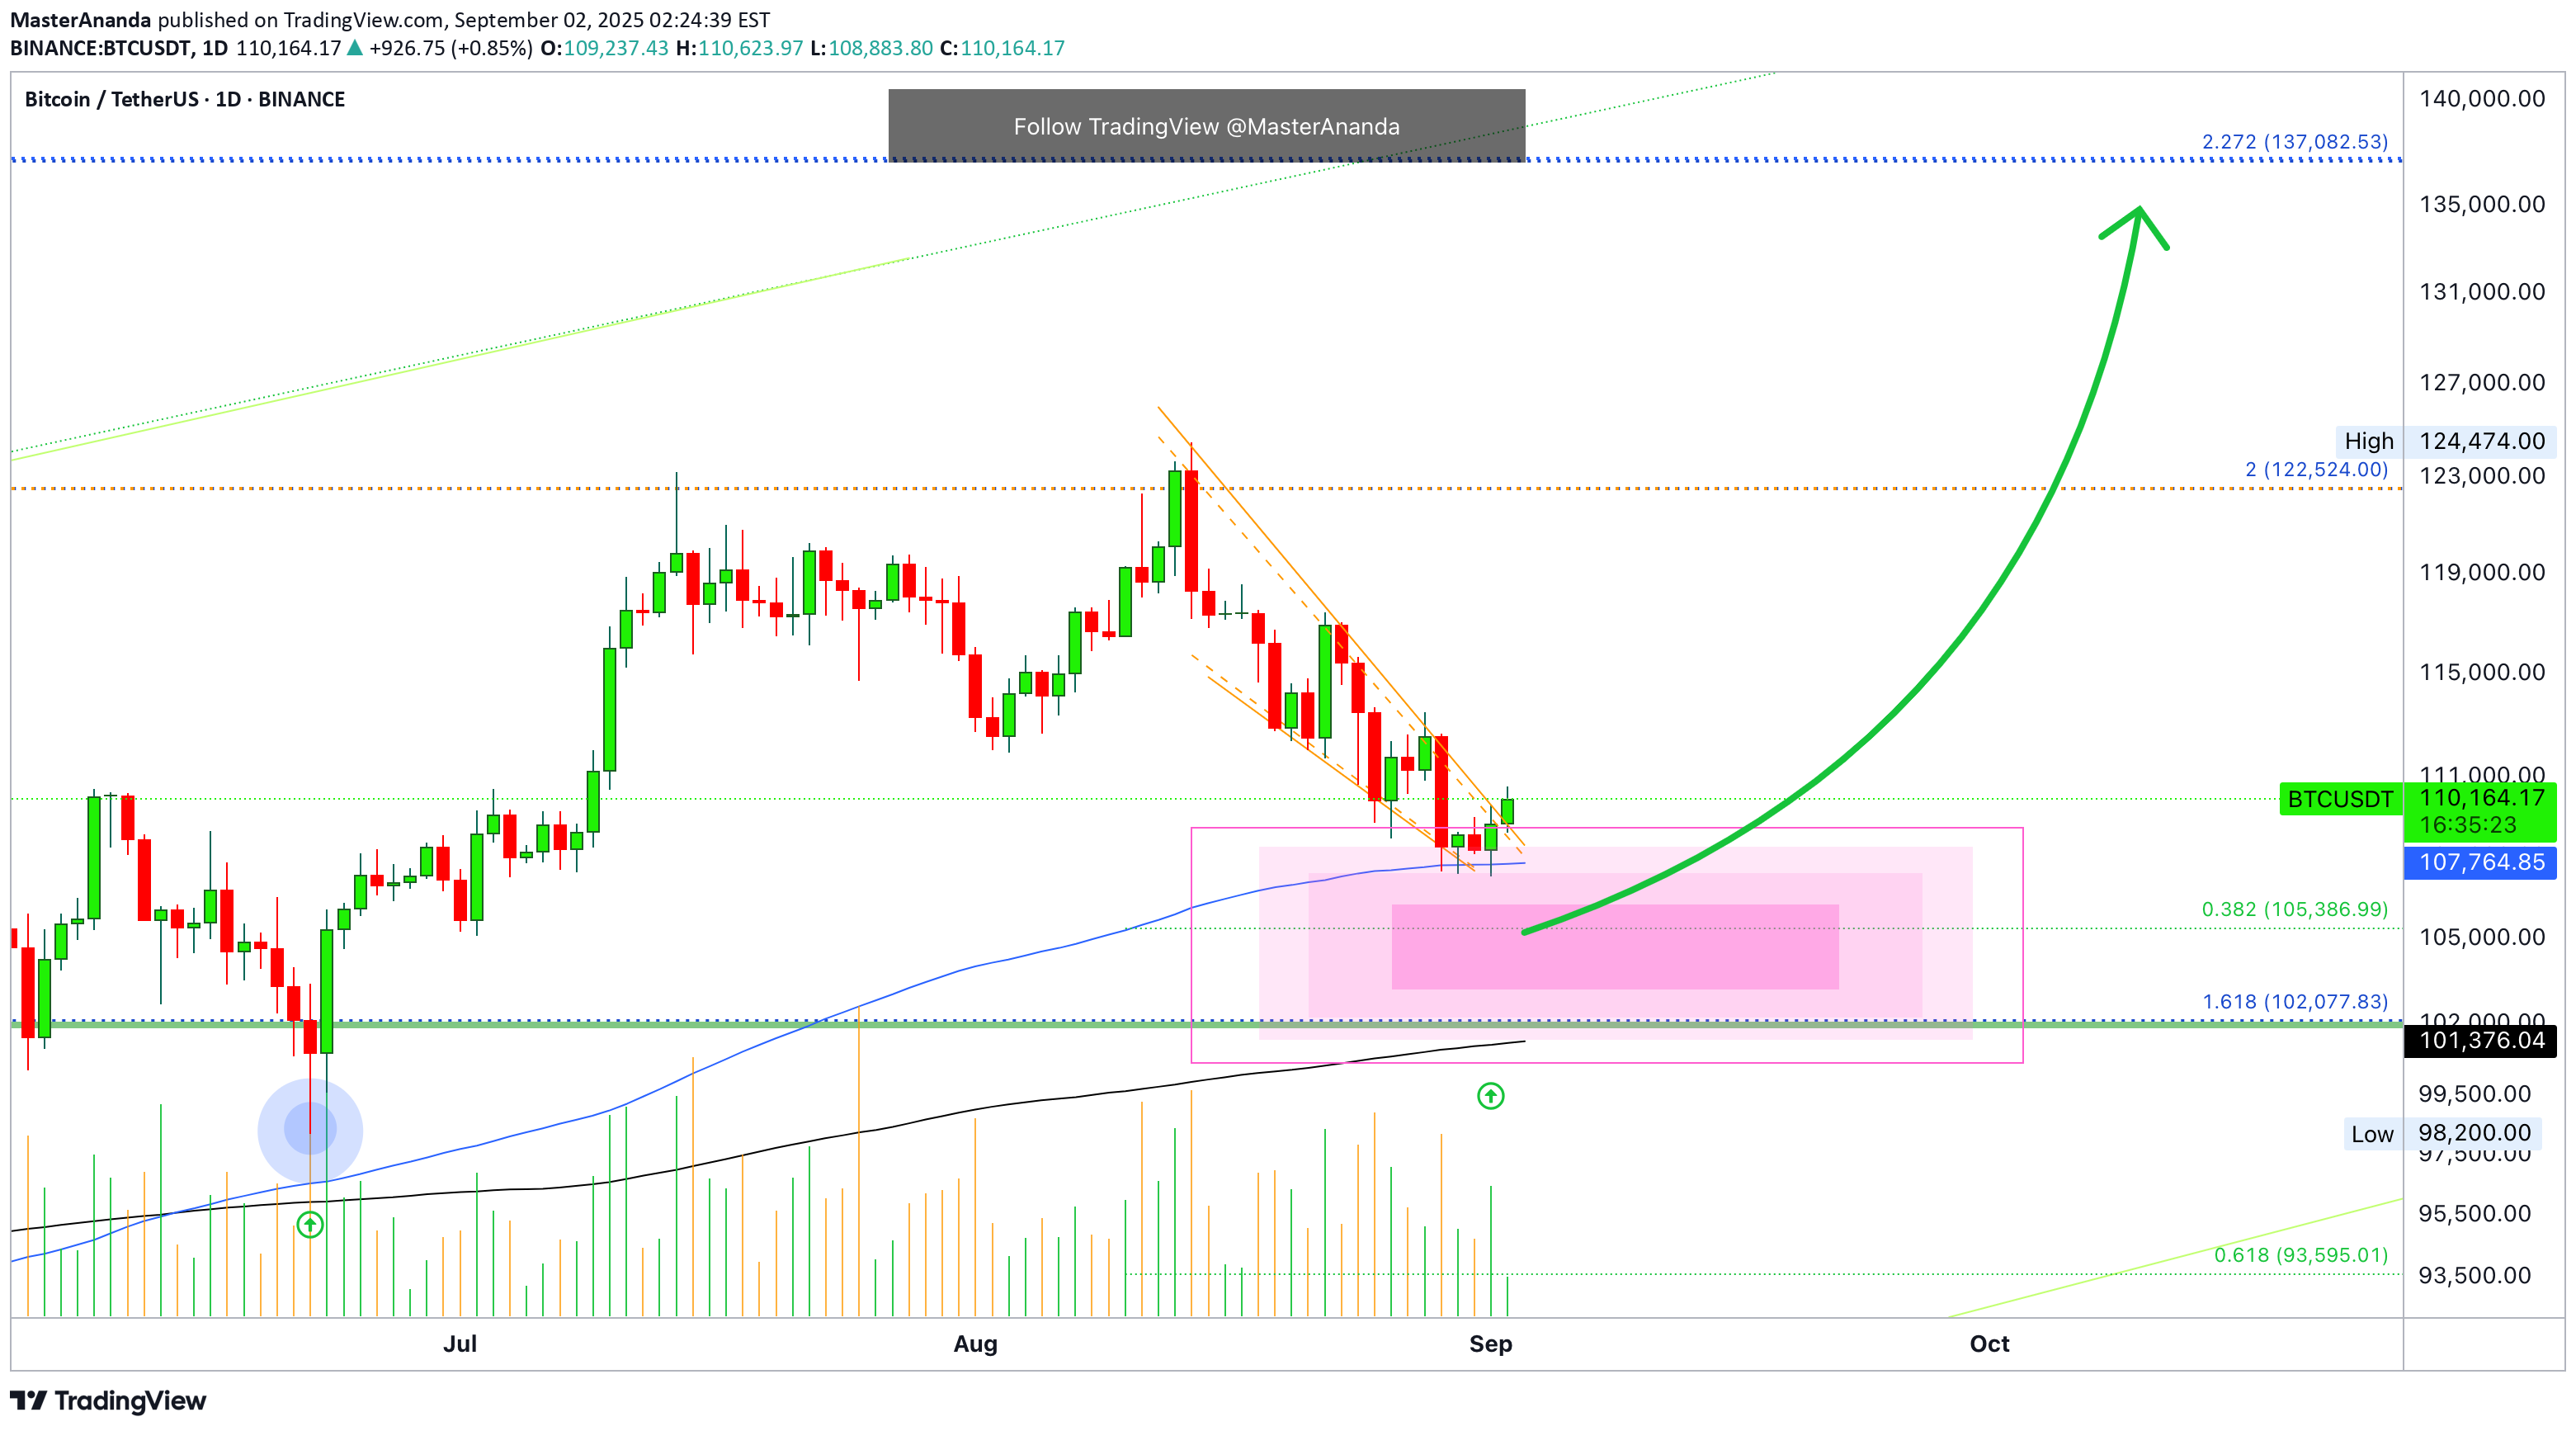
Bitcoin · The Correction Is Over
I will show you only two signals supporting the end of the current retrace/correction, it was a long one when you consider that the market is bullish. I think you will agree with me but we will only know in the comments section. Join me. Sit back, relax and enjoy the show. Good evening my fellow Cryptocurrency trader, I hope you are having a wonderful day. The last retrace between May and June lasted a total of six candles; counting the peak high candle as part of the retrace. The current retrace has eight candles so far; 33% more than the previous retrace. Consider a strong correction by looking at January 2025, it goes for months and three red sessions would produce a very strong price decline. Consider also March 2024. A strong correction lasted five months. Now, compare these two to the ones I just mentioned above. Here the difference between a correction and a retrace is very strong. The second telling signal is the fact that Bitcoin continues trading above $100,000. We have 1.5 months of bearish action and yet no major support zone has been broken when we consider the long-term. The next major support is found at $102,000. This level has not even been tested and likely won't be tested if Bitcoin continues with the same type of action we are seeing today. Trading volume is very low. Before a major drop, somewhere at some point a strong selling volume bar shows up. This isn't present on this chart. The biggest volume bar after the previous correction's low was a bullish day. This reveals the fact that the bulls have the upper hand. Now, don't get me started on the altcoins... The best is yet to come. Namaste.Remember this falling wedge pattern? Here we have long lower wicks with rising volume. Just the break and close above $110,000 confirms the bulls are back in the game but there is more. There are multiple 4H candles that wicked lower but ended up closing green. We also have a high volume session where all selling was consumed. Strong selling pressure all gone. The current candle is also pretty good. The falling wedge pattern broke bullish and this opens up a test of resistance next. The next resistance of course is the previous high around $122-$124,000. Higher is possible after this resistance breaks. Namaste.
Disclaimer
Any content and materials included in Sahmeto's website and official communication channels are a compilation of personal opinions and analyses and are not binding. They do not constitute any recommendation for buying, selling, entering or exiting the stock market and cryptocurrency market. Also, all news and analyses included in the website and channels are merely republished information from official and unofficial domestic and foreign sources, and it is obvious that users of the said content are responsible for following up and ensuring the authenticity and accuracy of the materials. Therefore, while disclaiming responsibility, it is declared that the responsibility for any decision-making, action, and potential profit and loss in the capital market and cryptocurrency market lies with the trader.