Technical analysis by MasterAnanda about Symbol BTC: Buy recommendation (9/2/2025)

MasterAnanda
Bitcoin · The Correction Is Over
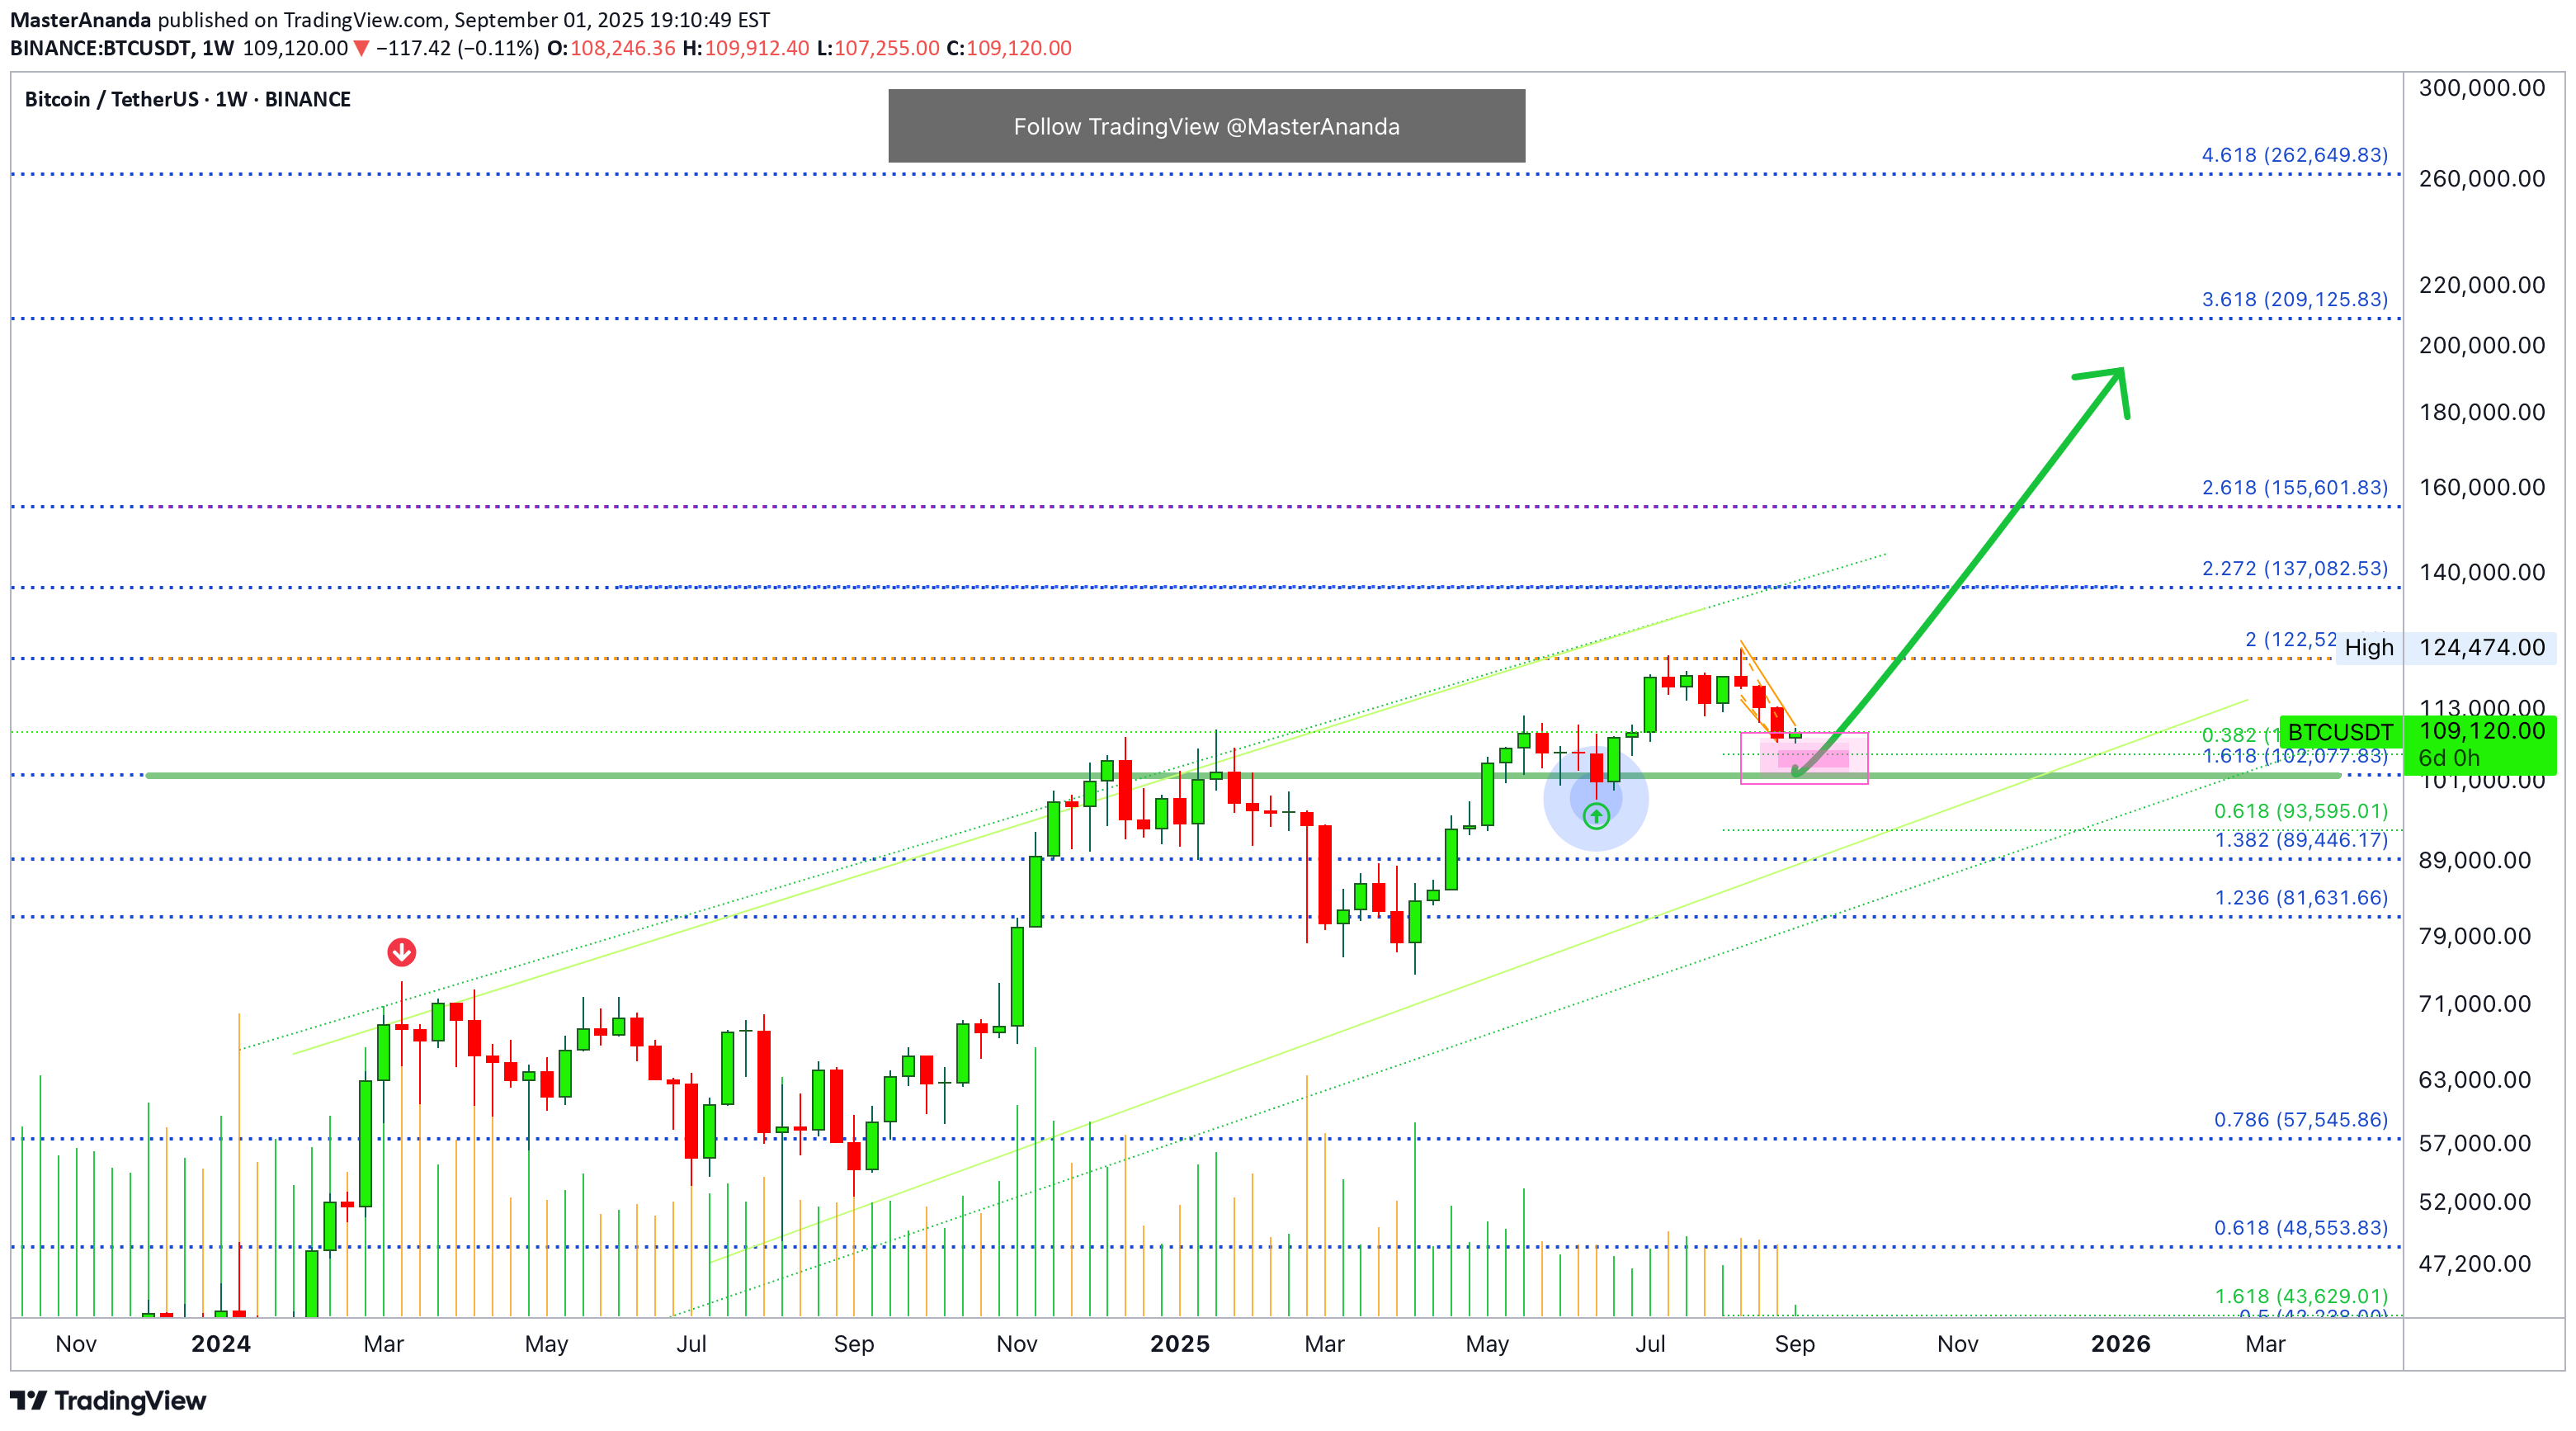
I will show you only two signals supporting the end of the current retrace/correction, it was a long one when you consider that the market is bullish. I think you will agree with me but we will only know in the comments section. Join me. Sit back, relax and enjoy the show. Good evening my fellow Cryptocurrency trader, I hope you are having a wonderful day. The last retrace between May and June lasted a total of six candles; counting the peak high candle as part of the retrace. The current retrace has eight candles so far; 33% more than the previous retrace. Consider a strong correction by looking at January 2025, it goes for months and three red sessions would produce a very strong price decline. Consider also March 2024. A strong correction lasted five months. Now, compare these two to the ones I just mentioned above. Here the difference between a correction and a retrace is very strong. The second telling signal is the fact that Bitcoin continues trading above $100,000. We have 1.5 months of bearish action and yet no major support zone has been broken when we consider the long-term. The next major support is found at $102,000. This level has not even been tested and likely won't be tested if Bitcoin continues with the same type of action we are seeing today. Trading volume is very low. Before a major drop, somewhere at some point a strong selling volume bar shows up. This isn't present on this chart. The biggest volume bar after the previous correction's low was a bullish day. This reveals the fact that the bulls have the upper hand. Now, don't get me started on the altcoins... The best is yet to come. Namaste.Remember this falling wedge pattern? Here we have long lower wicks with rising volume. Just the break and close above $110,000 confirms the bulls are back in the game but there is more. There are multiple 4H candles that wicked lower but ended up closing green. We also have a high volume session where all selling was consumed. Strong selling pressure all gone. The current candle is also pretty good. The falling wedge pattern broke bullish and this opens up a test of resistance next. The next resistance of course is the previous high around $122-$124,000. Higher is possible after this resistance breaks. Namaste.