
Mihai_Iacob
@t_Mihai_Iacob

What symbols does the trader recommend buying?
Purchase History
پیام های تریدر
Filter
Mihai_Iacob
Gold —Resistance Reached at 4450–4460. Reversal or Continuation?

At the beginning of the year, I mentioned the possibility of Gold pushing higher toward the 4450–4460 zone. That scenario has now materialized — and we even saw a brief spike above this resistance area. However, as discussed in yesterday’s post, Friday’s decline and the subsequent rebound may still be part of an emotional reaction, rather than a clean trend continuation. Now that the key resistance has been reached, the market sits at an important decision point: 👉 Reversal — or continuation of the bullish move? 🔎 Current Market Perspective From my point of view, Gold may not be done correcting yet. The structure still suggests that the more probable scenario is: ➡️ a renewed move back toward the 4350 support zone Until buyers demonstrate sustained strength above the current highs, upside momentum remains questionable. 📌 Trading Bias My stance for now: 👉 Bias: bearish, with 4350 as the primary downside objective ⚠️ Scenario is invalidated if price holds above 4500 with strong buying pressure As long as 4500 caps the upside, I continue to favor a corrective rotation rather than immediate bullish continuation. 🚀
Mihai_Iacob
Gold — Strong Start to the Year. Is the Correction Over?

Gold opened the year on a positive note, advancing nearly 500 pips so far. While such a move may no longer feel spectacular in today’s highly volatile environment, its significance comes from two key factors: Price has broken back above the 4350 resistance zone, reclaiming an important technical level. The rally followed a clean reversal from the trendline support during the final trading session of 2025 — a technically meaningful reaction. ❓ The Big Question: Is the Correction Finished? It may still be too early to draw a final conclusion, especially given the low liquidity conditions at the start of the year. However, price action so far is encouraging for the bulls. For now, the line in the sand sits at: 👉 4300 support As long as buyers manage to defend this level, the market maintains a strong probability of: ➡️ retesting the 4450 resistance zone 📌 Trading Plan (Cautious Start of Year) Given the current conditions, I will: - trade with very low position size - remain patient - look to buy dips into support The market still needs to confirm momentum — but for now, the structure remains constructive for the bullish side. 🚀4450 hit
Mihai_Iacob
راز موفقیت در ترید ۲۰۲۶: دو قانون طلایی برای دوری از هیجان و افزایش نظم!

Over the past years, the crypto market has evolved from a curiosity-driven financial space into a highly competitive environment — where the difference between speculation and disciplined trading has become clearer than ever. Most traders don’t lose money because they lack technical skills. They lose because of: - psychological biases - unrealistic expectations - bad information sources For 2026, I would reduce things to just two essential principles. 🔹 1. Stop following bombastic influencers with a single narrative If your feed looks like this… - “Altcoin season is coming” - “Next 100x coins” - “How to become a millionaire in 2026” - “This coin will change your life” …you are not learning. You are being emotionally conditioned. These influencers/content creators are not traders — they are marketers. Their incentives are: ➡ engagement ➡ clicks ➡ referrals ➡ product sales Regardless of: - trend direction - market cycle - volume and liquidity - macro environment their message remains the same: “Bullish. Huge upside ahead. Don’t miss the opportunity.” The real problem? They never: - consider alternative scenarios - discuss risk or downside - speak in probabilities - build structured technical arguments They don’t do analysis. They sell optimism. For a trader, exposure to this kind of content: - increases FOMO - reduces patience - destroys discipline - creates unrealistic expectations If you see permanent hype — scroll past it . A sustainable portfolio is not built on motivational narratives. 🔹 2. Use technical analysis and trade major, liquid coins Most traders don’t blow up accounts because they: - fail to understand patterns - misread signals They blow up because they allocate risk into: - illiquid tokens - low-cap projects - structurally weak charts - easily manipulated markets Major, liquid coins: - respect technical levels better - have real trading volume - react more cleanly to structure - provide clearer probability models Examples where TA makes sense: - BTC - ETH - SOL - high-liquidity L1 / L2 Here you can apply: - trend-following - support & resistance - liquidity zones - volume reactions - structural break logic You do NOT need to search for: ❌ “hidden gems” ❌ “next 100x coin” ❌ “unknown early opportunity” You should be searching for: 👉 discipline 👉 structure 👉 probability Trading improves when you stop: - chasing hype - hunting jackpots - confusing hope with analysis Closing Thought If I had to summarize in one principle: Less noise. Less spectacle. More structure. More responsibility. Success in trading rarely comes from: ❌ catching the miracle coin ❌ believing motivational promises ❌ chasing the next big narrative It comes from: ✅ disciplined technical analysis ✅ rational risk management ✅ focusing on liquid assets ✅ staying emotionally grounded Everything else is noise. Happy New Year! Mihai Iacob
Mihai_Iacob
Precious Metals Outlook for 2026

Without any doubt, 2025 has largely been the year of precious metals (besides A.I). Gold, silver, and later platinum dominated market narratives, with December standing out as a particularly explosive month — especially for silver and platinum. And while making predictions for 2026 is inherently difficult — given how quickly fundamentals and geopolitics can shift — we can still extract a lot of insight from the charts and the broader technical context. So let’s break down the current situation and outline the key scenarios going forward. XAUUSD — Gold: A Sharp Correction Inside a Larger Bull Market After printing a new All-Time High around 4550 on the second day of Christmas, the yellow metal faced a violent reversal. On Monday, December 29th, the week opened with a major sell-off, and gold dropped nearly 2,500 pips from top to bottom. Yesterday, the bulls attempted to regain control, but their efforts failed and the session closed as a continuation Pin Bar, signaling potential downside continuation. At the time of writing, price is trading around 4320, testing and “flirting” with the rising trendline that started back in August. If we see a genuine breakdown below this structure, the next technical downside targets could be: - first zone: 4200 - extended correction target: 4050 These levels align with prior support clusters and psychological price areas. However — and this is the key point — even if gold corrects toward the 4,000 zone, I do not expect a long-term trend reversal heading into 2026. From my perspective, this move currently looks like: 👉 a healthy corrective phase inside a larger bullish cycle Once gold finds a meaningful bottom and the correction runs its course, the most probable long-term scenario remains: - trend continuation to the upside - renewed bullish momentum during 2026 - and a potential move toward new All-Time Highs, possibly even above 5,000 zone, if market conditions align. XAGUSD — Silver: Stronger Momentum & A More Explosive Upside Profile November and December brought an extraordinary rally in silver, with price almost doubling in a very short period of time. On Monday, December 29th, the market printed what looks very much like a blow-off top, followed by a sharp decline after reaching the 84 USD zone, a fresh ATH. After such a dramatic rise — from 45 to nearly 85 in just two months — a correction is not only normal… …it is healthy, necessary, and even welcome from a market structure perspective. And as I have repeatedly stated over the past six months: 👉 My medium-to-long-term outlook remains more bullish on silver than on gold Silver historically tends to outperform gold during later stages of a precious-metal bull cycle, and price behavior in 2025 fits that pattern quite well. Once this corrective phase ends, I expect: - the bullish trend to resume - volatility to remain ETREMELY high - momentum to shift back in favor of buyers With a realistic upside projection toward: ➡️ 100 USD — or even higher — during 2026 For long-term investors and position traders, one key area I am watching closely (if the correction deepens) is the: 🔹 60–63 USD zone This region may provide an attractive accumulation area for strategic long-term buying — assuming price stabilizes and confirms support there. XPTUSD — Platinum: The Late-Year Explosion & A Deeper Pullback Zone Platinum also delivered spectacular price action in December. From around mid-month, price literally exploded upward, culminating in a new ATH near 2600. At the moment, platinum is also inside a corrective phase — which is again perfectly normal after such an aggressive impulsive rally. From my point of view, if the pullback extends further, a particularly interesting technical area to watch is: 🔹 around the 1600+ zone This region may become a highly attractive level for long-term accumulation and potential buy-position setups — provided price confirms support and market conditions stabilize. Final Thoughts — Corrections Don’t Cancel Bull Markets Yes — corrections across precious metals currently look sharp and emotional. But sharp corrections are a defining characteristic of major bull markets. At this stage, nothing in the broader structure suggests a true long-term reversal. Instead: - gold remains structurally bullish despite the pullback - silver still shows stronger potential upside than gold - platinum is entering what may become an attractive accumulation zone 2026 may still belong to precious metals — even if the path forward includes volatility, deep retracements, and periods of uncertainty. As always, the market will have the final word — but technically, the broader narrative remains intact. 🚀 Happy New Year! Mihai Iacob
Mihai_Iacob
Trading Sins to Overcome in 2026 — A Guide for Serious Traders

Trading isn’t just about charts, patterns, and strategies. It’s a mirror — one that reflects discipline, emotional maturity, patience, and self-awareness. Most traders don’t lose because the market is “unfair.” They lose because the market exposes weaknesses they haven’t yet worked through. In 2026, markets will continue to evolve — liquidity shifts, narratives change faster, and emotional pressure will only increase. The traders who survive won’t just be technically skilled. They will be the ones who understand themselves. Below are the seven trading sins every trader must confront — not with guilt, but with awareness, compassion, and discipline. 1. Lust — Chasing Hype Instead of Discipline Lust in trading shows up as an obsession with the “shiny object”: • chasing hyped tokens • entering parabolic moves late • confusing excitement with opportunity By the time something is everywhere on social media, attention is already priced in. Late buyers don’t join rallies — they provide exit liquidity. Psychology insight: Lust grows from fear of missing out on belonging — not just profits. Traders chase hype because they want to “be where the action is.” The antidote is alignment: • trade your plan, not the market’s noise • define your time-horizon & objectives • stay loyal to your strategy, not to trends A disciplined trader doesn’t need external excitement. Consistency becomes the thrill. 2. Gluttony — Overloading Strengths and Ignoring Blind Spots Gluttony in trading isn’t overeating — it’s over-leaning: • only trading longs • repeating one setup everywhere • scaling success until it becomes weakness A trader who thrives only in one condition is not skilled — just lucky within a narrow environment. Psychology insight: Gluttony is rooted in comfort bias — the brain seeks repetition of what once worked, even when the environment changes. True maturity comes from balance: • diversify tools, not just assets • observe the trader on the other side of your trade • ask: does this serve my long-term objective? Your edge is not a weapon — it is a responsibility. 3. Greed — Wanting the Whole Move Instead of the Probable One Greed doesn’t just mean wanting more money — it means refusing to accept “enough.” It shows up as: • entering too early, with too much size • letting wins turn into losses • trying to catch bottoms and tops Professionals don’t chase precision — they take the meat of the move. Psychology insight: Greed is impatience disguised as ambition. Traders expect mastery before they’re emotionally ready for it. Growth mindset for 2026: • accept that mastery takes years • define exits before entries • allow yourself to be “wrong small” and “right sustainable” Profit isn’t made in a single great trade — it’s built in consistency. 4. Sloth — Under-Preparation in a Constantly Changing Market Sloth appears when traders: • stop reviewing markets • avoid journaling • rely on outdated biases The market evolves daily. Your preparation must evolve with it. Psychology insight: Sloth is rarely laziness — it is avoidance of discomfort. Reviewing mistakes is emotionally painful, so many traders avoid reflection… and repeat errors. Habits that beat sloth: • pre-market routine • ongoing self-assessment • incremental improvements rather than radical overhauls Discipline is not intensity — it is continuity. 5. Wrath — Revenge Trading and Emotional Overreaction Wrath in trading is anger directed at the market — and then at ourselves. It manifests as: • doubling down after losses • trying to “win back” money • self-criticism after mistakes The damage isn’t just financial — it’s also psychological. Psychology insight: Wrath is triggered when ego collides with reality. We don’t rage at the chart — we rage at losing our self-image. Practical antidote: • reduce size when emotional • normalize losses in advance • rehearse acceptance of max loss calmly Emotional resilience is a skill — and it must be trained outside live trading. 6. Envy — Measuring Progress Against Other Traders Envy is subtle and destructive: • comparing returns • trying to “catch up” • assuming others are ahead There will always be someone with: • more capital • better timing • bigger wins Chasing others’ journeys leads to reckless trading. Psychology insight: Envy grows when self-worth is tied to account balance. Shift the lens to internal progress: • define your goals • measure your improvements • celebrate small milestones Success in trading is personal — and deeply individual. 7. Pride — Refusing to Adapt or Admit Being Wrong Pride is the most dangerous trading sin. It appears as: • ignoring stop losses • adding to losers • defending a biased narrative The market humbles those who resist humility. Psychology insight: Pride protects the ego from pain — but destroys the account. The professional mindset: • build plans based on objective data • explore multiple scenarios • let price confirm — not opinion Adaptability is not weakness — it is the highest form of strength. Final Thought — Growth Over Perfection These “trading sins” are not moral flaws. They are human patterns — predictable, emotional, deeply psychological. The goal is not to eliminate them — but to recognize, manage, and outgrow them. 2026 will reward the trader who: • reflects instead of reacts • plans instead of hopes • evolves instead of resists Trading mastery is not the victory of logic over emotion — it is the integration of both. Happy New Year! Mihai Iacob
Mihai_Iacob
طلا به قله جدید رسید! اما این یک سطح کلیدی است که نباید از دست برود

Last week, Gold spent most of its time trapped inside a frustrating 4310–4350 range, aside from a mid-week spike that showed no follow-through. But once the new week opened, everything changed — Gold broke out decisively during the Asian session and is now trading around 4400, printing a fresh all-time high. From a technical standpoint, the path of least resistance is up, and further ATHs look very realistic over the next few days. But for this momentum to hold, the 4350 zone must be defended. If bulls lose that level, the breakout loses its validity. As long as 4350 holds, the scenario remains constructive — and a move toward 4500 by Christmas is not only possible, but plausible.
Mihai_Iacob
بیت کوین کف را نشکسته؛ آماده سقوط تا ۷۵ هزار دلار باشید!

As I mentioned in my previous analysis, the idea that “BTC has bottomed” simply doesn’t convince me. And let’s be honest: when a true bottom forms, you won’t see every account on social media announcing it. Markets don’t work that way — especially crypto, where optimism is often weaponized. From a structural perspective, the entire rise from the 80k zone looks like a textbook corrective move. Yes, we had a perfectly normal rebound into the 94k area, but everything that followed has been classic corrective behavior: - Mostly ranging price action - Repeated spikes into 95k that were quickly sold - Clear overlapping structure - A bearish flag, which statistically favors continuation lower If we also consider the four-month distribution phase between 110k–120k, it becomes even harder to justify a bullish reversal narrative. Distribution of that scale rarely resolves into instant trend reversals — instead, it usually marks the beginning of a deeper cycle shift. So from a psychological standpoint, the crowd is still bargaining — trying to convince themselves the trend is intact, even though the structure keeps printing lower-probability bullish outcomes. That cognitive dissonance is exactly what fuels bear markets. My view remains unchanged: 75k remains the primary downside target. And for me, nothing changes unless BTC manages to stabilize above 100k — not just wicks above, but hold with clear buying interest. Until that happens, selling rallies is the only rational play.
Mihai_Iacob
بزرگترین انتقال ثروت تاریخ: پول مردم کجا رفت؟ (راز پشت ارزهای دیجیتال)

Answer: Yes. But not in the direction people hope. In the last decade, crypto marketing has repeated one grand promise: “This is the biggest wealth transfer in human history!” And in classic Radio Yerevan fashion, this statement is both true and misleading. Yes — a historic wealth transfer took place. No — it did not empower the average investor. Instead, it efficiently moved wealth from retail… back to the very entities retail thought it was escaping from. Let’s break it down: structured, clear, and with just the right amount of irony. 1. The Myth: A Decentralized Financial Uprising The early crypto narrative was simple and beautiful: - The people would reclaim financial independence. - The system would decentralize power. - Wealth would flow from institutions to individuals. The idea was inspiring — almost revolutionary. Reality check: Revolutions are expensive. And someone has to pay the bill. In crypto’s case, the average investor volunteered enthusiastically. 2. The Mechanism: How the Transfer Actually Happened To call crypto a wealth transfer is not an exaggeration. The numbers speak loudly: Total market cap peaked above $3+ trillion. Most of the profit was extracted by: - VCs who bought early, - teams with massive token allocations, - exchanges capturing fees on every trade, - and whales who mastered liquidity cycles. Retail investors, meanwhile, contributed: - capital, - liquidity, - hope, - hype - and a remarkable tolerance for drawdowns. It was, in essence, the perfect economic loop: money flowed from millions → to a concentrated few → exactly like in traditional finance, only faster and with better memes. 3. The Irony: A Centralized Outcome From a Decentralized Dream Here lies the great contradiction: Crypto promised decentralization. Tokenomics delivered centralization. When 5 wallets hold 60% of a token’s supply, you don’t need conspiracy theories — you need a calculator. The “revolution” looked more like: - Decentralized marketing - Centralized ownership - Retail-funded exits - And a financial system where “freedom” was defined by unlock schedules and vesting cliffs But packaged correctly, even a dump can look like innovation. 4. Why Retail Was Doomed From the Start Not because people are unintelligent, but because: - No one reads tokenomics. - Unlock calendars sound boring. - Supply distribution charts kill the romance. - Liquidity mechanics are not as exciting as „next 100x gem”. - And hype travels faster than math. In a speculative market, psychology beats fundamentals until the moment fundamentals matter again — usually when it's too late. 5. The Real Wealth Transfer: From “Us” to “Them” The slogan said: “Crypto will redistribute wealth to the people!” The chart said: “Thank you for your liquidity, dear people.” The actual transfer looked like this: - Retail bought the story. - Institutions created the tokens. - Retail bought the bags. - Institutions sold the bags. - Retail called it a correction. - Institutions called it a cycle. Everyone had a term for it. Only one group had consistent profits from it. 6. So, Was It the Biggest Wealth Transfer in History? Yes. But not because it made the average investor rich. It was the biggest because: - no previous financial system mobilized so many people - so quickly - with so little due diligence - to transfer so much capital - to so few beneficiaries - under the banner of liberation. It wasn’t a scam. It wasn’t a conspiracy. It was simply financial physics meeting human psychology. 7. The Lesson: Crypto Isn’t the Problem — Expectations Are - Blockchain remains a brilliant invention. - Tokenization has real use cases. - DeFi is a groundbreaking paradigm. - And so on The issue wasn’t the technology. It was the narrative that convinced people that buying a token was equivalent to buying financial freedom. Real freedom comes from: - understanding liquidity, - reading tokenomics, - respecting supply dynamics, - and asking the only question that matters: “If I’m buying… who is selling?” In markets — especially crypto — this question is worth more than any airdrop. 8. Final Radio Yerevan Clarification Question: Will the next crypto cycle finally deliver the wealth transfer to the masses? Answer: In principle, yes. In practice… only if the masses stop donating liquidity.
Mihai_Iacob
چرا سرمایهگذاران کریپتو زود فراموش میکنند؟ شبیه به قماربازان کازینو!
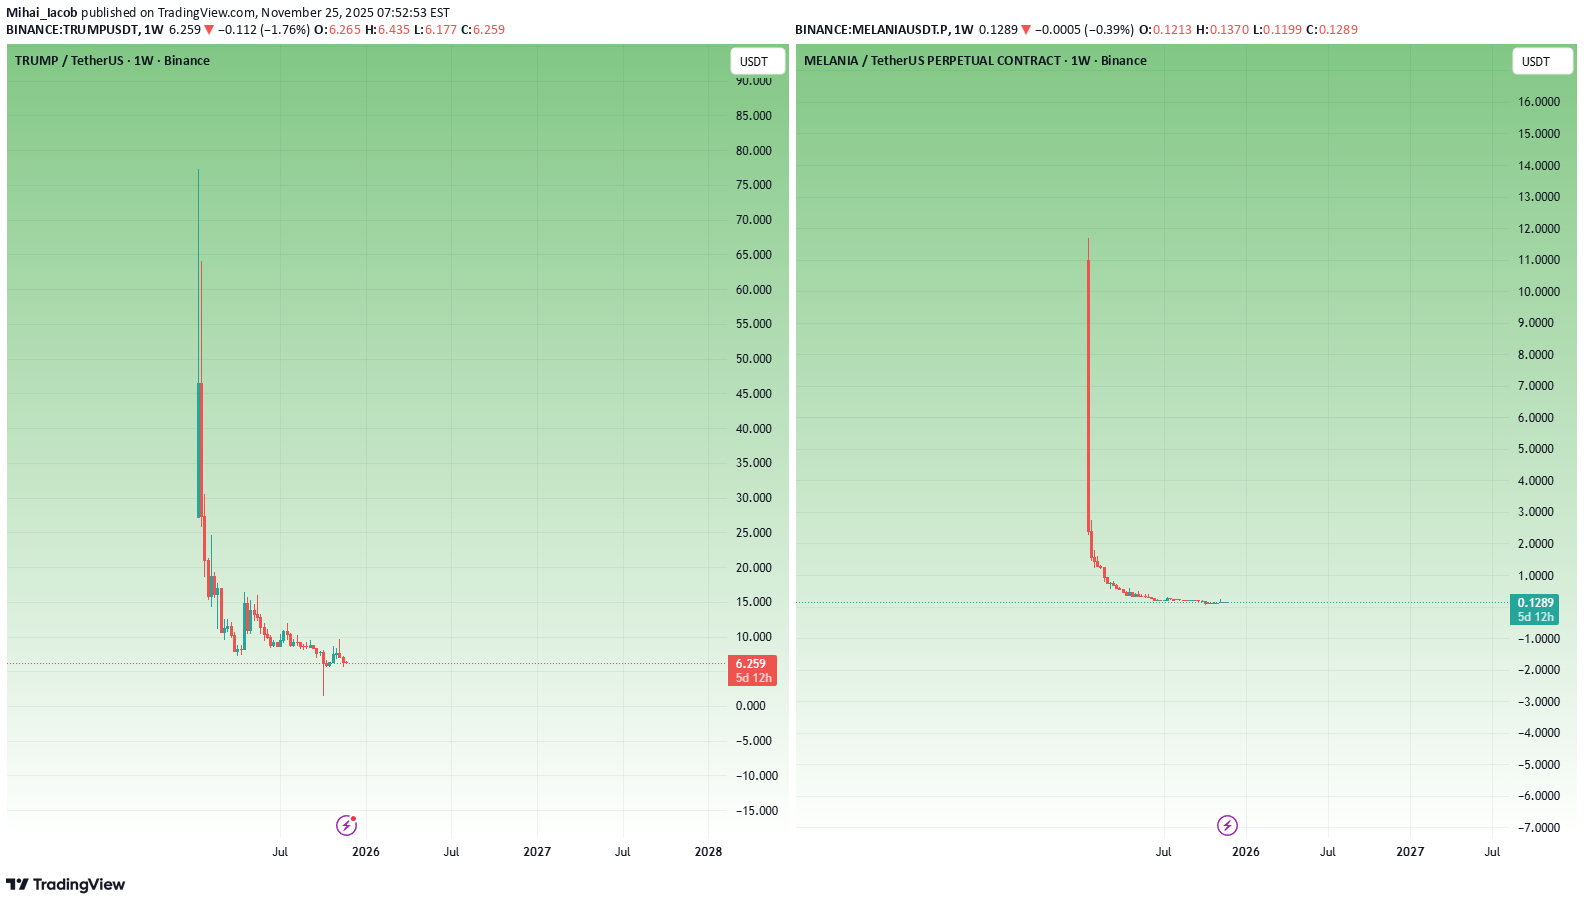
I’ve never been much of a gambler. I don’t chase roulette, I don’t play blackjack regularly, and casinos have never been my second home. But on the rare occasions when I did go—usually dragged by friends who actually like gambling—something strange happened to me. I ended up losing considerable amounts of money. - Not because I thought I’d win. - Not because I had a “system.” - Not because I felt lucky. It was the environment: - the lights - the noise - the adrenaline - the drinks - the atmosphere that hijacks logic And the next morning, the internal monologue was always the same: “See, idiot? Again you drank one too many and managed to lose a Hawaii vacation.” - The regret is real. - The pain is real. - The stupidity is, HOHO, WAY TOO REAL. But the disturbing part? Even though I don’t gamble… even though I don’t chase casinos… the environment alone was enough to override my reasoning. And if that can happen to someone who isn’t a gambler, imagine what happens to someone who willingly walks into a casino every day —because that’s exactly what crypto "investors" do. Crypto markets are casinos with better screens, countless memes, screaming influencers and worse odds. And "investors" forget far too quickly. Crypto "Investors" Forget Too Quickly — Just Like Casino Gamblers Who Keep Coming Back for More Crypto "investors" have one of the shortest memories in financial markets. - Not because they are stupid. - Not because they don’t care. - But because the entire crypto environment is engineered to erase pain and preserve hope — exactly like a casino. Put a gambler in a casino, and he forgets last night’s disaster the moment he sees the lights again. This comparison is not metaphorical. It is psychologically identical. Let’s break it down properly. 1. The Human Brain Is Not Built for Crypto — or Casinos Both environments share the same psychological architecture: - bright colors - fast feedback loops - uncertainty - intermittent rewards - emotional highs - catastrophic lows - near-wins that feel like wins - an illusion of control Neuroscience calls this: Intermittent Reinforcement The most addictive reward structure ever discovered. Slot machines are built on it. Most crypto charts mimic it. Volatility fuels it. When rewards arrive unpredictably: - dopamine spikes - memory of losses fades - the brain overvalues the next opportunity - the pain of the past gets overwritten - the hope of future reward dominates This is why gamblers return. And this is why crypto "investors" buy the same s..ts. 2. The Crypto Cycle Erases Memory by Design After every bull run for an obscure coin: - big money is made (by insiders) - screenshots are posted - what if you have bought with 100usd appear - influencers multiply - everyone becomes a “trading wizard” - Twitter becomes an ego playground - greed replaces rationality After every strong bear move: - portfolios crash 90-95% - people swear “never again” - Telegram groups die - influencers delete posts - conviction collapses - despair dominates But then… When a new "narrative" appears: - Everything resets. - Crypto "investors" forget instantly. No other financial market resets memory this fast. - In stocks, a crash leaves scars. - In forex, blown accounts create caution. - In real estate, downturns shape behavior for years. But in crypto? The new "narative"/ the new hyped coin erases the old one like chalk on a board. 3. The TrumpCoin & MelaniaCoin Episode (Just an Example): The Best Proof That Crypto Traders Forget Too Quickly TrumpCoin and MelaniaCoin didn’t have real value. They weren’t serious projects. They weren’t even clever memes. They were psychological traps built on celebrity gravity. People bought because: - the names were big - the media amplified the narrative - the symbolism felt powerful - the story was exciting And the wipeout was brutal. But the key point is: traders forgot instantly. Within weeks, they were already hunting for: - “the next TrumpCoin” - “the next politician meme” - “the next celebrity pump” - “the next token with a ‘name’ behind it” - "the next 100x" "the next, the next, the next" and is always the same - Not the next valuable project. - Not the next real innovation. - Not the next sustainable investment. No. The next symbol. This is not market behavior. This is casino relapse psychology. 4. These Coins Didn’t Fail Because They Were Memes —They Failed Because They Were Nothing TrumpCoin & MelaniaCoin ( Again, is just an example) pretended to matter because the names mattered. - Traders didn’t buy utility. - They bought a fantasy. The same way gamblers believe a “lucky table” changes their odds. In crypto, people believe: - the celebrity matters - the narrative matters - the hype matters Reality doesn’t. 5. Why Crypto "Investors" Don’t Learn: Because They Don’t Remember Crypto "investors" are not stupid. They are forgetful. They forget the months of pain and remember only the few happy moments. They forget: - drawdowns - stress - panic - illusions - scams - broken promises - influencers lies They remember: - one good run - one moonshot - one dream This is why most altcoins and memes thrive. Not because they deserve to. But because forgetting resets demand every time. 6. The Industry Is Designed to Exploit This Amnesia If traders remembered: - Luna - FTX - SafeMoon - ICO (2017) crashes - NFT (2021) collapses - Meme mania recently …the most of the altcoin sector would evaporate overnight. But "investors" forget —so altcoins with a "nice" story resurrect. Like slot machines resetting after every gambler walks away. 7. The Cure: You Don’t Need Better Tools — You Need a Better Memory The greatest edge in crypto is not fancy indicators, bots to be the first in, or whatever invention comes next. It’s remembering. Remember: - why you lost - how you lost - which narrative fooled you - how the market humiliated you - what the casino environment does to your brain - how celebrity tokens wiped people out Crypto trading requires memory, not optimism. Conclusion: Crypto "Investors" Forget Too Quickly —And That’s Why They Keep Losing Crypto "investors" don’t think like REAL investors. They think like gamblers: - emotional - hopeful - impulsive - forgetful convinced “this time will be different” The latest meme mania proved this perfectly. Crypto is not dangerous because it is volatile. Crypto is dangerous because it erases your memory. The "investor" who forgets loses. The "investor" who remembers wins. Because in crypto: The moment you stop forgetting is the moment you finally start winning. P.S. (A Necessary Clarification, Said Gently — and Honestly) Throughout this article I used the word “investors” in quotation marks — and it wasn’t an accident. Most of the people who call themselves investors in crypto are not actually investing. They are speculating, chasing, hoping, and gambling on meme coins and obscure altcoins purely because “they have 100x potential.” Let’s be honest: - buying a token named after a frog - or a coin launched yesterday by anonymous developers - or a “next big narrative” pump with zero product - or a celebrity meme coin - or something that exists only on Twitter…is not investing. It’s gambling dressed in nice vocabulary. And that’s okay — as long as you know what it is. Also, to be clear: When I critique “altcoins,” I am not talking about all of them. There are real infrastructure projects, real protocols, real technology, and real builders out there. But let’s not pretend: 90% of altcoins exist for hype, for extraction, for speculation, and for the dopamine of “maybe this one will moon.” I’m talking about those coins — the ones that behave like slot machines and survive only because traders forget too quickly. If this article made you uncomfortable, good. Sometimes the truth has to sting before it can help.
Mihai_Iacob
آیا کف بیت کوین زده شد؟ تحلیلگر: اصلاحی است و هدف بعدی 75 هزار دلار است!
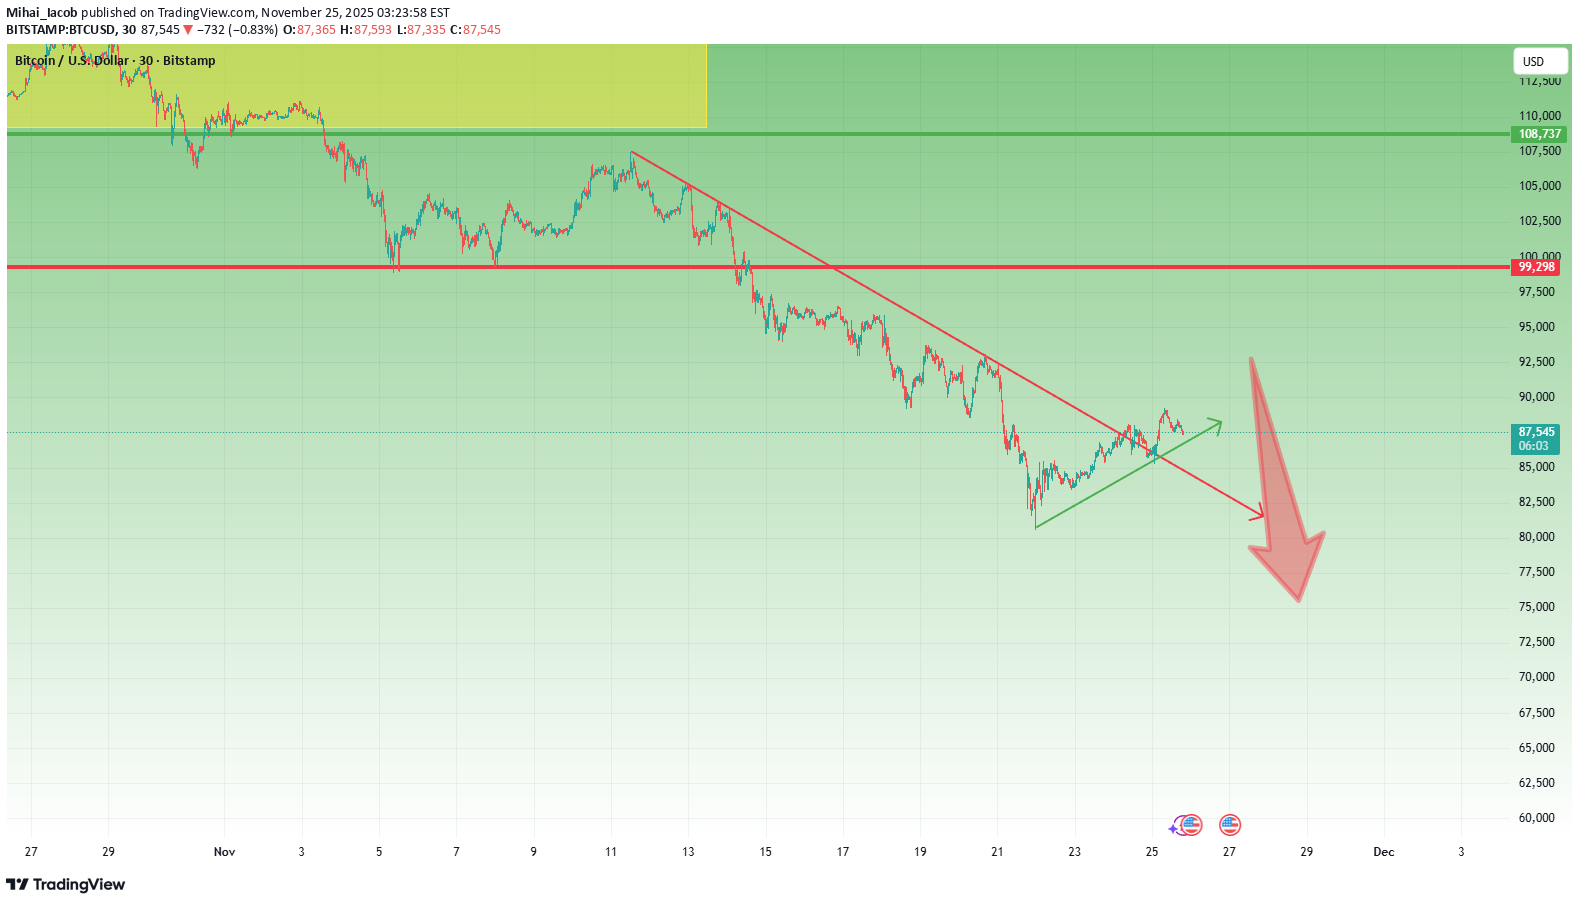
1. Recap of My Last BTC Outlook (5 November) In the 5th November analysis, I noted that the 106k support zone was under pressure, and if that level failed, the next meaningful target would be 90k — because 100k, despite being psychological, should not offer much after technical break. That played out perfectly: - 106k failed - 100k offered nothing but a small rebound - BTC dropped straight into the 90k zone And then continued even deeper, almost touching 80k before rebounding We’re now trading around 87,500, after a textbook corrective bounce. 2. Is the Bottom In? ➡️ In my opinion, no. Definitely not. And here’s where I apply my usual contrarian filter: Whenever I start hearing the same voices saying the same thing — “Bitcoin bottom is in! Bitcoin up only!” — I immediately become cautious. These are the same people who never consider the other side of the market. A broken compass can show the right direction once in a while, but it’s still broken. 3. Technical Picture – Nothing Bullish Here - Yes, the bounce from 80k is normal and expected. - Yes, BTC can easily retrace 10–15k after a large drop. - But nothing in the current structure suggests a meaningful bottom. What we have right now is: - A classic corrective rebound - Weak impulse - No break back above of important resistance - No reversal pattern - No shift in market bias It looks exactly like what price should do after a violent leg down — not like a new bull trend. This is the type of rebound where retail screams “moon,” but professionals simply prepare for another sell. 4. My Outlook – Bearish Until BTC Reclaims 100k With Conviction My plan is simple and level-driven: Preferred Sell Zone: - 92k → This is where I want to sell, ideally on a weak rally Downside Targets: - 80k → Recent low and first logical stop - 75k → Major structural support and second target Bearish outlook is invalidated ONLY if: ➡️ BTC reclaims 100k with conviction (not a wick, not a temporary spike) Until that happens, every rally is a potential shorting opportunity. 5. Conclusion – Still Bearish, Despite the Bounce BTC has done exactly what it was supposed to do: - Drop to 90k - Overshoot to 80k - And bounce in a corrective manner Nothing about this price action signals a bottom. If anything, it signals more downside ahead — once the corrective rally into 92k completes. Bias: Bearish Approach: Sell rallies Invalidation: Break and hold above 100k with conviction Until then, the narrative “bitcoin up only” remains a meme, not analysis. ⚠️BTC has entered my sell zone
Disclaimer
Any content and materials included in Sahmeto's website and official communication channels are a compilation of personal opinions and analyses and are not binding. They do not constitute any recommendation for buying, selling, entering or exiting the stock market and cryptocurrency market. Also, all news and analyses included in the website and channels are merely republished information from official and unofficial domestic and foreign sources, and it is obvious that users of the said content are responsible for following up and ensuring the authenticity and accuracy of the materials. Therefore, while disclaiming responsibility, it is declared that the responsibility for any decision-making, action, and potential profit and loss in the capital market and cryptocurrency market lies with the trader.