
MELANIA
میم کوین رسمی ملانیا
| تریدر | نوع سیگنال | حد سود/ضرر | زمان انتشار | مشاهده پیام |
|---|---|---|---|---|
نتیجه ای یافت نشد. | ||||
نمودار قیمت میم کوین رسمی ملانیا
سود ۳ ماهه :
سیگنالهای میم کوین رسمی ملانیا
فیلتر
مرتب سازی پیام براساس
نوع پیام
نوع تریدر
فیلتر زمان

behdark
MELANIA Analysis (8H)
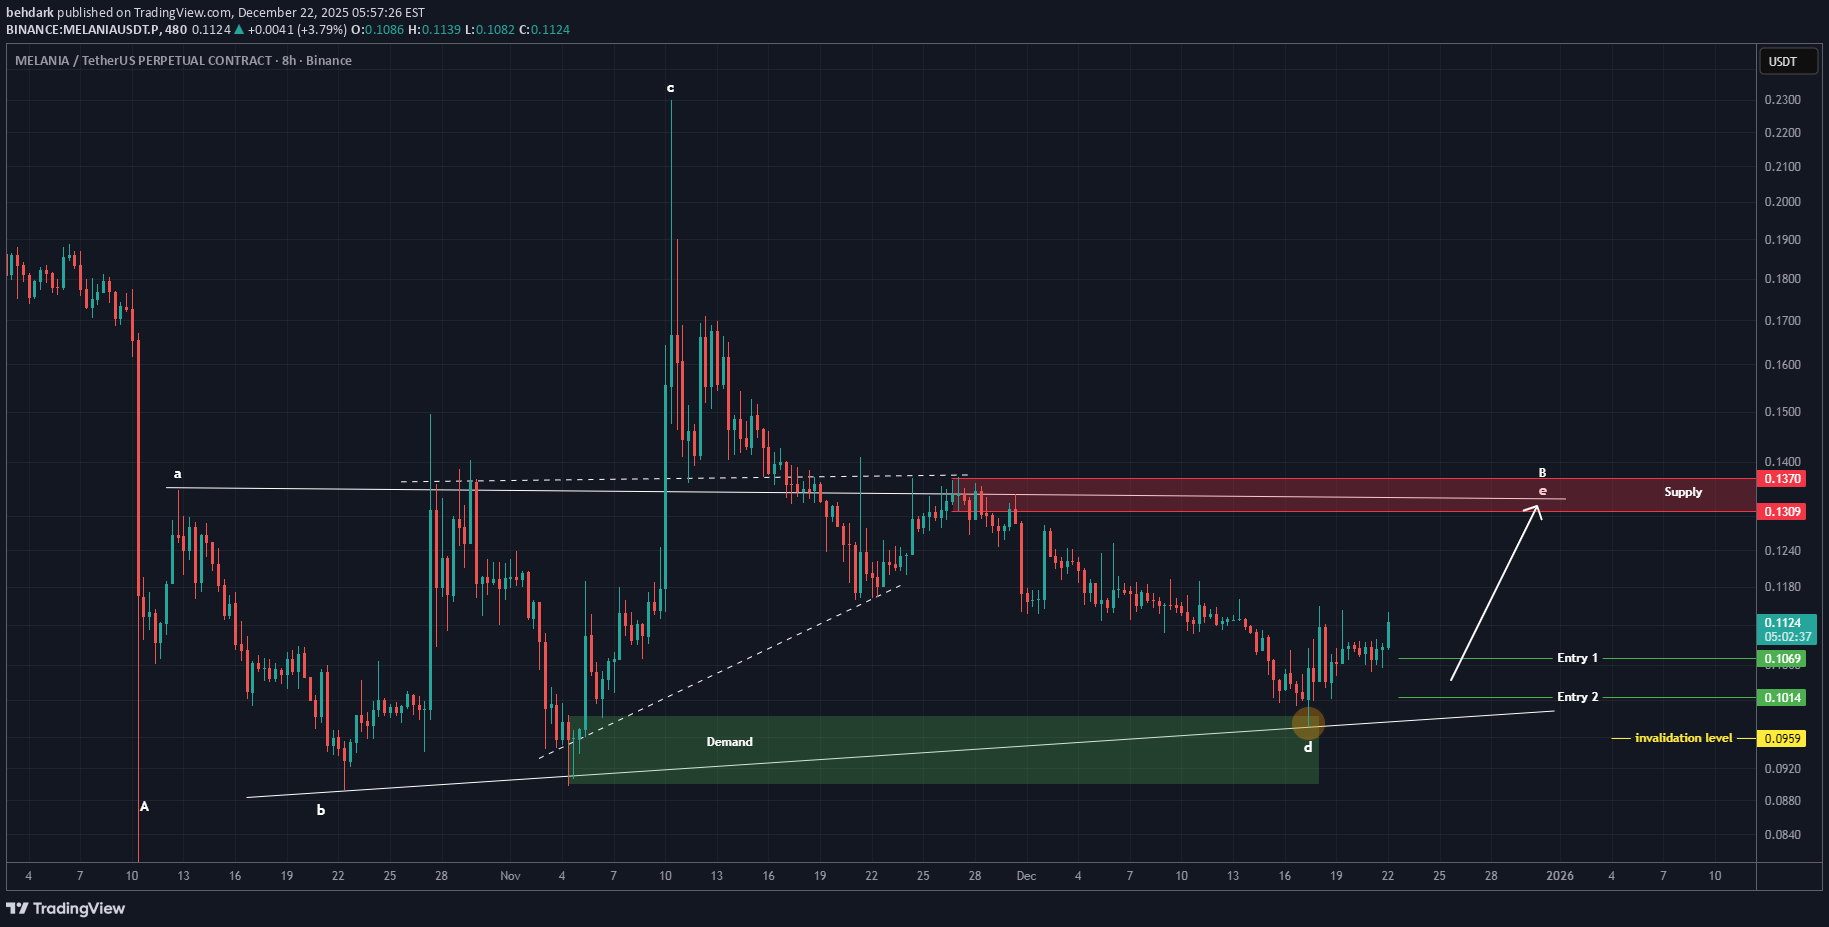
به نظر می رسد که یک مثلث در حال شکل گیری است و موج D هنوز کامل نشده است. قیمت می تواند یک صعودی move برای موج E ایجاد کند. دو نقطه ورودی برای این موج مشخص کرده ایم که باید با استفاده از DCA وارد شوند. اهداف در نمودار مشخص شده اند. بستن شمع 4 ساعته زیر سطح بی اعتباری این تحلیل را باطل می کند. برای مدیریت ریسک، لطفا توقف ضرر و مدیریت سرمایه را فراموش نکنید هنگامی که به اولین هدف رسیدیم، مقداری سود ذخیره کنید و سپس توقف را به ورودی تغییر دهید اگر سوالی دارید کامنت کنید با تشکر از شما پس از رسیدن به اولین نقطه ورودی، بیش از 11٪ پمپاژ کرده است. مقداری سود و move حد ضرر را به سرک بکشید.

asilturk
ملانیا (MELANIA): آیا این میم کوین پس از یک سال خواب، آماده انفجار است؟
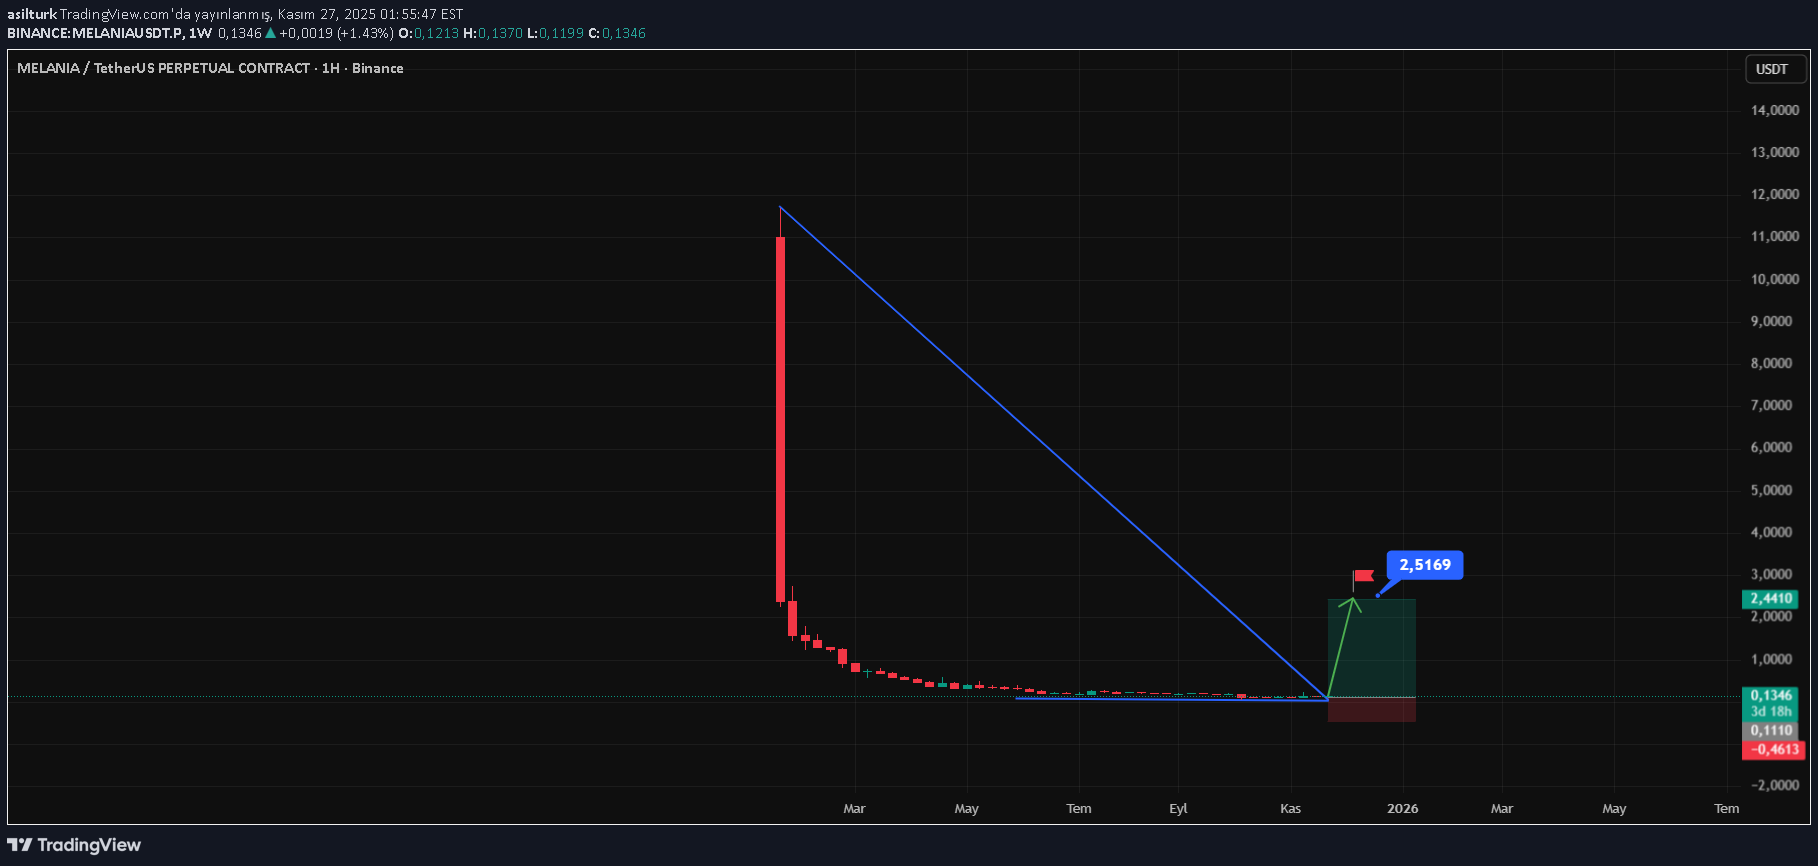
یکی دیگر از ارزهای دیجیتالی که امروز به سبد اضافه کرد، با قیمت ۰.۱۳۵۰ سنت، MELANIA است. ارزش بازار آن ۱۳۵ میلیون دلار، عرضه در گردش واقعی ۱ میلیارد واحد و سهم تسلط بر بازار (Market Dominance) آن ۰.۰۰۴۱٪ است. از نظر فنی، وقتی بررسی میکنیم، مشاهده میکنیم که کوین MELANIA که بر روی شبکه SOL معامله میشود، در تاریخ عرضه خود محدوده قیمتی ۱۱.۶۹ دلار را آزمایش کرده و تقریباً یک سال است که با افتهای شدید ادامه داده و تا قیمت ۰.۱۳۶۰ سنت عقبنشینی کرده است. از آنجایی که این یک کوین Meme است، قطعاً نوسانات قیمتی بسیار شدید صعودی و نزولی ممکن است رخ دهد؛ در نهایت باید به یاد داشت که این یک کوین meme است. با این حال، طی یک هفته گذشته شاهد حرکات قیمتی پلهای و افزایش حجم معاملات بودهایم. این کوین عملاً یک سال در خواب بوده است و در دوره یک هفته اخیر، با وجود اینکه سهم زیادی از روند نزولی کلی برده است، اما در قیمتگذاریها و نوسانات BTC مقاومت زیادی نیز از خود نشان داده است. دلیل اصلی به اشتراک گذاشتن نمودار هفتگی این است که باور دارم برای کسانی MELANIA که با میانگین قیمت ۱۱ دلاری در این محدوده ۰.۱ سنت منتظر ماندهاند، در روزهای آتی اصلاحات شدید (صعودی) رخ داد. در نتیجه، میتوان گفت که MELANIA در سطوحی قرار دارد که برای سرمایهگذاران میانمدت و بلندمدت قابل سرمایهگذاری است، اما قویاً توصیه میکنم خریدهای پلهای (تدریجی) انجام دهند. به دلیل ماهیت این کوین و حرکات بسیار شدید نزولی و صعودی آن، به این باور هستم که سرمایهگذاری پلهای رویکردی صحیح بود.

Mihai_Iacob
چرا سرمایهگذاران کریپتو زود فراموش میکنند؟ شبیه به قماربازان کازینو!
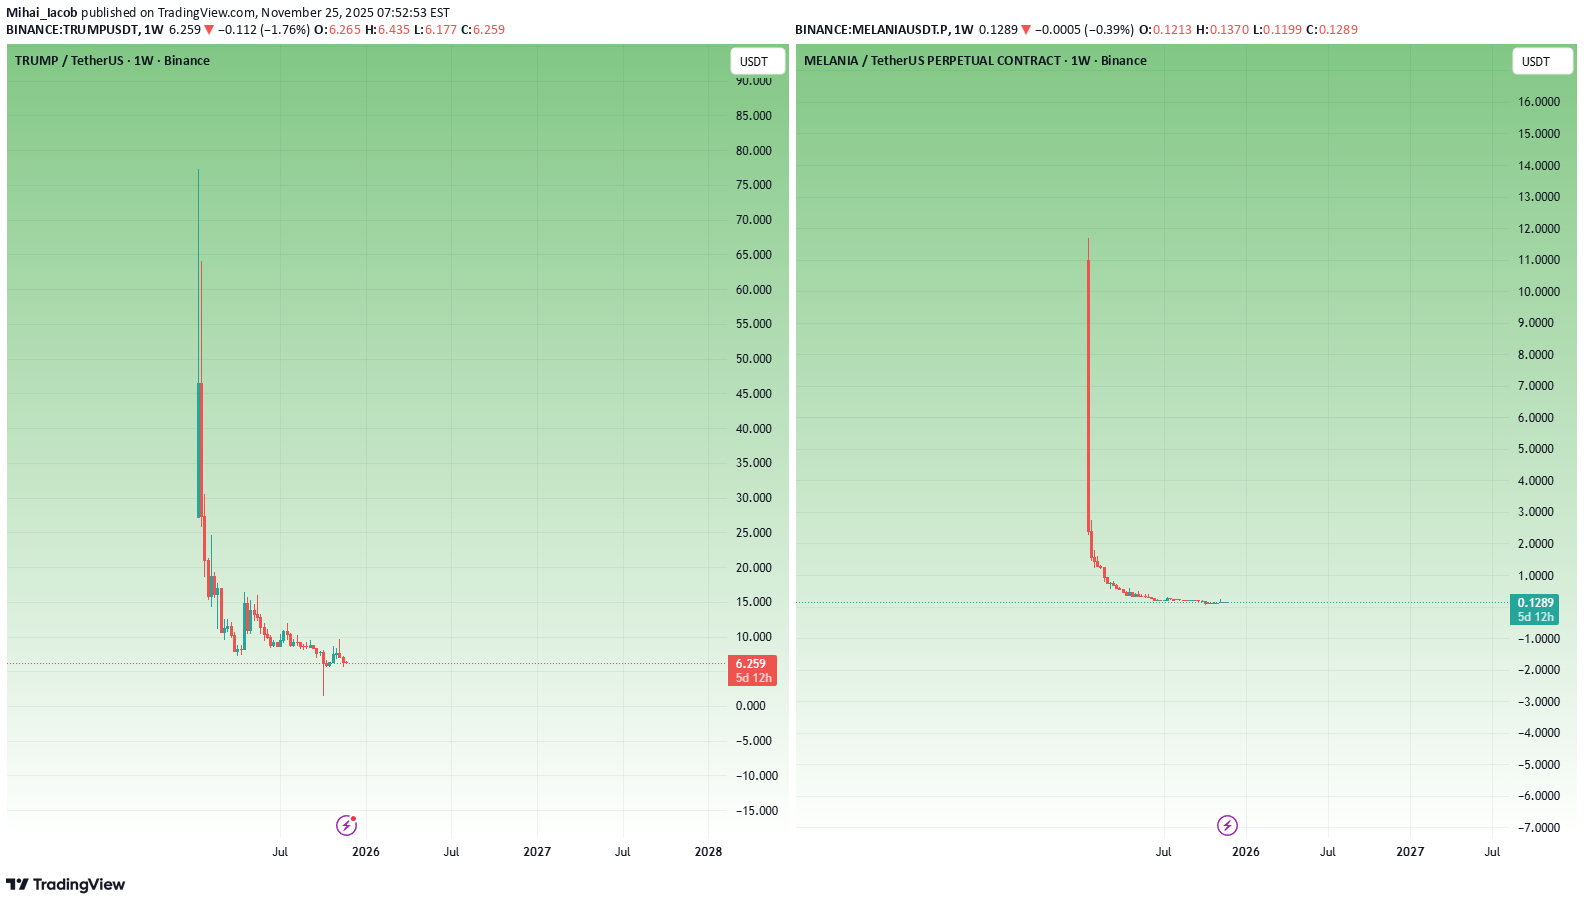
I’ve never been much of a gambler. I don’t chase roulette, I don’t play blackjack regularly, and casinos have never been my second home. But on the rare occasions when I did go—usually dragged by friends who actually like gambling—something strange happened to me. I ended up losing considerable amounts of money. - Not because I thought I’d win. - Not because I had a “system.” - Not because I felt lucky. It was the environment: - the lights - the noise - the adrenaline - the drinks - the atmosphere that hijacks logic And the next morning, the internal monologue was always the same: “See, idiot? Again you drank one too many and managed to lose a Hawaii vacation.” - The regret is real. - The pain is real. - The stupidity is, HOHO, WAY TOO REAL. But the disturbing part? Even though I don’t gamble… even though I don’t chase casinos… the environment alone was enough to override my reasoning. And if that can happen to someone who isn’t a gambler, imagine what happens to someone who willingly walks into a casino every day —because that’s exactly what crypto "investors" do. Crypto markets are casinos with better screens, countless memes, screaming influencers and worse odds. And "investors" forget far too quickly. Crypto "Investors" Forget Too Quickly — Just Like Casino Gamblers Who Keep Coming Back for More Crypto "investors" have one of the shortest memories in financial markets. - Not because they are stupid. - Not because they don’t care. - But because the entire crypto environment is engineered to erase pain and preserve hope — exactly like a casino. Put a gambler in a casino, and he forgets last night’s disaster the moment he sees the lights again. This comparison is not metaphorical. It is psychologically identical. Let’s break it down properly. 1. The Human Brain Is Not Built for Crypto — or Casinos Both environments share the same psychological architecture: - bright colors - fast feedback loops - uncertainty - intermittent rewards - emotional highs - catastrophic lows - near-wins that feel like wins - an illusion of control Neuroscience calls this: Intermittent Reinforcement The most addictive reward structure ever discovered. Slot machines are built on it. Most crypto charts mimic it. Volatility fuels it. When rewards arrive unpredictably: - dopamine spikes - memory of losses fades - the brain overvalues the next opportunity - the pain of the past gets overwritten - the hope of future reward dominates This is why gamblers return. And this is why crypto "investors" buy the same s..ts. 2. The Crypto Cycle Erases Memory by Design After every bull run for an obscure coin: - big money is made (by insiders) - screenshots are posted - what if you have bought with 100usd appear - influencers multiply - everyone becomes a “trading wizard” - Twitter becomes an ego playground - greed replaces rationality After every strong bear move: - portfolios crash 90-95% - people swear “never again” - Telegram groups die - influencers delete posts - conviction collapses - despair dominates But then… When a new "narrative" appears: - Everything resets. - Crypto "investors" forget instantly. No other financial market resets memory this fast. - In stocks, a crash leaves scars. - In forex, blown accounts create caution. - In real estate, downturns shape behavior for years. But in crypto? The new "narative"/ the new hyped coin erases the old one like chalk on a board. 3. The TrumpCoin & MelaniaCoin Episode (Just an Example): The Best Proof That Crypto Traders Forget Too Quickly TrumpCoin and MelaniaCoin didn’t have real value. They weren’t serious projects. They weren’t even clever memes. They were psychological traps built on celebrity gravity. People bought because: - the names were big - the media amplified the narrative - the symbolism felt powerful - the story was exciting And the wipeout was brutal. But the key point is: traders forgot instantly. Within weeks, they were already hunting for: - “the next TrumpCoin” - “the next politician meme” - “the next celebrity pump” - “the next token with a ‘name’ behind it” - "the next 100x" "the next, the next, the next" and is always the same - Not the next valuable project. - Not the next real innovation. - Not the next sustainable investment. No. The next symbol. This is not market behavior. This is casino relapse psychology. 4. These Coins Didn’t Fail Because They Were Memes —They Failed Because They Were Nothing TrumpCoin & MelaniaCoin ( Again, is just an example) pretended to matter because the names mattered. - Traders didn’t buy utility. - They bought a fantasy. The same way gamblers believe a “lucky table” changes their odds. In crypto, people believe: - the celebrity matters - the narrative matters - the hype matters Reality doesn’t. 5. Why Crypto "Investors" Don’t Learn: Because They Don’t Remember Crypto "investors" are not stupid. They are forgetful. They forget the months of pain and remember only the few happy moments. They forget: - drawdowns - stress - panic - illusions - scams - broken promises - influencers lies They remember: - one good run - one moonshot - one dream This is why most altcoins and memes thrive. Not because they deserve to. But because forgetting resets demand every time. 6. The Industry Is Designed to Exploit This Amnesia If traders remembered: - Luna - FTX - SafeMoon - ICO (2017) crashes - NFT (2021) collapses - Meme mania recently …the most of the altcoin sector would evaporate overnight. But "investors" forget —so altcoins with a "nice" story resurrect. Like slot machines resetting after every gambler walks away. 7. The Cure: You Don’t Need Better Tools — You Need a Better Memory The greatest edge in crypto is not fancy indicators, bots to be the first in, or whatever invention comes next. It’s remembering. Remember: - why you lost - how you lost - which narrative fooled you - how the market humiliated you - what the casino environment does to your brain - how celebrity tokens wiped people out Crypto trading requires memory, not optimism. Conclusion: Crypto "Investors" Forget Too Quickly —And That’s Why They Keep Losing Crypto "investors" don’t think like REAL investors. They think like gamblers: - emotional - hopeful - impulsive - forgetful convinced “this time will be different” The latest meme mania proved this perfectly. Crypto is not dangerous because it is volatile. Crypto is dangerous because it erases your memory. The "investor" who forgets loses. The "investor" who remembers wins. Because in crypto: The moment you stop forgetting is the moment you finally start winning. P.S. (A Necessary Clarification, Said Gently — and Honestly) Throughout this article I used the word “investors” in quotation marks — and it wasn’t an accident. Most of the people who call themselves investors in crypto are not actually investing. They are speculating, chasing, hoping, and gambling on meme coins and obscure altcoins purely because “they have 100x potential.” Let’s be honest: - buying a token named after a frog - or a coin launched yesterday by anonymous developers - or a “next big narrative” pump with zero product - or a celebrity meme coin - or something that exists only on Twitter…is not investing. It’s gambling dressed in nice vocabulary. And that’s okay — as long as you know what it is. Also, to be clear: When I critique “altcoins,” I am not talking about all of them. There are real infrastructure projects, real protocols, real technology, and real builders out there. But let’s not pretend: 90% of altcoins exist for hype, for extraction, for speculation, and for the dopamine of “maybe this one will moon.” I’m talking about those coins — the ones that behave like slot machines and survive only because traders forget too quickly. If this article made you uncomfortable, good. Sometimes the truth has to sting before it can help.

CryptoVhagar
آیا ریزش میلینا تمام شد؟ پیشبینی حرکت برگشتی و فرصتهای خرید!
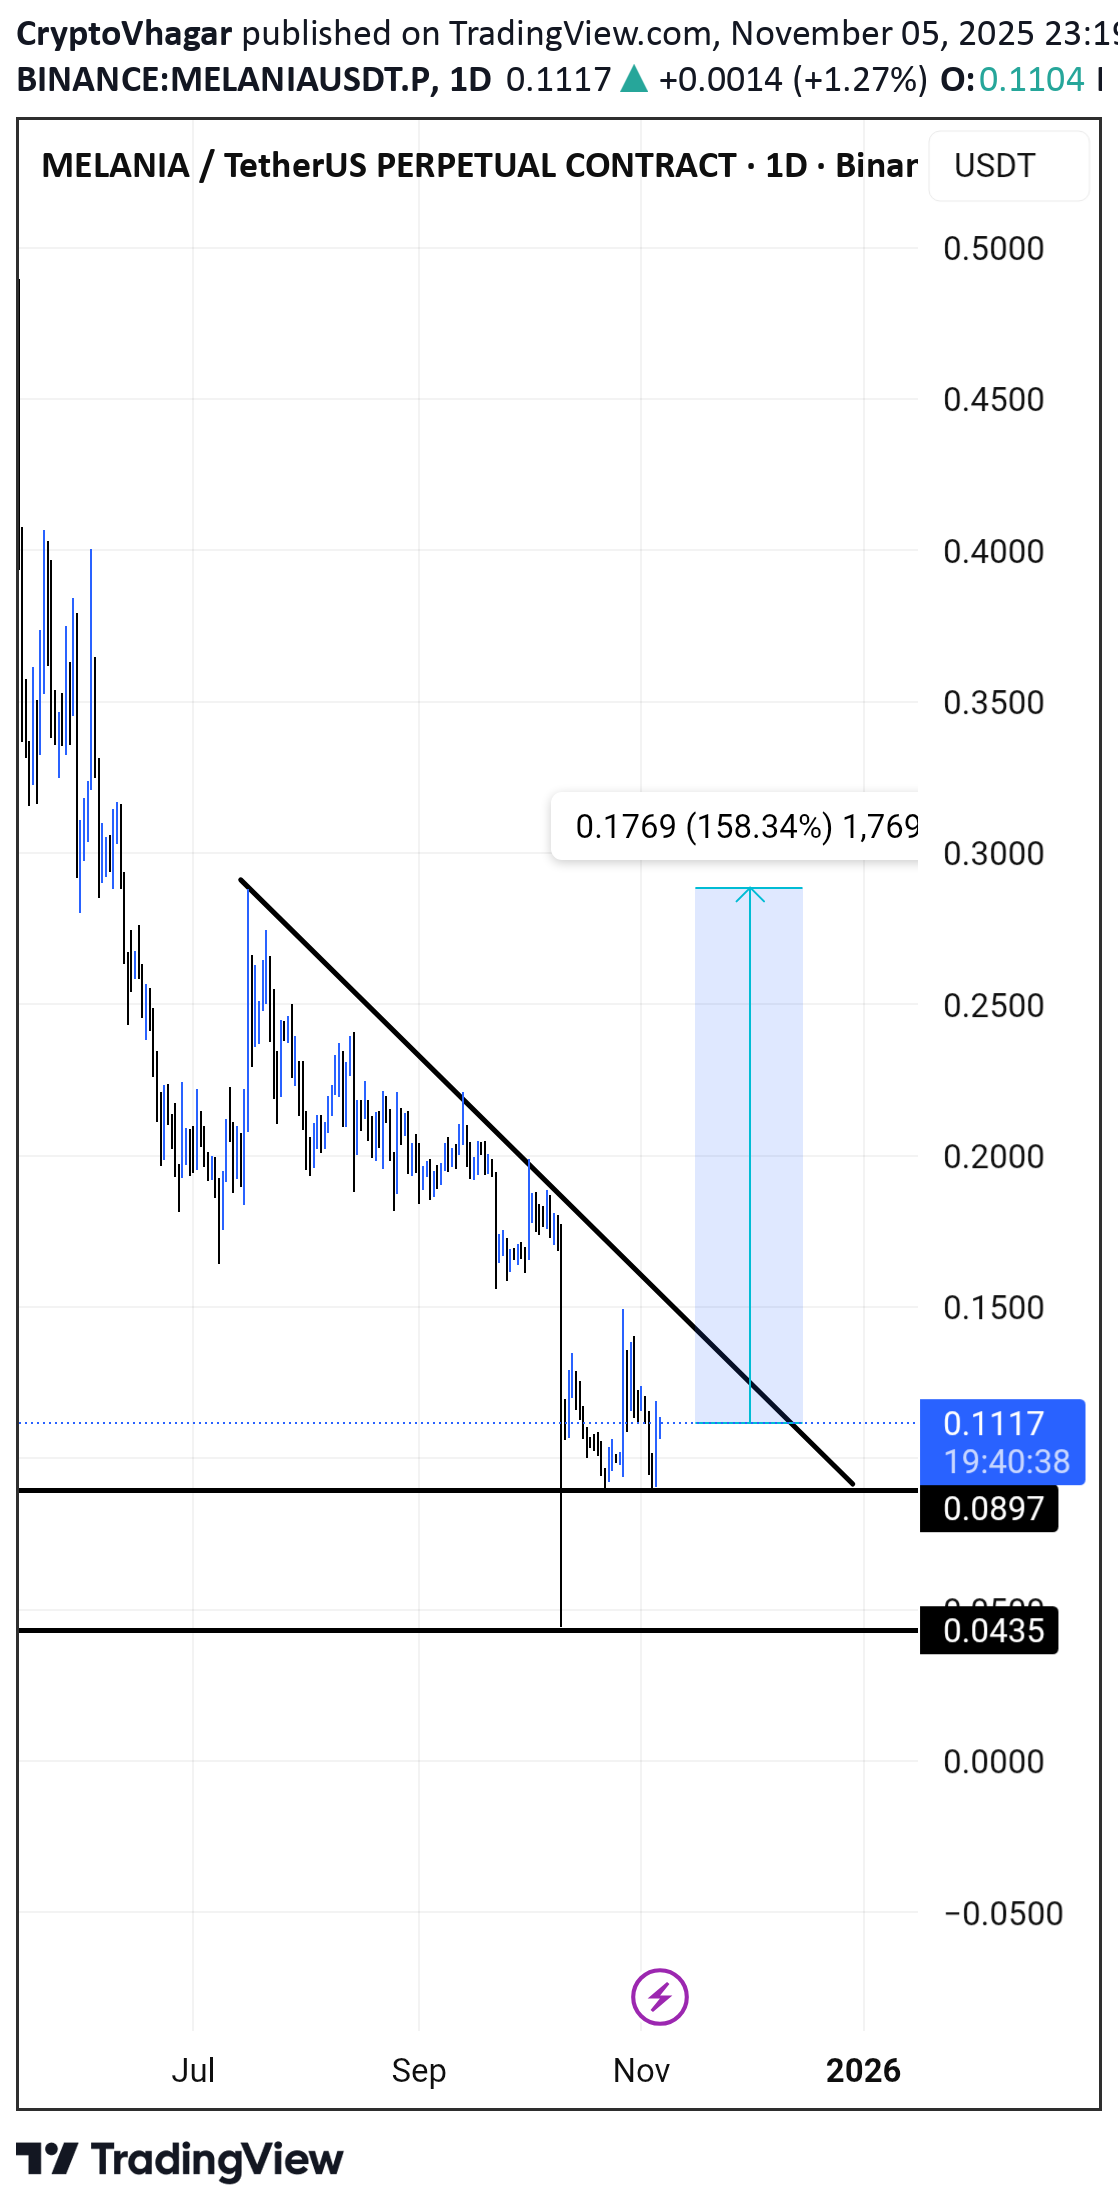
Melania بسیار کاهش یافت. من فکر می کنم پایین است در معکوس برگزار شد.

SevenStarBuySell
سیگنال فروش داغ در ملانیا: آیا وقت خروج است؟ (تحلیل با اندیکاتور 7 ستاره)
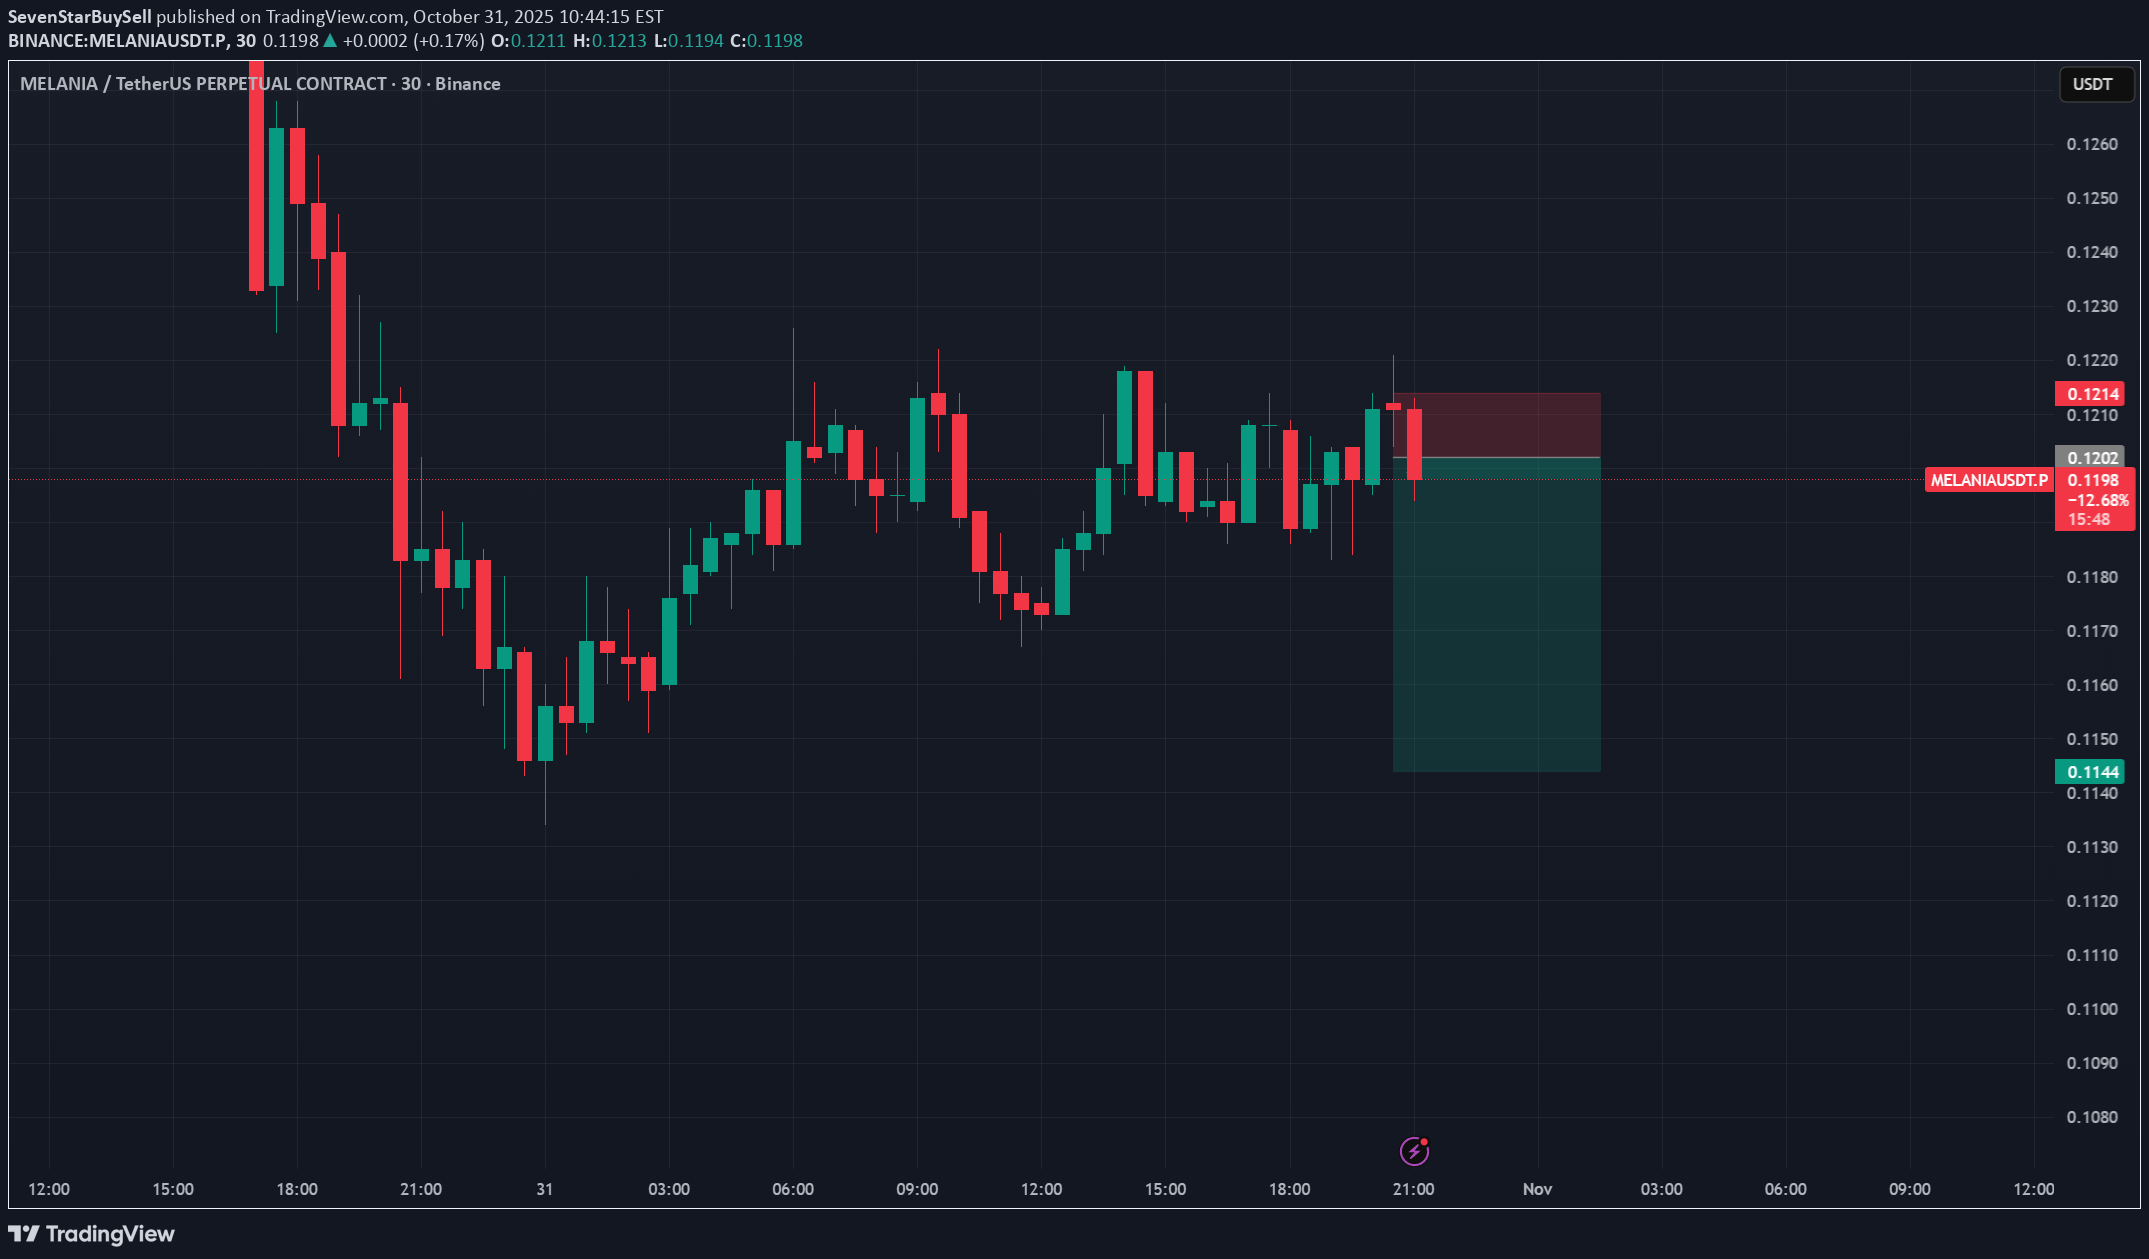
ما مطابق با شاخص خرید و فروش 7 ستاره خود، چاپ فروش در Melania داریم. بیایید ببینیم چگونه بازی می کند. اهداف در نمودارها برای دسترسی به اندیکاتور می توانید تماس بگیرید. من DY O RMبیش از 50% سود پس از تماس ما. برای دسترسی به نشانگر می توانید با من تماس بگیرید.
SevenStarBuySell
سیگنال شگفتانگیز در ملانیا: آیا ریزش قطعی است؟ (پیشبینی فوری)
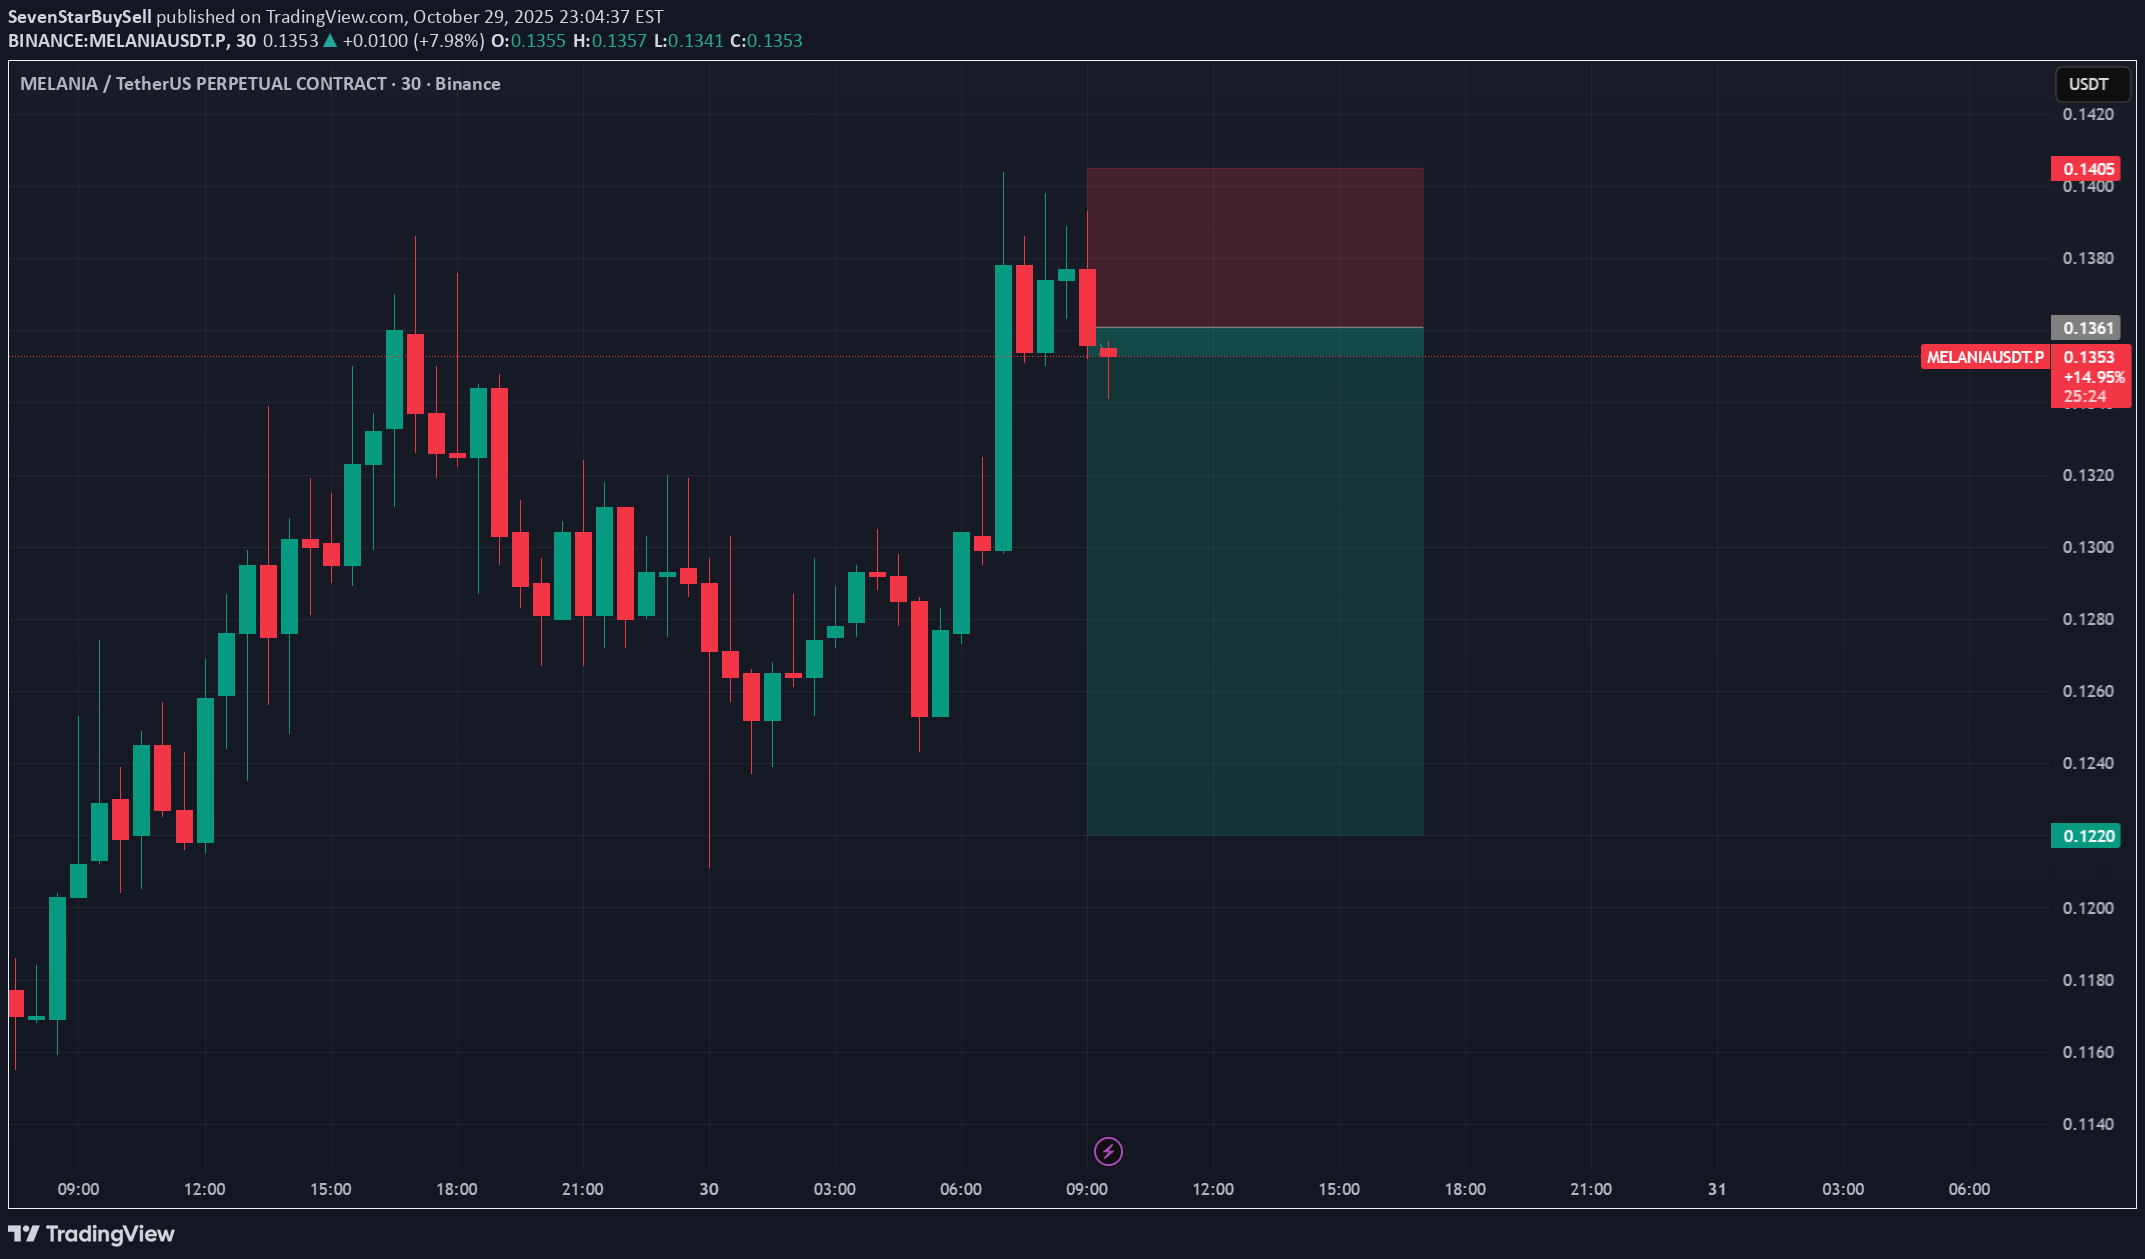
ما یک چاپ کوتاه در Melania با توجه به نشانگر 7 ستاره خود داریم. بیایید ببینیم چگونه بازی می کند. برای دسترسی زودتر به سیگنال های ما می توانید از نشانگر ما استفاده کنید. DYOR

MasterAnanda
Melania Meme · 877% Profits Potential & Technical Analysis

پس از 22 آوریل ، حجم معاملات شروع به بالا می رود ، hard. MelaniaUsdt نزول نهایی را آغاز می کند. 8-ژوئیه از پایین پایین آمدن استفاده می کند و یک بار دیگر حجم معاملات بالا می رود ، hard. واقعاً بالا می رود اما هنوز هم ، طرف مقابل. عمل صعودی بسیار قوی نیست ، اما حداقل روند نزولی از بین رفته است. دیروز ، 25 آگوست ؛ MelaniaUsdt در مقایسه با ماه ژوئیه کمترین میزان بالاتر را تولید می کند و باز هم حجم معاملات دوست و خواننده من شروع به بالا رفتن می کند. واقعا قوی ما برای یک موج جدید صعودی آماده هستیم. MelaniaUSDT امروز در بازه زمانی روزانه بالاتر از EMA8 و EMA34 حرکت می کند. این تنظیم نمودار می تواند به نتایج بسیار خوبی منجر شود. این دقیقاً همان چیزی است که ما دوست داریم در یک نمودار پیدا کنیم. اولین چیز قیمت پایین است ، اقدامی که در نزدیکی پشتیبانی اتفاق می افتد. این در اینجا مثبت است و ما کمتری داریم. ما نه تنها قیمت های پایین را می بلکه می سیگنال های بازیابی ، سیگنال های معکوس و سیگنال های تأیید را ببینیم. »سیگنال بازیابی پایین تر است. سیگنال معکوس move بالاتر از میانگین های متحرک است و سیگنال تأیید حجم در حال افزایش است. این یک ترکیب قوی است. یک موج صعودی با استحکام متوسط می تواند برای پتانسیل سود 487 ٪ خوب به هدف 1.26 دلار برسد. melaniausdt به راحتی می تواند بالاتر برود. می توانید در نمودار هدف A با 2.10 دلار برای 877 ٪ توجه کنید. جایی برای اطلاعات بیشتر وجود دارد ، این فقط میان مدت است. من فقط بخشی از نمودار را نشان می دهم. namaste

Crypto-by-PRIME
Melania / USDT : Buy every dip

MELANIA/USDT با موفقیت از خط روند نزولی عبور کرده و این شکست را تایید می کند. این تغییر نشان دهنده a حرکت صعودی است و قیمت اکنون در حال هدف قرار دادن هدف بعدی در 0.40 دلار است. این شکست نشان دهنده a تغییر در احساسات بازار است و اگر قیمت همچنان بالاتر از این سطح باقی بماند، می توانیم movement صعودی بیشتری را شاهد باشیم. با توسعه این روند، از مدیریت ریسک مناسب اطمینان حاصل کنید.

SpartaBTC
MELANIA Main Trend. Memes with high hype and risk. July 17, 2025
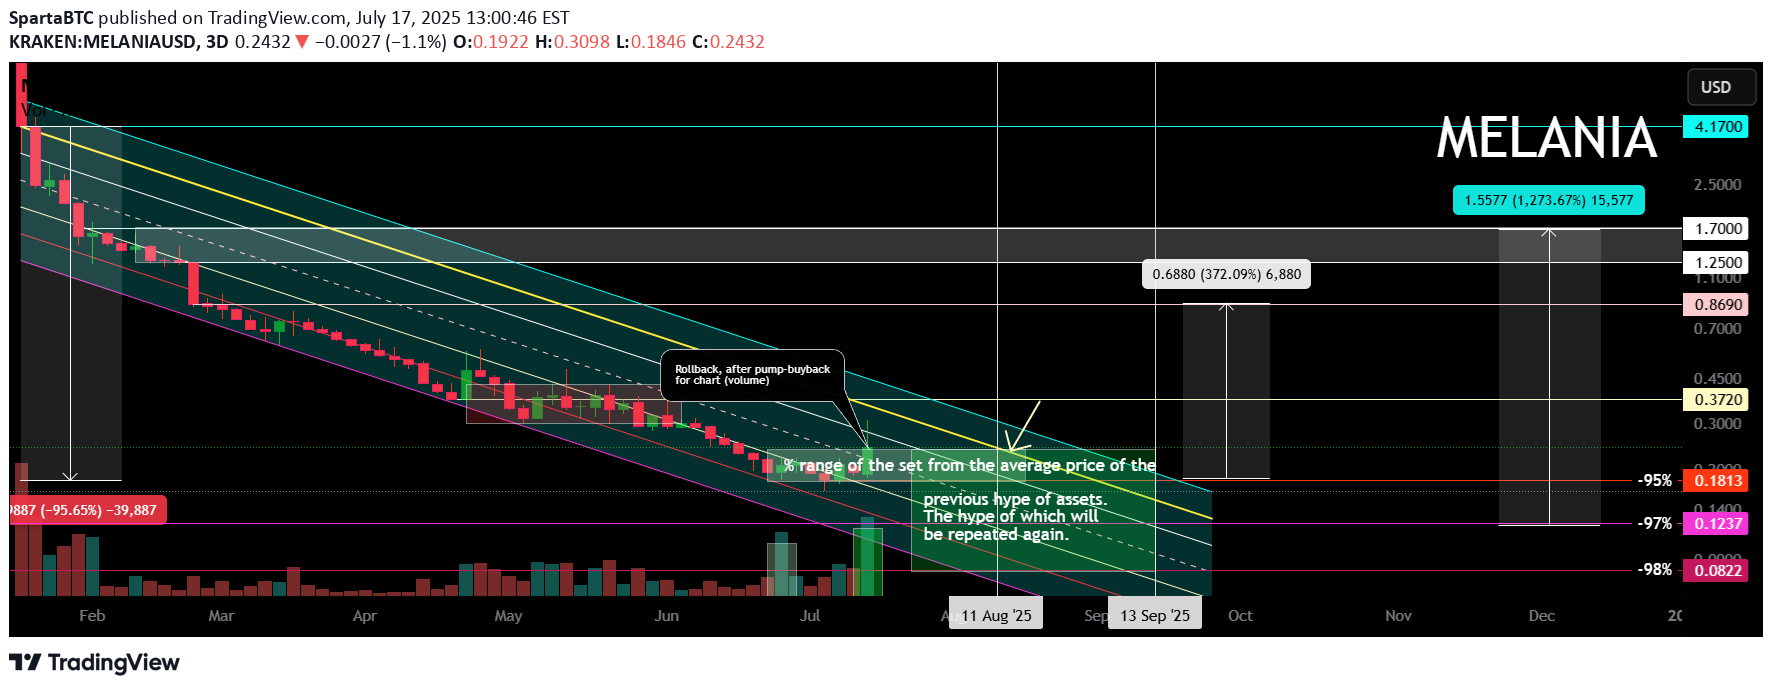
روند اصلی بازه زمانی 3 روز (کمتر لازم نیست). سطوح مشروط (مناطق نزدیک آنها) و درصد کاهش از حداکثر را نشان داد (توجه داشته باشید، من از منطقه ای که خرده فروشی اصلی "سرمایه گذاران متاثر" شروع به اتصال کرد، نشان دادم، یعنی حداکثر بسیار کمتر از نمودار است). توجه داشته باشید که اکنون یک حجم مشروط بزرگ "ورود" می شود، در نمودار قیمت نمایش داده می شود (این مهم است)، فشار جانبی شروع شده است. تکانه محلی و عقبگرد اکنون در حال حاضر هستند. همچنین درصد زیادی (عمدا) برای جهت گیری، از حداقل تا بیشینه مناطق نشان داد. در چنین دارایی های hype، به عنوان یک قاعده، دارایی میان مدت - بلند مدت (خرید شده در منطقه مناسب) درآمد قابل توجهی را نشان می دهد. همه مناطق سطح، به دلیل نقدینگی، مشروط هستند، اما قیمت به احتمال زیاد پس از شکست روند نزولی در این محدوده، یک فصل دیگر alt (که بسیاری به دلیل تجزیه آهسته نظرات، اخبار و اهداف نامناسب خود متوجه آن نمیشوند، "بازی" شد. در مورد من، بالاتر از این درصد عظیم (منطقه مقاومت، یا تا 0.869، برای اینکه زمان را هدر ندهید)، باید از شر این میم خلاص شوید، یا درصد آن از موقعیت قبلی باید حداقل باشد (5-10٪). مناطق hype وجود دارد، مناطقی با سود بالقوه وجود دارد (هیپ محو، علاقه، و درصد زیادی از حداکثر). در چنین دارایی های "معاملات دستی"، جایی که ارز دیجیتال هیچ ارزشی ندارد، همیشه کم کم فروخته می شود (بسیاری این را نمی فهمند)، اما برای فروش، گاهی اوقات باید علاقه ایجاد کنید، و "امید" را به "سرمایه گذاران" فریب خورده قبلی که می حداقل با ضرر از آن خارج شوند (بعید است اتفاق بیفتد) ایجاد کنید. در زمان مناسب، 1-2 توییت - اظهارات "قدرت ها" - به دلیل نقدینگی کم با درصد زیادی منتشر می شود. در چنین ارزهای دیجیتال، نیازی به حدس زدن "پایین" یا حداکثر نیست. قیمت گذاری در اینجا متفاوت شکل می گیرد، زیرا هیچ عرضه/تقاضای واقعی، سودمندی وجود ندارد، بلکه فقط روانشناسی و "به جک پات" معتادان به قمار وجود دارد. باهوش تر باش چنین دارایی هایی را متنوع کنید، ریسک را از قبل توزیع کنید. خرید/فروش را طبق برنامه و بدون احساسات انجام دهید. وقتی قیمت بالا میرود، فکر میکنید خیلی بالاتر میرود، اما حتی اگر بالا میرود، باید حجم مشخصی را در مناطق برنامهریزیشده مشخصی بفروشید، بدون هیچگونه احساسات یا احساس سود از دست رفته. به همین ترتیب، وقتی قیمت پایین میآید، مردم از ترس به حرکت در میآیند و از خرید خودداری میکنند و اینها احتمالاً حداقلهای ترس بودهاند. میانگین قیمت مجموعه و ریست مهم است. نیازی به حداقل و حداکثر نیست. در اقدامات و برنامه های خود صبور و پایدار باشید. 21 07 2025 بسیار محلی "پمپ همسر ترامپ". 19 نوامبر 2025 قیمت در منطقه کاپیتولاسیون (تحت کانال انباشت شرطی، به این معنی که آنها همیشه "بدون بارگیری دفترچه سفارش" را می فروشند)، با بازخرید حجم زیادی است. برای ادامه فروش، باید علاقه ایجاد کنید و امید را بازگردانید، یعنی نوسانات و پمپاژها. شاید خروجی از این منطقه. اگر این اتفاق بیفتد، به عنوان یک قاعده، با چنین دارایی هایی با چنین نقدینگی کم و ارتباط عظیم با ترافیک "پول احمقانه" (میلیون ها و صدها هزار دنبال کننده توییتر)، قیمت درصد زیادی کاهش می یابد، اما نمودار همچنان تقریباً از منطق پیروی می کند. قبلاً بارها در مورد نحوه پایبندی به مدیریت پول و استفاده از تاکتیکهای معاملاتی در چنین ارزهای دیجیتال useless تبلیغاتی نوشته شده است، بنابراین من خودم را تکرار نمیکنم. آنهایی که هوش دارند مثل همیشه شنید، آنهایی که ندارند.

TehLamboX
$MELANIA | Descending Channel Breakout Confirmed
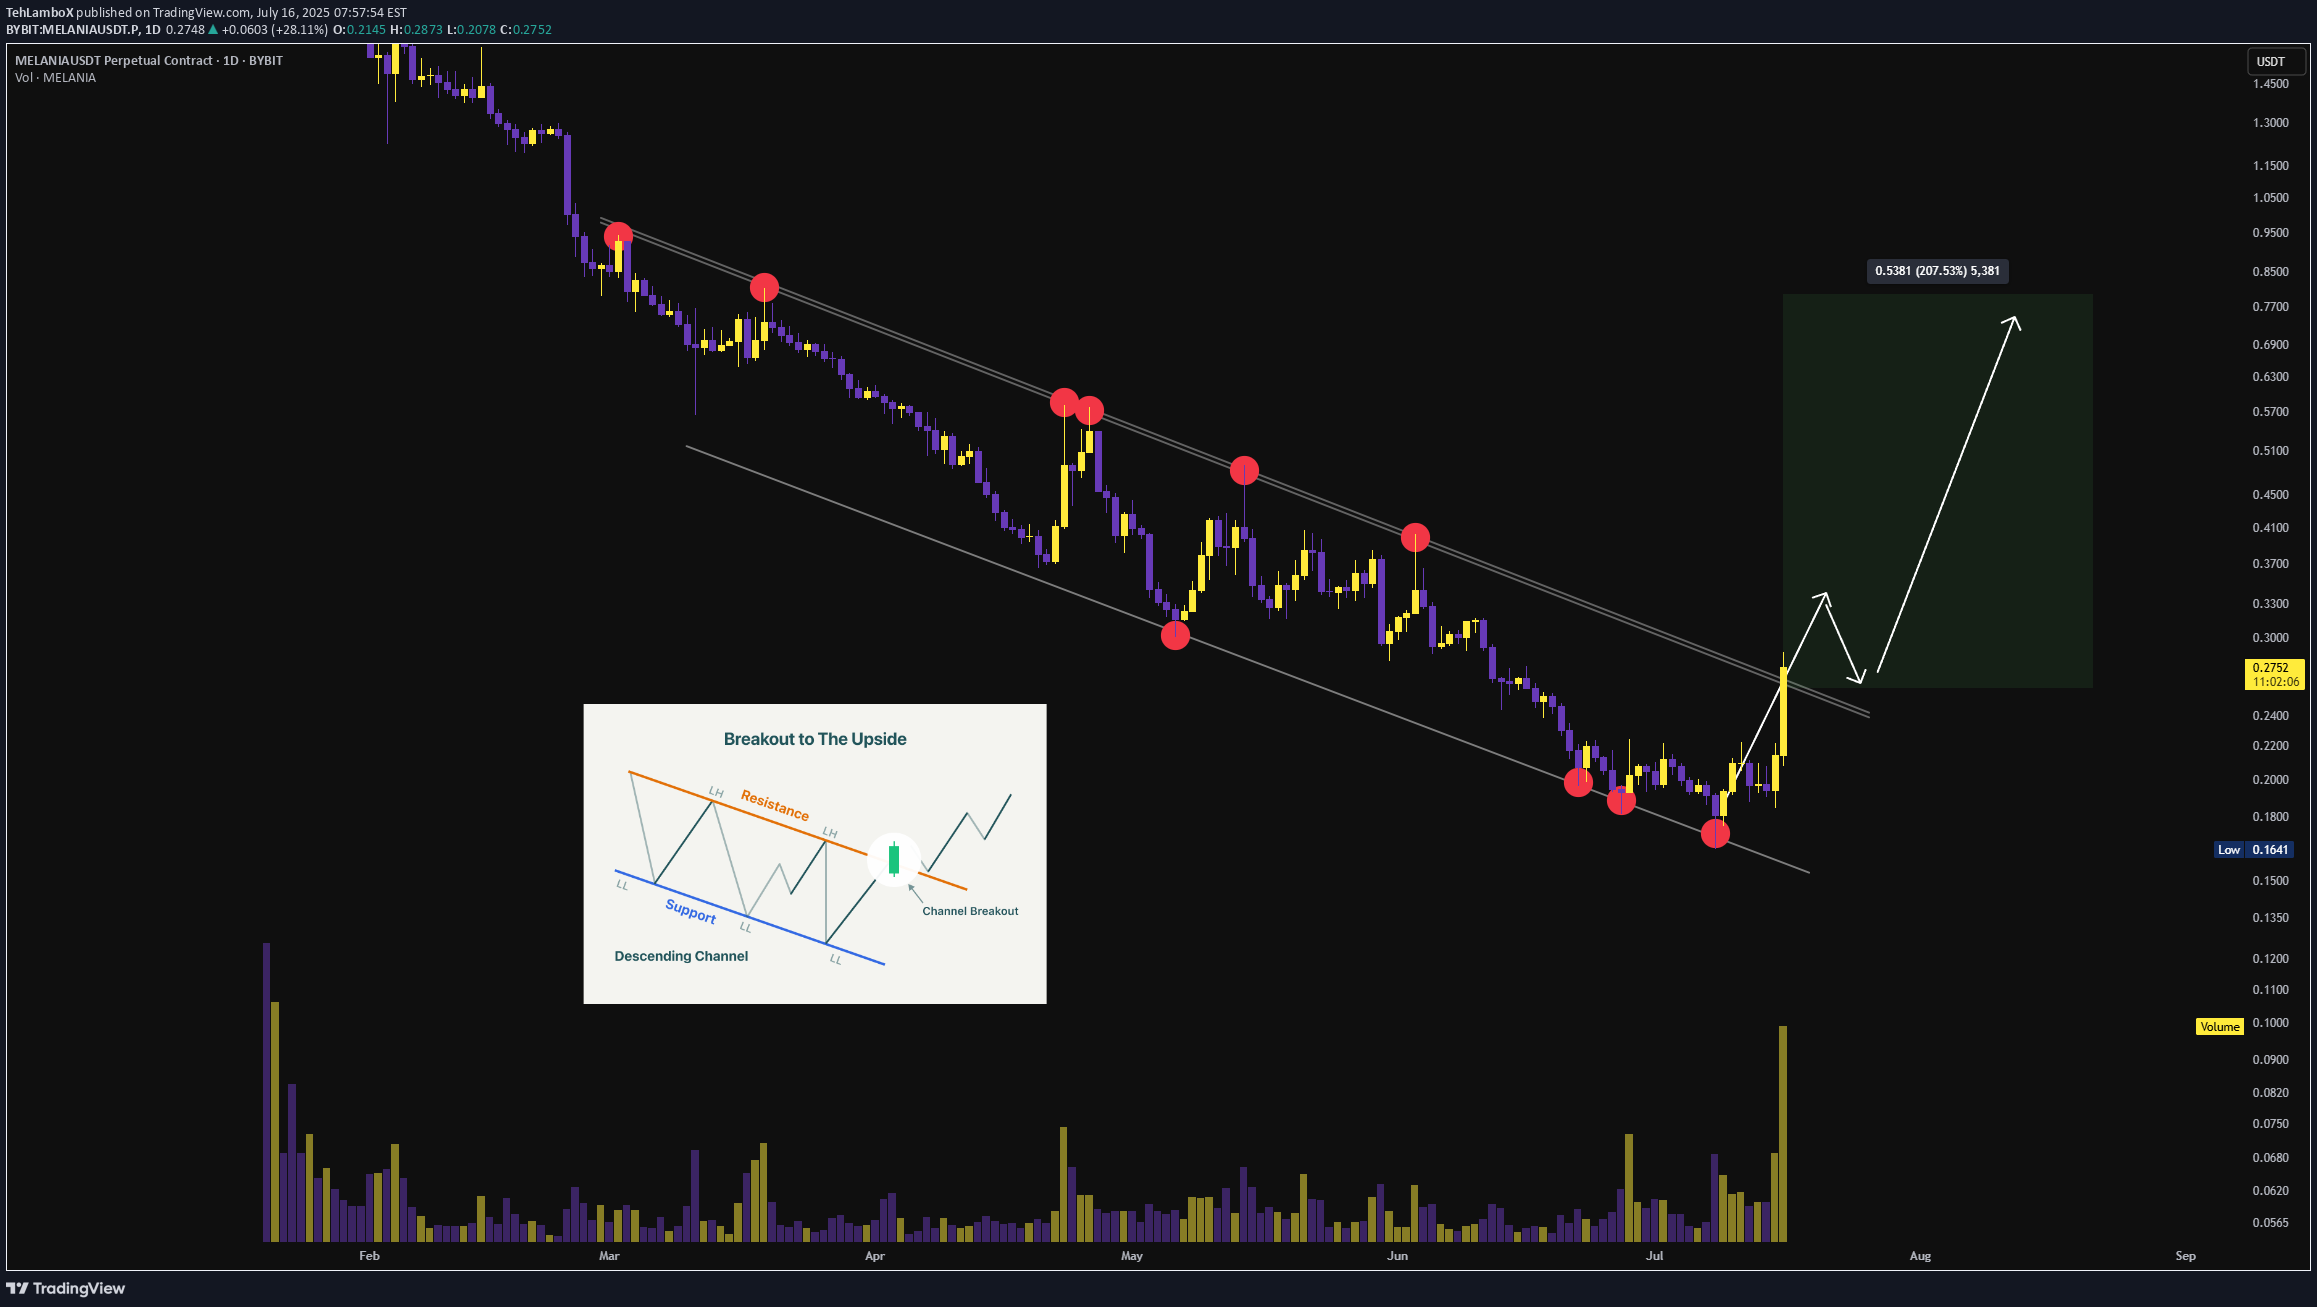
پس از ماه ها فشردگی در یک کانال نزولی معتبر، #MELANIA با حجم بالایی از مقاومت کانال عبور کرده است - که ساختار بازگشتی را با گسترش قوی مومنتوم تأیید می کند. 🔍 تأییدیه فنی: • خروج از مقاومت روند نزولی طولانی مدت • چندین برخورد تمیز با مرزهای کانال (ساختار معتبر) • کندل پوششی صعودی با تأیید حجمی • حرکت قیمت نشان دهنده احتمال آزمایش مجدد قبل از ادامه روند است 🎯 اهداف صعودی بر اساس حرکت اندازه گیری شده و پیش بینی های فیبوناچی: → 0.40 دلار (منطقه محوری ساختاری) → 0.50 دلار (تلاقی عرضه) → 0.80 دلار (پیش بینی ارتفاع کانال) مراقب آزمایش مجدد صعودی منطقه شکست باشید تا ادامه روند را تأیید کند.
سلب مسئولیت
هر محتوا و مطالب مندرج در سایت و کانالهای رسمی ارتباطی سهمتو، جمعبندی نظرات و تحلیلهای شخصی و غیر تعهد آور بوده و هیچگونه توصیهای مبنی بر خرید، فروش، ورود و یا خروج از بازارهای مالی نمی باشد. همچنین کلیه اخبار و تحلیلهای مندرج در سایت و کانالها، صرفا بازنشر اطلاعات از منابع رسمی و غیر رسمی داخلی و خارجی است و بدیهی است استفاده کنندگان محتوای مذکور، مسئول پیگیری و حصول اطمینان از اصالت و درستی مطالب هستند. از این رو ضمن سلب مسئولیت اعلام میدارد مسئولیت هرنوع تصمیم گیری و اقدام و سود و زیان احتمالی در بازار سرمایه و ارز دیجیتال، با شخص معامله گر است.