
without_worries
@t_without_worries

ما هو الشيء الذي ننصحك بشراءه من المواد الغذائية؟
سابق في الشراء
پیام های تریدر
مرشح
without_worries
Bitcoin Gaussian channel vs Strategy's leveraged long flywheel
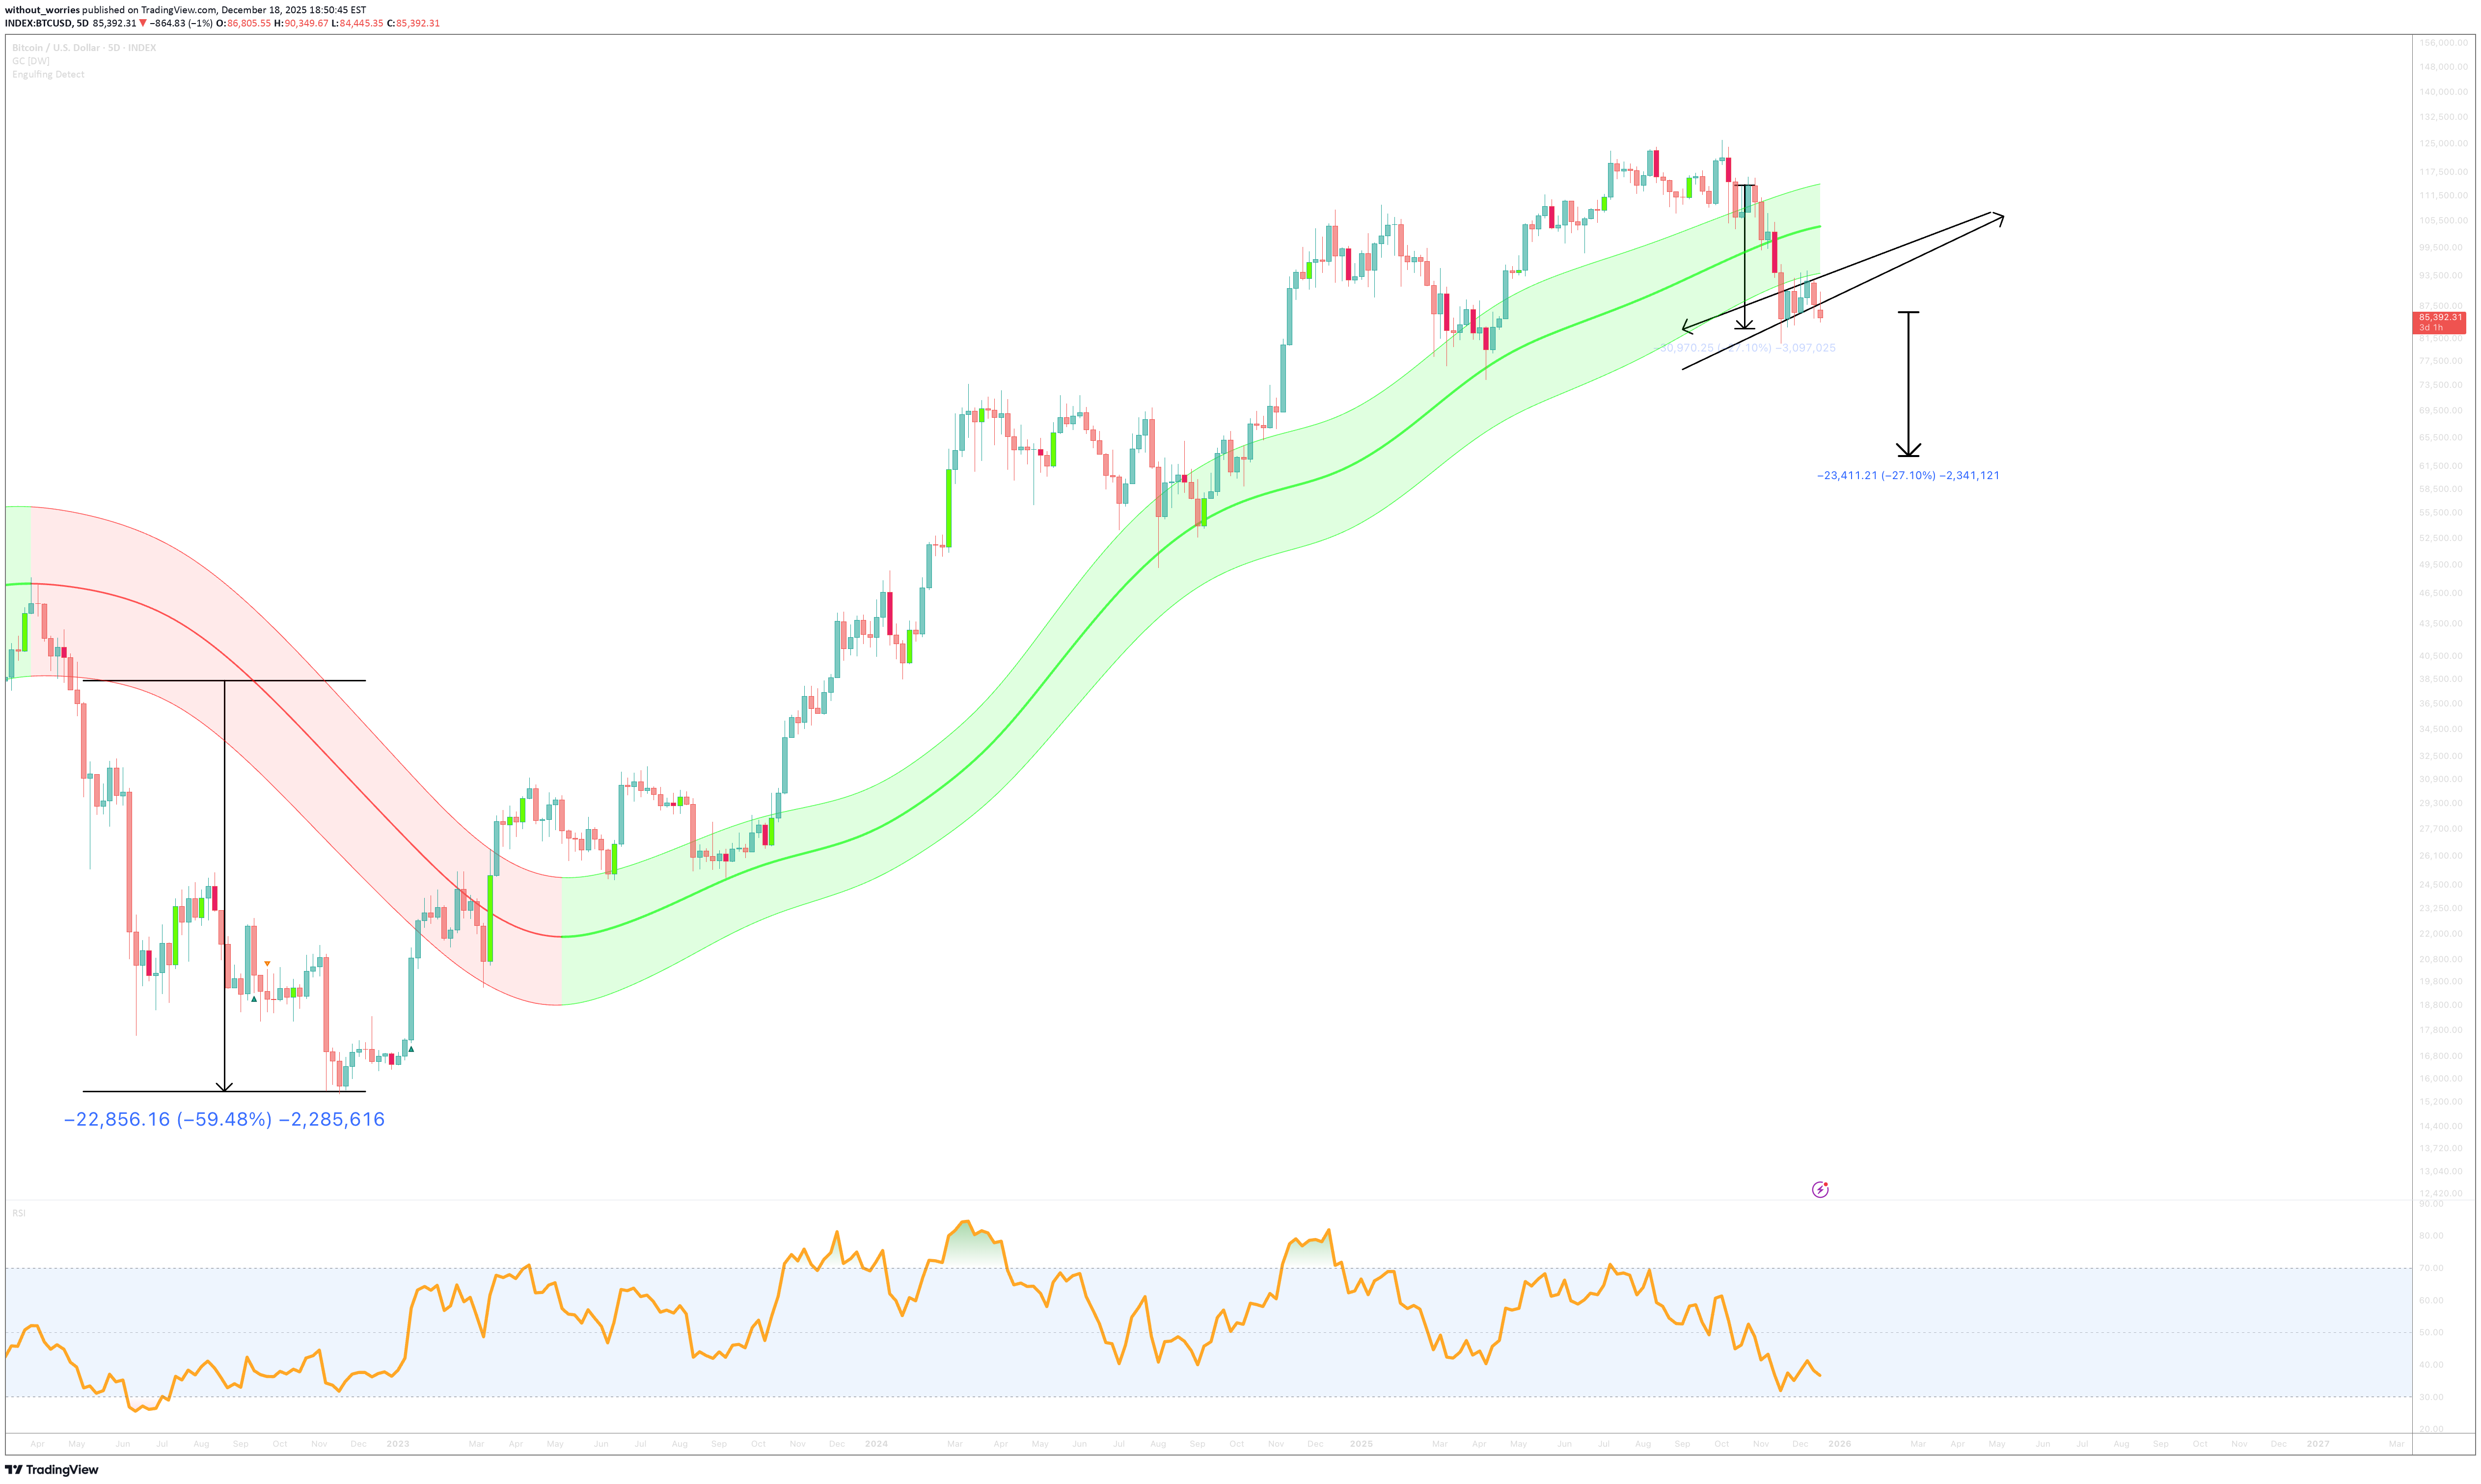
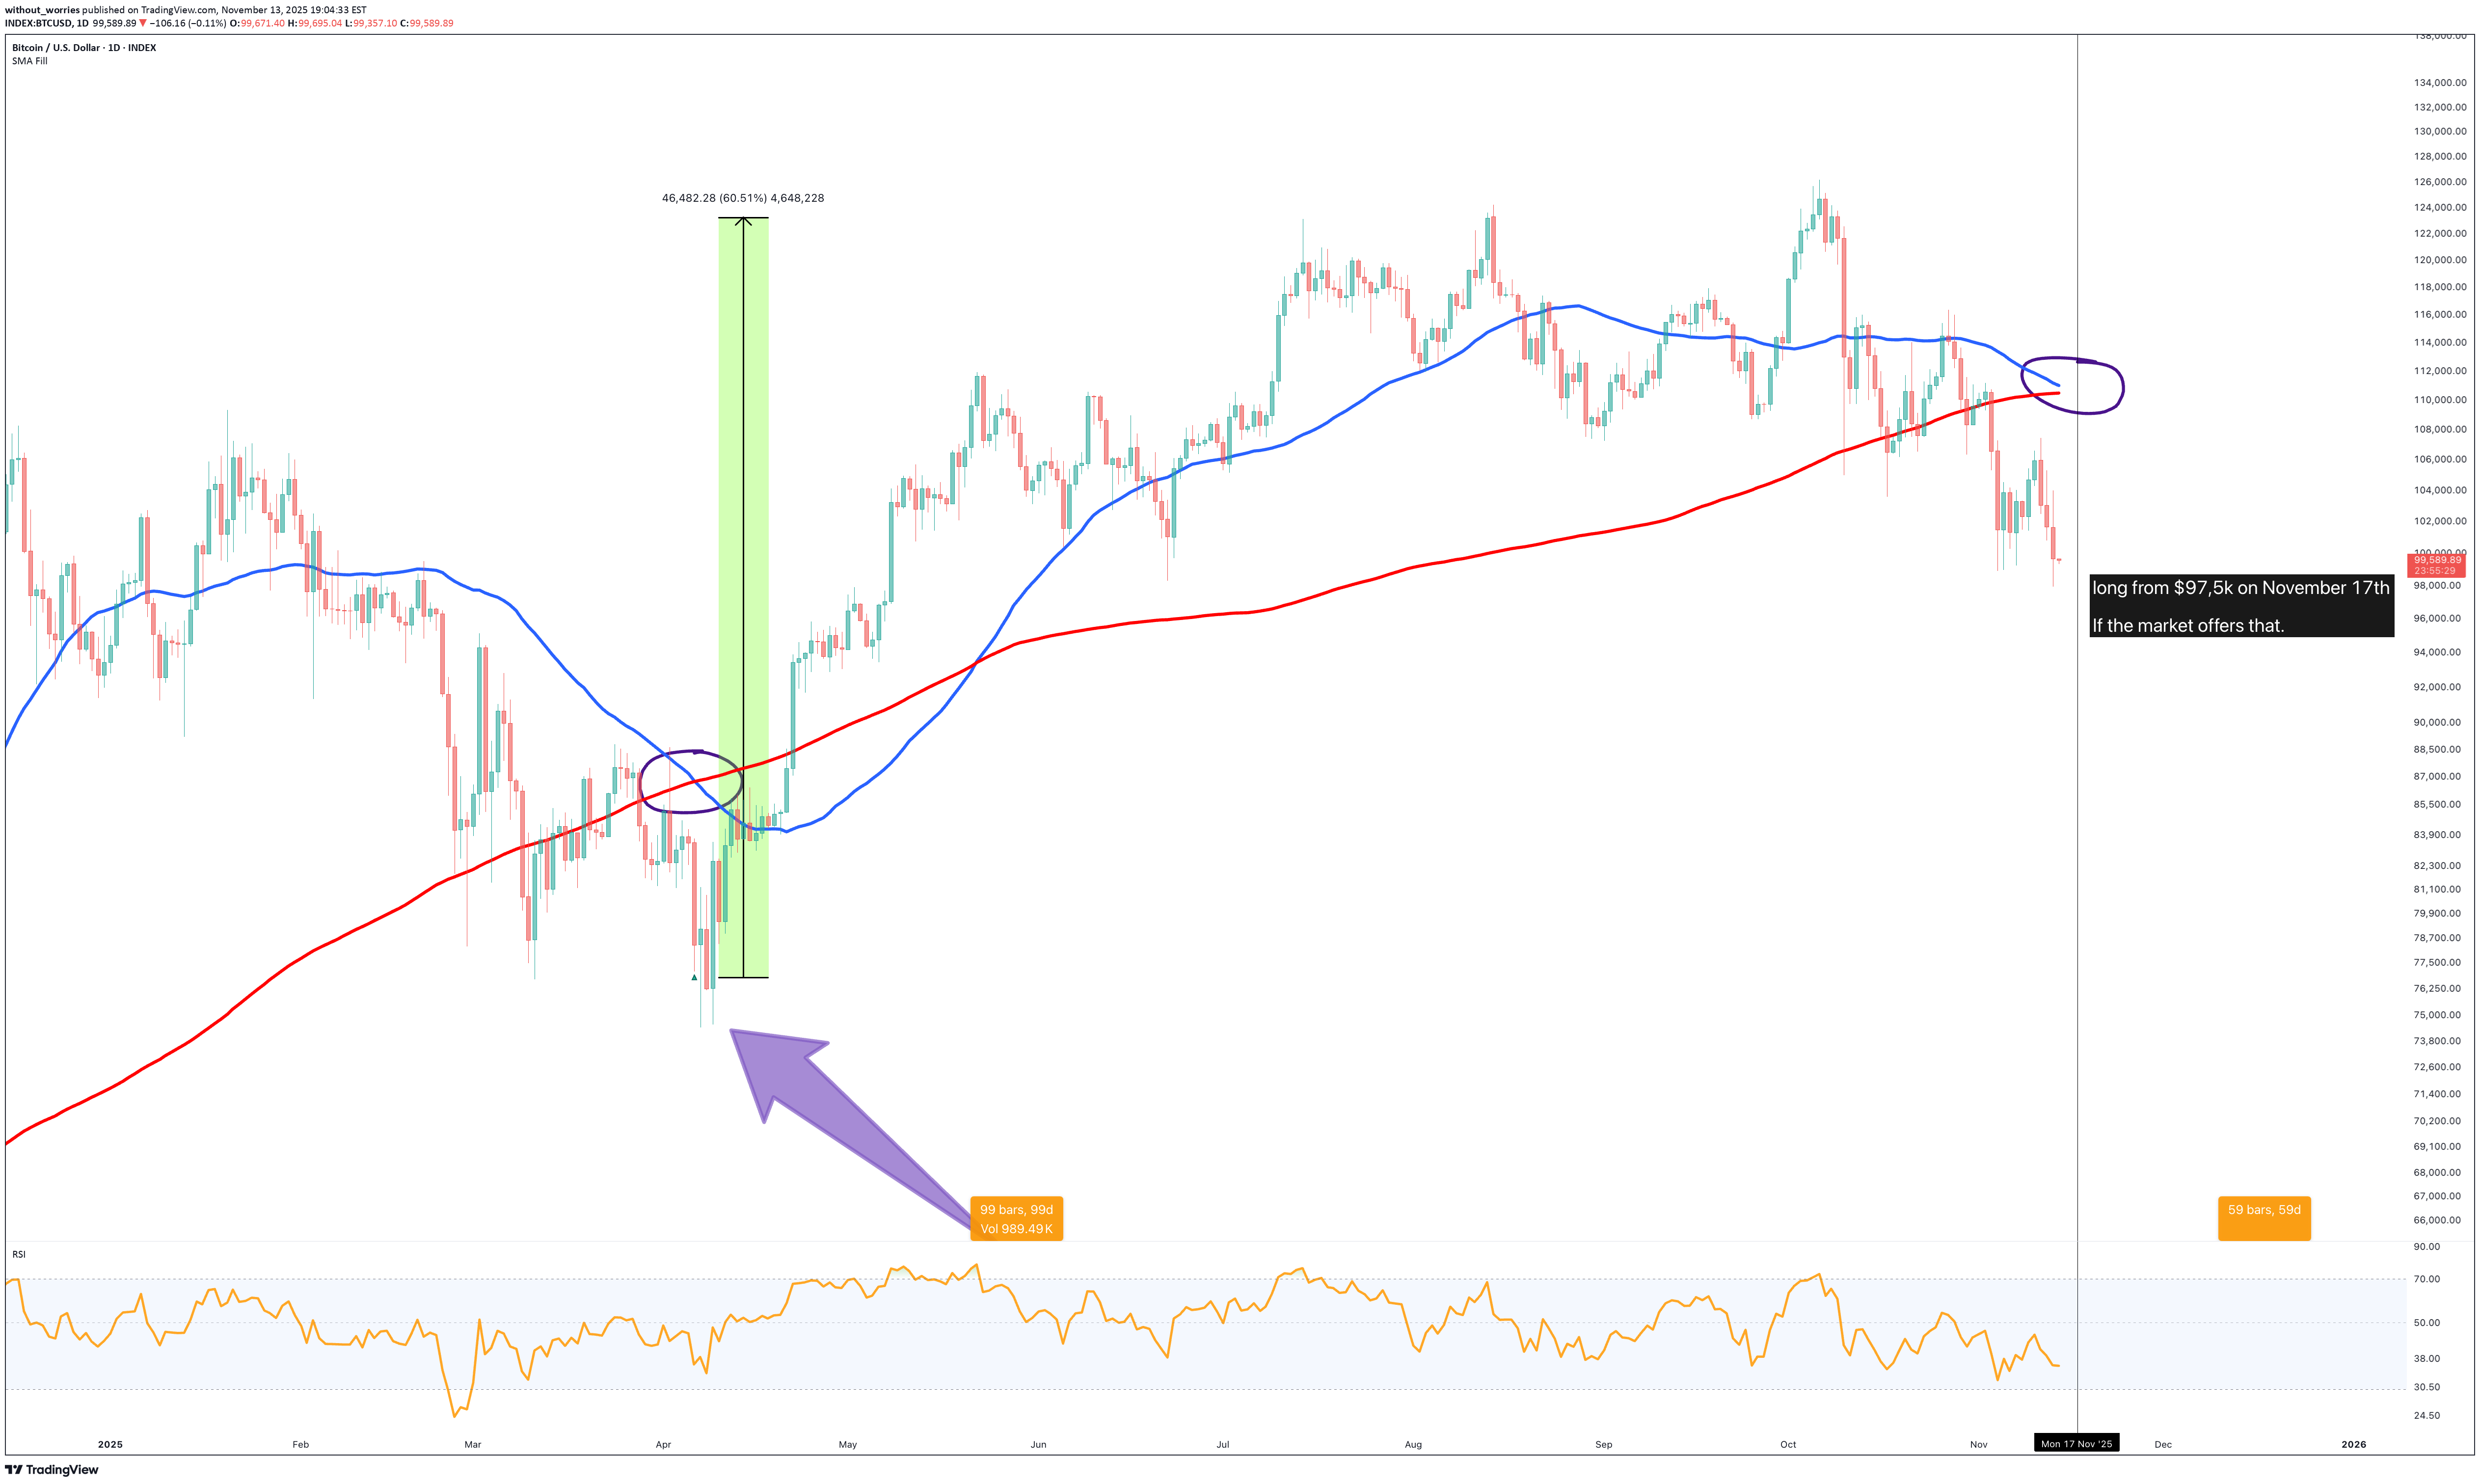
For most of the bull run price rode the Gaussian channel like a moving runway: pullbacks tagged the mid-band, buyers defended, trend continued. The last swing changed that. We got a clean displacement down through the 5 day channel and now BTC is compressing under/inside the band in what resembles a rising wedge attempt. That’s not “game over” by itself, but it is the same kind of “regime change” that historically turns smooth uptrends into ugly, time wasting corrections. The key observation When BTC is above the Gaussian channel and the slope is positive (green), risk markets treat the move like it’s “funded.” When BTC closes below the channel, the market starts acting like credit just tightened. That matters because Strategy’s risk isn’t a magical liquidation button. It’s a financing loop. BTC trending up? Then MSTR tends to trade rich, capital raises are easier, more BTC bought and the flywheel spins faster. So much win. BTC trend breaks? MSTR multiple compresses, capital raises get expensive, obligations become louder, flywheel develops square edges. So BTC closing below the channel is the chart equivalent of Strategy hearing the banker clear his throat. 5 day historical closes below the Gaussian channel Price structure: what the wedge is really saying Right now, the market is doing the classic “I’ll bounce… but not with conviction” behaviour. You must have noticed every time price action climbs surely and slowly it is hammered down in one swift 10 minute $5-10k sell off. That's not retail. That's someone who knows the fan and back of a dogs bum after a huge curry are about to meet. 50-60% corrections are typical once Gaussian channel resistance is confirmed. That's in addition to the already made 30% correction from $126k. A confirmation takes price action down to the $36k area. Why this matters specifically for Strategy Think of Strategy as a trader who doesn’t get auto liquidated, but does have: scheduled obligations (interest + preferred dividends), a reputation trade (mNAV / “BTC proxy premium”), and a dependency on market windows to refinance or raise. When BTC is trending cleanly, the market ignores the obligations. When BTC breaks trend, the obligations become the plot. So the risk isn’t “Strategy must sell tomorrow.” The risk is: BTC drawdown + MSTR premium compression = less flexibility = fewer “nice options” = higher chance they choose an “ugly option” (dilution, costly financing, or BTC sales) In other words: a BTC regime flip turns Strategy’s bold bet into a test of liquidity optics. Scenarios to watch 1) Bear continuation (base case if price stays under the channel) Price fails to reclaim the Gaussian channel (especially the mid/upper band). Wedge support breaks, downside expansion develops. Target zone: low $60Ks Narrative match: Strategy’s flywheel slows, market starts pricing the balance sheet like it matters again. 2) Bull save BTC reclaims the channel and holds it (not a wick, a candle body close and follow through) with a break above wedge resistance and converts it into support. Then the “forced selling” fear premium fades fast. Narrative match: financing window reopens, reflexivity returns. Closing thoughts The Gaussian channel isn't a crystal ball; it's a mood monitor for the market. And right now, it's showing a shift from "euphoric greed" to "nervous sweating." Price has been kicked out of its smooth uptrend and is now flopping around below the channel like a fish on the dock. That's not a healthy pullback; it's a regime change. For Michael Saylor and MicroStrategy (MSTR), this isn't about a magic liquidation threshold. It's about oxygen. Their entire leveraged long flywheel requires the high-octane fuel of a bullish trend. BTC closing below this channel is the equivalent of the engine starting to sputter. The obligations don't disappear; they just get a lot louder when the music stops. Ww Disclaimer =================================================================== Let's be brutally honest here. This is an observation, not an instruction manual. I'm connecting dots on a chart and speculating about corporate finance like an armchair quarterback. I am not a registered financial advisor, and this is absolutely not financial advice. Trading and investing, especially in volatile assets like Bitcoin and related equities (like MSTR), is a fantastic way to incinerate capital. You can and likely will lose money. The models (Gaussian channels, wedges) are just pretty stories we tell about past price movements. The market has a PhD in humbling overconfident analysts. MicroStrategy is a complex entity with liabilities, strategies, and management decisions that are entirely opaque to us on the outside. This flywheel theory is a simplification. The company could have plans, hedges, or lines of credit we know nothing about. Or it could be closer to the edge than anyone realises. We. Don't. Know. Do your own research! Now, if you'll excuse me, I need to go check if my own portfolio is obeying its Gaussian channels. Spoiler: it is, awesome.
without_worries
S&P 500 to 10,000 inside the next 4 years - December 2025
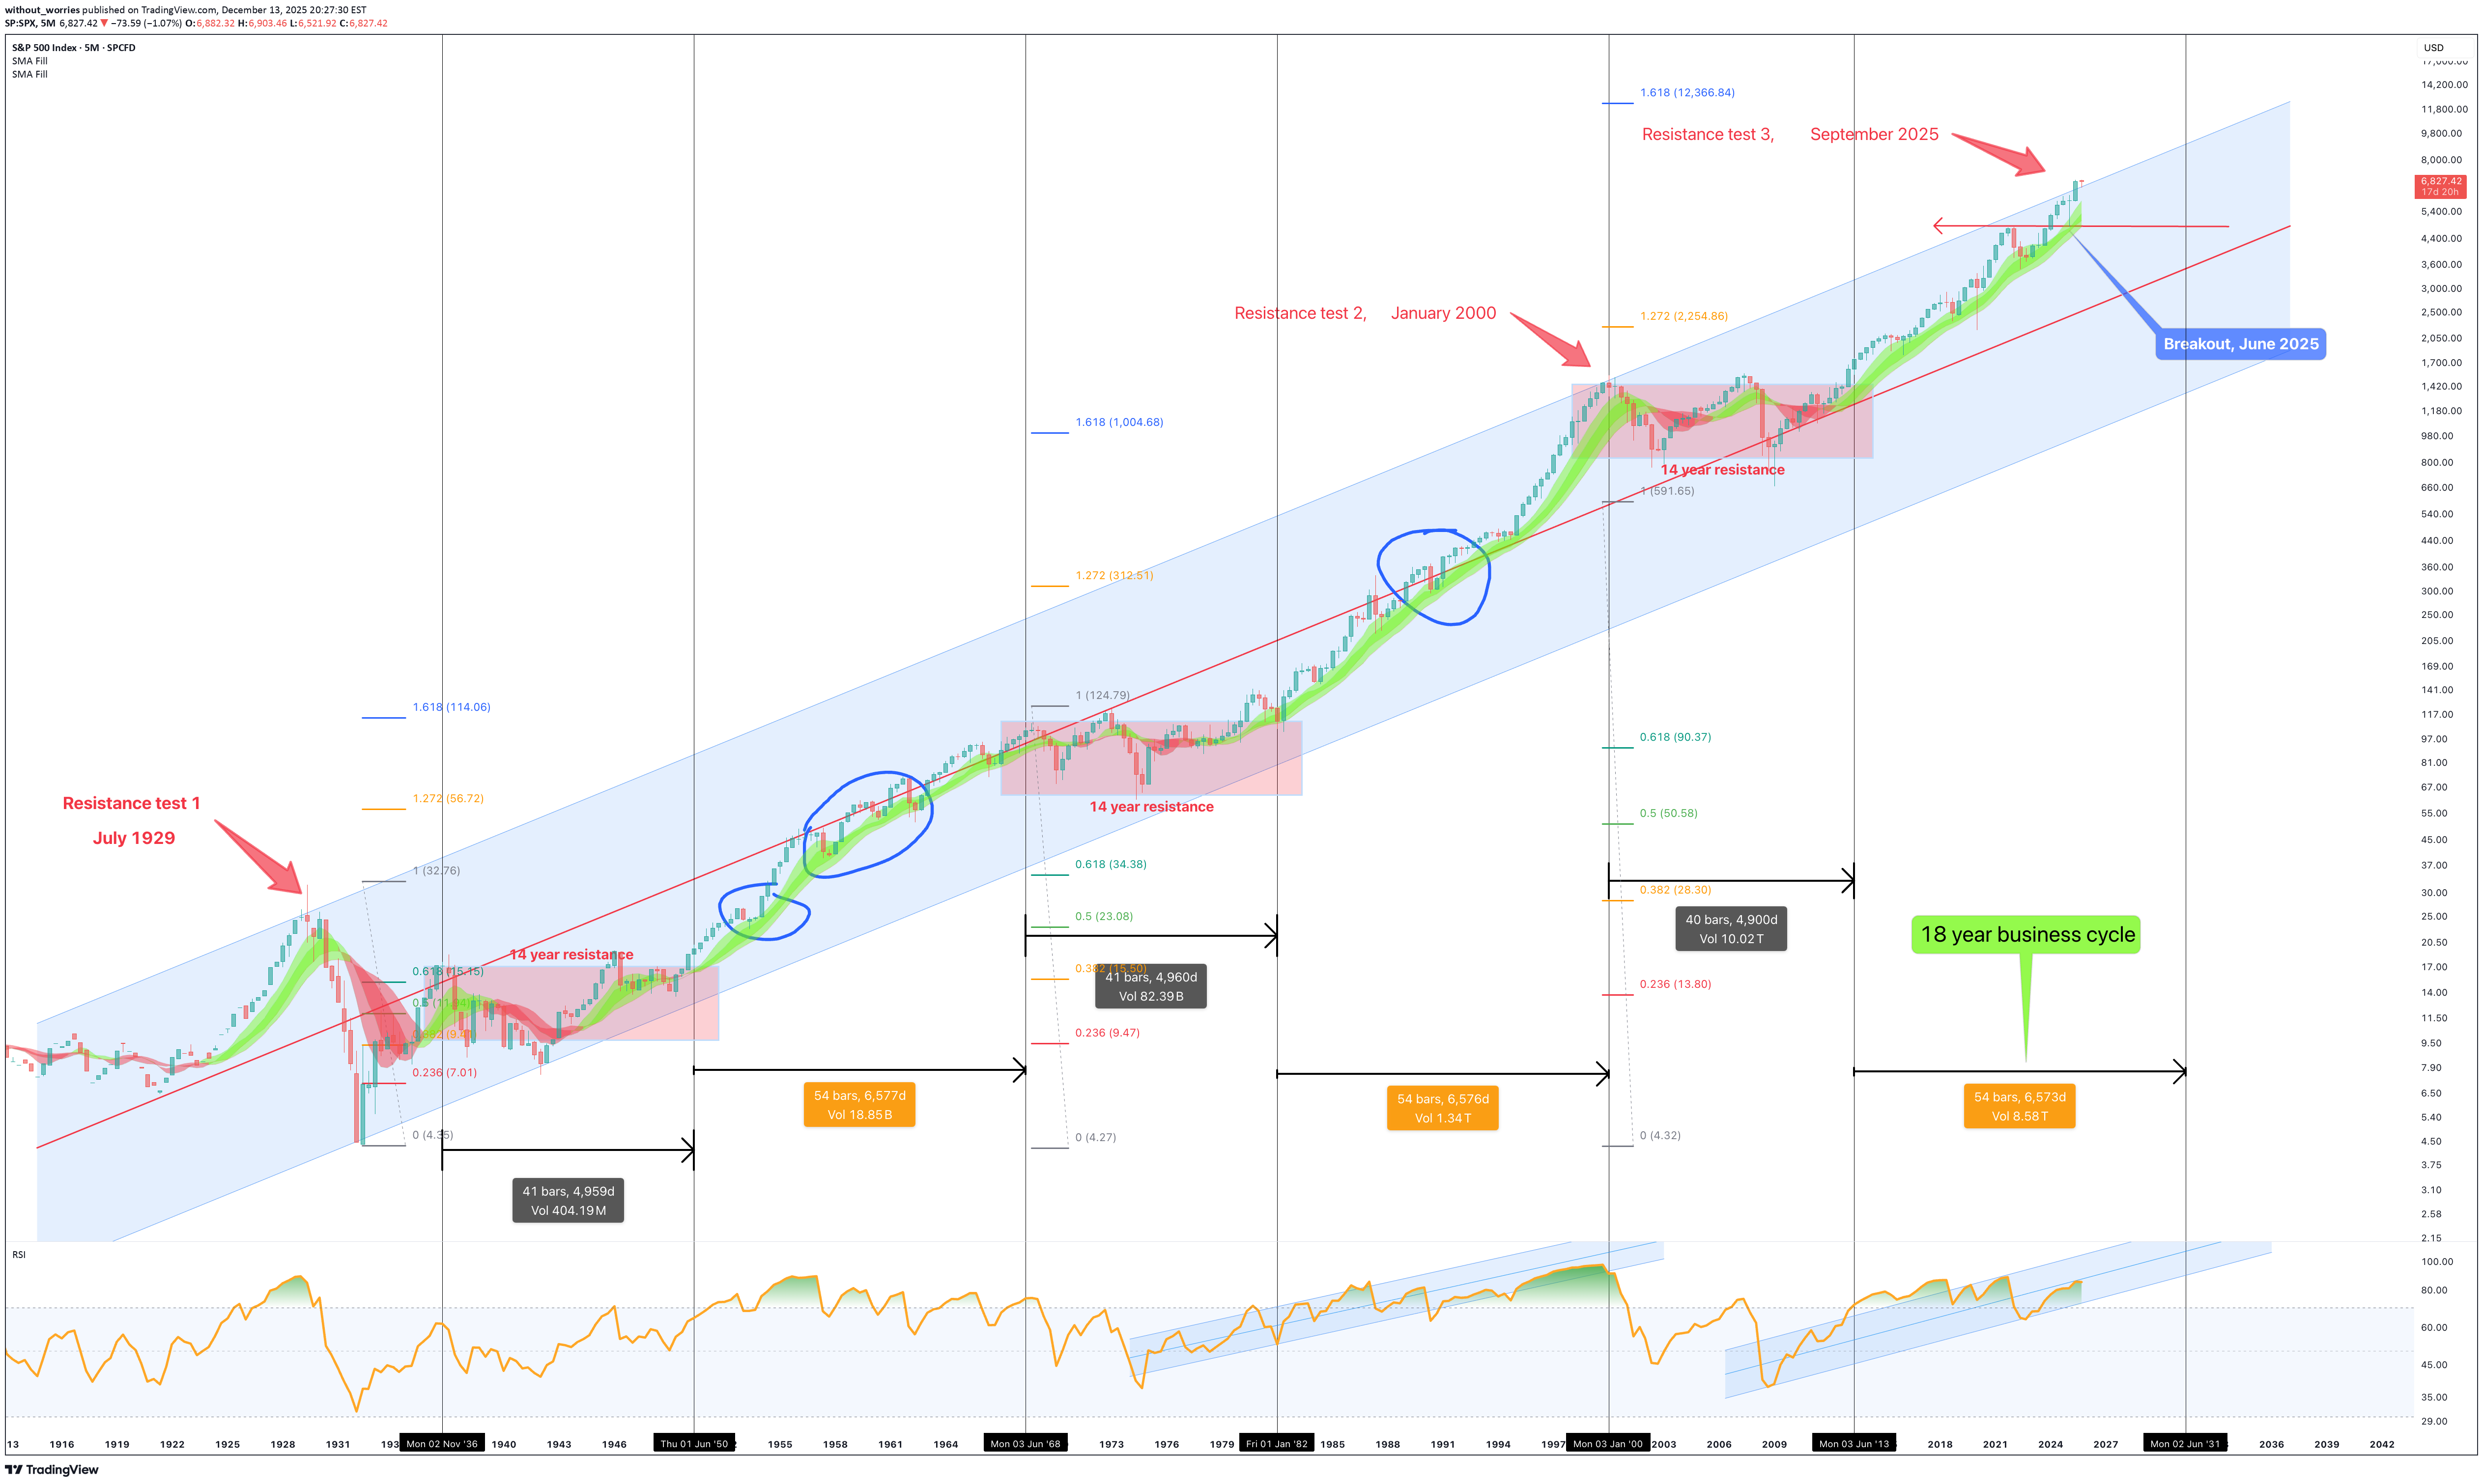
** This is an outlook for the next 3 to 4 years ** ** The bull market is not yet done, sorry bears ** Yes, read that right, 10,000 or 10k for the S&P 500. The markets shall continue to grind higher during this 10-year bear market everyone is talking about. Upwards and onwards for investors as unemployment numbers rise, graduates question the mysterious reason why their unable to land employment on the degree they just dropped $150k on; inflation runs out of control, working people struggle, the market is just not going to care. The best opportunities come at a time when you don’t have the money to invest, have you ever noticed that? The story so far A crash is coming, have you heard? Our ears are ringing out 24/7 with noise on the most predictable crash since computer user Dave reports an uninterrupted hour of use on Windows Vista. News of an AI bubble the size of Jupiter that is about to collapse in on itself and create a new star only seem to gather pace. The same finance prophets on Youtube with a hoodie in a rented flat forecasting which way the FED will move on rates. A 40 minute video to deliver a single sentence titled: “EMERGENCY VIDEO: Market collapse (MUST WATCH before tomorrow!!)”, 10 seconds in “And Today’s video is sponsored by…. ” and if it’s not a sponsorship, it’s a course they’re trying shill. Many story tellers weren’t yet out of school during the dom com crash, but they’re now they’re experts of it. Finally we have “a recession is coming” brigade. Of course it is. There’s always a recession coming. It’s like winter in Game of Thrones, they’ve been warning us for ages. Haven’t you heard? Recessions are now cancelled thanks to money printing and low interest rates. Capitalism RIP, all hale zombie companies. In summary there’s no shortage of doom and gloom. Everyone is saying it. So what am I missing? Let’s break this down as painless as possible so as not to challenge waining attention spans. You’ll need a cuppa before reading this, for the people of the commonwealth, you know of what I speak. A proper builders brew. Take your time to digest this content, there's no rush (did I mention it's a 5 month candle chart?). If you’re serious about separating yourself from the media noise to the News on the chart, then you're in for a treat. It is proper headline material. When you’re done, you'll pinch yourself, did he just tell me all this for free? What’s in it for him? (Absolutely nothing). Tradingview might bump $100 my way like Xerxes bearing gifts, but in the end the content of this idea may radically change the way your view the market today. The contents: 1. Is the stock market in a bubble? 2. What about this 10 year bear market people are talking about? 3. A yield curve inversion printed, isn't a monster recession is due? Is the stock market in a bubble? No. A handful of stocks are. The so-called “magnificent seven” stocks that make up about 40% of the market, Yeah, they’re in a bubble. No dispute from me there on that. It has never been riskier to be an index only fund investor. Especially if you're close to retirement. Now I’m not about to carve a new set of stone tablets explaining why, if you want the full sermon, that’s on my website. Here’s the short version: a tiny bunch of tech darlings are bending the whole market out of shape. If you’re only invested in index funds, then you’re basically strapped to the front of the roller coaster hoping the bolts hold should those seven stocks decide to puke 20% in a week. Suffice to say, a handful of stocks, tech stocks, are distorting the entire market. Index only investors are exposed to a greater risk than at any point in those past 20 years should the magnificent seven decide to sell off quickly. But what if they don’t? What if they just sell off slowly? Which is my thesis here. In the final 12 months leading up to the dot com crash, during the 1999-2000 period, the Nasdaq returned 160%. RSI was at 97 as shown on the 3 month chart below. Now that’s a bubble. In the past twelve months the Nasdaq has returned 20%. That’s not a bubble, that’s just a decent year. Above average, nice not insane. Yet people are acting like it’s 1999 all over again. A similar story for the S&P 500 as shown on the 3 month chart below. In the five years leading up to the crashes of 1929 and 2000 the market saw a return of 230% with RSI at 94 and 96, respectively. Today the market has returned 60% over the last 5 years with RSI @ 74. Adjusted for recent US inflation, and it’s roughly 30% real return! The two periods often recited the most by doomsayers, 1929 and 2000, exhibit conditions not found in today’s market. Fact. What about this 10 year bear market people are talking about? Warren Buffet, perhaps the most famous investor in the world, has amassed a cash pile the size of the size of Fort Knox. Legendary short seller Michael Burry is quoted as having Puts on the overbought tech stocks, that’s fair. The masses have translated all this as a short position on the stock market. It seems everyone is preparing for Armageddon. My question, why are the masses so convinced of a stock market crash? “Whenever you find yourself on the side of the majority, it is time to pause and reflect.” Mark Twain Let’s talk about the main 5 month chart above… There’s so many amazing things going on in this one chart, could spend hours talking about it. Will save that for Patrons, but the key points exist around support and resistance. You’ll remember the “ Bitcoin in multi year collapse back to $1k - December 2025 ” publication? It is of no surprise to me the Bitcoin chart now indicates a macro inverse relationship to the S&P 490 (minus tech stocks). Bitcoin is a tech stock all but in name, it follows the tech stock assets like a lost puppy. If you strip away the blotted tech sector you realise we’re in for a bumper rally in the stock market in the coming years. This happens as a result of money flooding out of the blotted tech sector (that includes crypto). These sectors are about to crash straight through the floor towards middle earth. When the masses catch on that businesses are not finding value in AI tools beyond generating cat videos on Youtube, the bottom falls out of those bankrupt entities, with hundreds of billions of dollars looking for a new home. That’s when investors pivot to value . Sometimes I feel like I’m the only one with this information when I scan through the feeds, how is this not the most obvious trade of the decade? For the first time in 96 years the S&P 500 breaks out of resistance. Why is no one else talking about this? 2025 was the year it happened and yet not a whisper. The 1st resistance test occurred in July 1929. The 2nd in January 2000. The breakout occurred in the first half of 2025 and will be confirmed by January 1st, 2026 providing the index closes the year above 6530-6550 area. 12 trading days from now. The 18 year business cycle, roughly 6574 days (the orange boxes) is shown together with the black boxes representing the 10 year bear markets in-between (14 years until past resistance is broken - pink boxes). Should you not know, The 18 year business cycle, In modern market economies (especially the US and UK), they are repeated cycles where: Land & property prices rise for about 14 years Then there’s about 4 years of crisis, crash, and recovery Together that’s roughly an 18-year land / real-estate business cycle, a pattern that is argued to show up again and again. When we remove the darlings of the stock market you find the valuation for the S&P 490 suggests that the vast majority of the US market is currently priced near a level of Fair Value relative to GDP, provided that the current economic structure persists. The high majority of influencers and financial experts talk about the end of the business cycle, there’s even “how to prepare for the crash” videos. If we look left, it is clear, the 18 year business cycle is far from over. So why are you bearish? A yield curve inversion printed, isn't a monster recession is due? There is a general assumption that recessions mean bad things for the stock market. You’re thinking it right now aren’t you? “ Of course they are Ww - everything will crash in a recession! ” Listen…. you couldn’t be more wrong. Ready for some dazzle? This level of dazzle wins your Harvard scholarships when meritocracy isn’t an option for you. And it’s free, without the monstrous loan debt at the end. Can you believe that? What if I told you the stock market does not care about recessions? Let’s overlay every US recession on the same 5 month chart. The vertical grey areas. There has been 14 US recessions over the last 96 years. The majority, that is 9 of them, occurred during a bear market. The recessions that saw the largest drop in the stock market, 1929 and 2000, were known overbought bubble periods. We know that is not representative of the current market as discussed in the first section. Here is the dazzle. Focus on the recession during the business cycles. What do you notice? The recessions during business cycles (blue circles) never saw a stock market correction greater than 10%. In other word, utterly irrelevant. Conclusions Let’s land this gently, before someone hyperventilates into their keyboard. The S&P 500 is not in a bubble. A handful of stocks are and that distinction matters far more than most people are prepared to admit. Yes, the Magnificent Seven are stretched. Yes, AI enthusiasm has reached “my toaster is sentient” levels. But the rest of the market? Strip away the tech confetti and you’re left with something far less dramatic and far more dangerous to bears: a structurally healthy market breaking a 96-year resistance. Not testing it. Not flirting with it. Breaking it. And doing so while the internet is convinced the sky is falling. This is where people get confused. They expect crashes to announce themselves loudly, with sirens and YouTube thumbnails. They don’t. Crashes arrive when optimism is universal, not when fear is a full-time job. Right now, fear is working overtime. If history rhymes, and markets are essentially drunk poets with a spreadsheet, then the evidence points to continued upside over the next 3–4 years, not a sudden plunge into a 10-year ice age. Now that does not mean straight up. Expect: Volatility Rotation Pullbacks that feel terrifying in real time and irrelevant in hindsight What it does not suggest is the end of capitalism every time the RSI sneezes. The 18-year business cycle is not complete. The long-term channel remains intact. RSI conditions are elevated but nowhere near the manic extremes seen in 1929 or 2000. Those periods were bubbles. This is not. Here’s the uncomfortable bit for many: The biggest risk right now isn’t being long. it’s being so convinced a crash is imminent that you miss the next leg entirely. Especially if you’re hiding in cash waiting for a disaster that keeps failing to show up. And before anyone shouts “What about tech collapsing?!”, yes — that’s precisely the point. If capital rotates out of bloated tech and into value, industrials, energy, financials, and boring businesses that actually make money, the index doesn’t die. It grinds higher while everyone argues about why their favourite stock stopped working. S&P 500 to 10,000 isn’t a fantasy screamed into the void. It’s the logical outcome of structure, cycles, and history, assuming capitalism doesn’t suddenly apologise and shut down. And if it does? Well, none of us will be worrying about our portfolios anyway. Ww Disclaimer =================================== This is not financial advice. It is not a signal, a promise, or a guarantee that markets will behave politely while you feel clever. Markets can remain irrational longer than you can remain solvent, especially if you’re trading leverage, emotion, or YouTube confidence. This outlook is based on historical price behaviour, long-term cycles, and observable market structure. If those conditions change, the thesis changes. Blind loyalty to an idea after the data disagrees isn’t conviction, it’s just stubbornness in a nicer font. If you’re looking for certainty, reassurance, or someone to blame later, this will disappoint you. If you’re looking for probabilities, context, and a framework that doesn’t rely on shouting “CRASH” every six months, you're welcome. Ww
without_worries
Bitcoin in multi year collapse back to $1k - December 2025
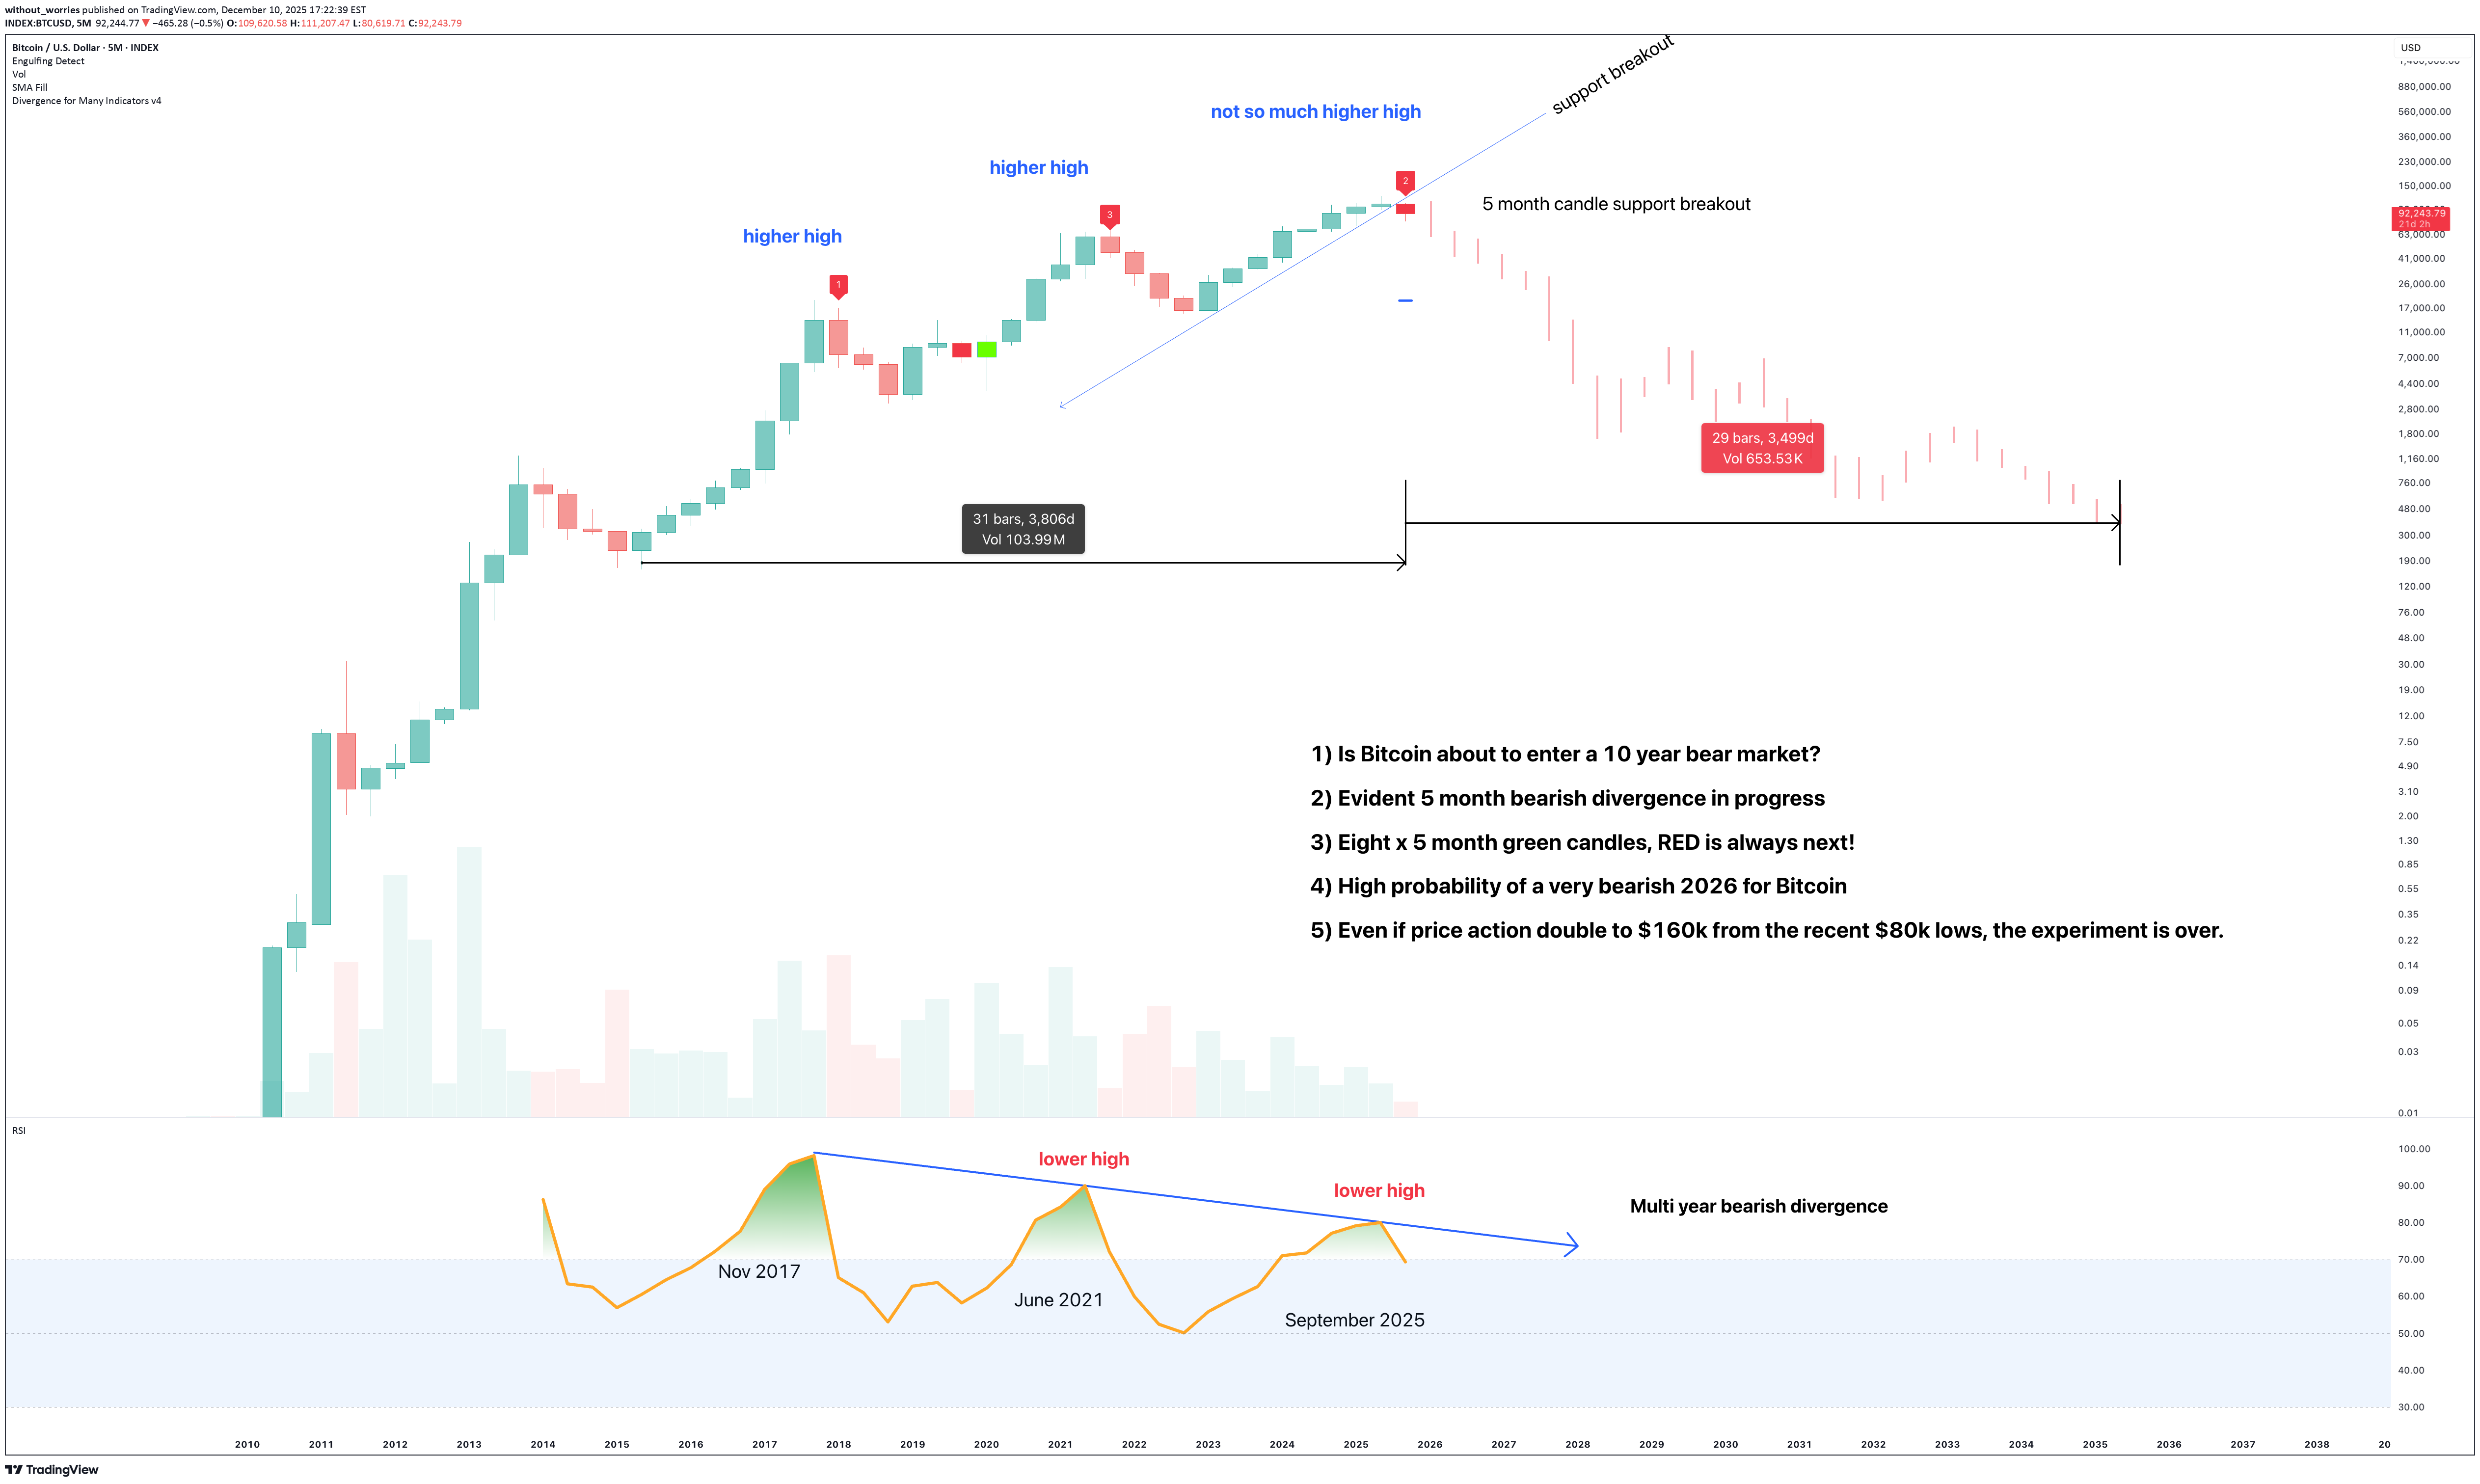
Perhaps you've noticed as have I, Media studies and Art collage students now turned financial experts flock to Youtube to inform peers of investment opportunities with the great Boomer wealth rotation that is set to land on their laps. Who would not be in disbelief at the possibility of wealth generated over generations is now at risk of being smoked on speculation in mere months. It is a real risk, and few seem to want to talk about it. Over the next 10 years wealth is expected to rotate from one generation to the next. During that time this one chart about screams "stay away". Few care to listen. Instead it's all recession talk, crash, mountains of debt, sky-high prices, and chaotic politics. Everything seems out of whack, distortion and noise as the AI tech bubble grinds on. Remember the post " Is Alt season dead? - June 2025 " when everyone was convinced of moon?, or " 3 week idea as price action broke down from $120k ". Read the comments, do you see yourself here? Shouting at the wind of sellers as your feet were lifted from the ground? Opportunities to generate significant returns in the years ahead do exist, just not not in crypto. If you stick around over the next 2-3 years, I'll show you them. But you're on your own, will not be guiding folks on every turn or daily pullback. That's for Ww homepage. Instead, this is a post to highlight the Rotation from Growth to value has already begun. Opportunities on real value, on real businesses that generate profit. That's the ticket. Not another "bearish Bitcoin post" As 2025 draws to to a close, the end of another 4 year cycle plays out perfectly. Few want to believe until that 70% correction is complete. They'll return with videos such as "It was manipulated!" or some nonsense. The truth is, a 700% return was made from the lows. That's decent. However, this cycle top was far more nefarious than price action lets on, it was the first time Bitcoin closes last year of a bull market at a lower price than the year began! Let that sink in for a moment. Still not sinking? 1) In the last year of a Bitcoin bull market, usually the most bullish year of the 4 year cycle, price action would nearly double. 2) Seriously. Look left. 2013, 1017, 2021, er 2025 hello. Did you try switching it off and on again? The end of the Bitcoin experiment Okay, the last year of a Bitcoin bull market, price action closed lower. That's not FUD, that's fact. It is the first time in the history of Bitcoin price action that has seen a lower close during the last year of the bull market. Think about that for a moment. That's not adoption, that's gravity gripping maxis by the ankles. The Bitcoin white paper implied a future that creates a globally accessible financial infrastructure. One that aims to give everyone equal opportunity to access a neutral monetary network, regardless of nationality, credit history, or status. Instead why we got was laser eyes and individuals who amassed chunks of the circulating supply. That's arguably more centralised than the US dollar! Since most dollars today exist outside of the US, not in it. (Wait until those dollars come flooding back home, that'll be an entertainment not even a Netflix Warner Bros combo could create). A significant bearish divergence prints On the above 5 month chart we have a higher high matched with a lower high in RSI. Same settings used on the divergence tool. There are now 21 days remaining of the year for that 5 month candle to print. If history is our teacher, two more red candle prints will follow. That's basically all of 2026 to be red. Not just a little bit red, but a scene so bloody even Quentin Tarantino uses the black and white filter. Conclusions, (or how to lose a fortune and blame the illuminati) Right. So to wrap this up for anyone still listening. We’ve established that the world’s gone mad. We’ve got people who until recently thought a “bear market” was a poorly attended gay pride event in the woods now lecturing you on monetary policy from their mum’s box room. The great Boomer wealth handover is coming, and it’s shaping up to be the biggest game of Hot Potato with Grandparents lifesavings. And your entry ticket is a magic internet bean that just had its worst party year *ever*. The facts, for those who enjoy them: 1. Bitcoin just wet itself. In the final, supposedly explosive year of its bull run, it closed *lower*. That’s like the finale of a fireworks display being a single, sad squeaker from a party popper. History screamed “double!”, 2025 whispered “...meh.” 2. The dream is a meme. The promise was a noble, decentralised utopia. The reality is laser eyed influencers and a supply more concentrated than a Kardashian’s self tanner. It’s not a revolution; it’s a pyramid scheme with better graphics. 3. The chart is screaming get out. A macro bearish divergence is printing. In layman's terms, the engine is smoking, the wheels are coming off, and the satnav is politely suggesting, for the 21st time, “At the next available opportunity, please turn the $§%$ around.” So, what’s the takeaway? This isn’t FUD. It’s an intervention. While the world is distracted by AI chatbots writing sonnets and political circuses, real value is quietly shifting. It’s not in speculative digital tokens; it’s in actual, boring, profit-making businesses. I know, double yawn, but the rotation has begun. You can still make 5-10x on stock positions if you chose wisely, manage risk, and are above all… are patient. That means no more 4hr charts and screaming day traders on Tik Tok. Ww Disclaimer ========================== This isn’t financial advice. I’m a bloke with a chart, not a wizard. I’m patiently waiting for Tradingview Mods to elevate me to that status. Nudge nudge. I could be utterly, spectacularly wrong. Bitcoin could moon tomorrow, propelled by a tweet from a billionaire who owns too much of it. You might buy a business that makes widgets and it goes bust because widgets become passé. That’s your gamble. My only point is this: when the history books are written about this period, the chapter won’t be called ‘The Genius of the Crypto Bros.’ It’ll be called ‘The Great Distraction,’ and it’ll sit right between “Tulip Mania” and “That time we all bought NFTs of Monkeys.” The real opportunity isn’t where the hype is. It’s where the silence is. And right now, that's not crypto. Now, if you’ll excuse me, I’m off to invest in something sensible. Probably tinned goods and shotgun shells. You know, real value.
without_worries
هشدار جدی: آیا بیت کوین تا نوامبر ۲۰۲۵ به سقوط ۵۶ هزار دلاری نزدیک است؟
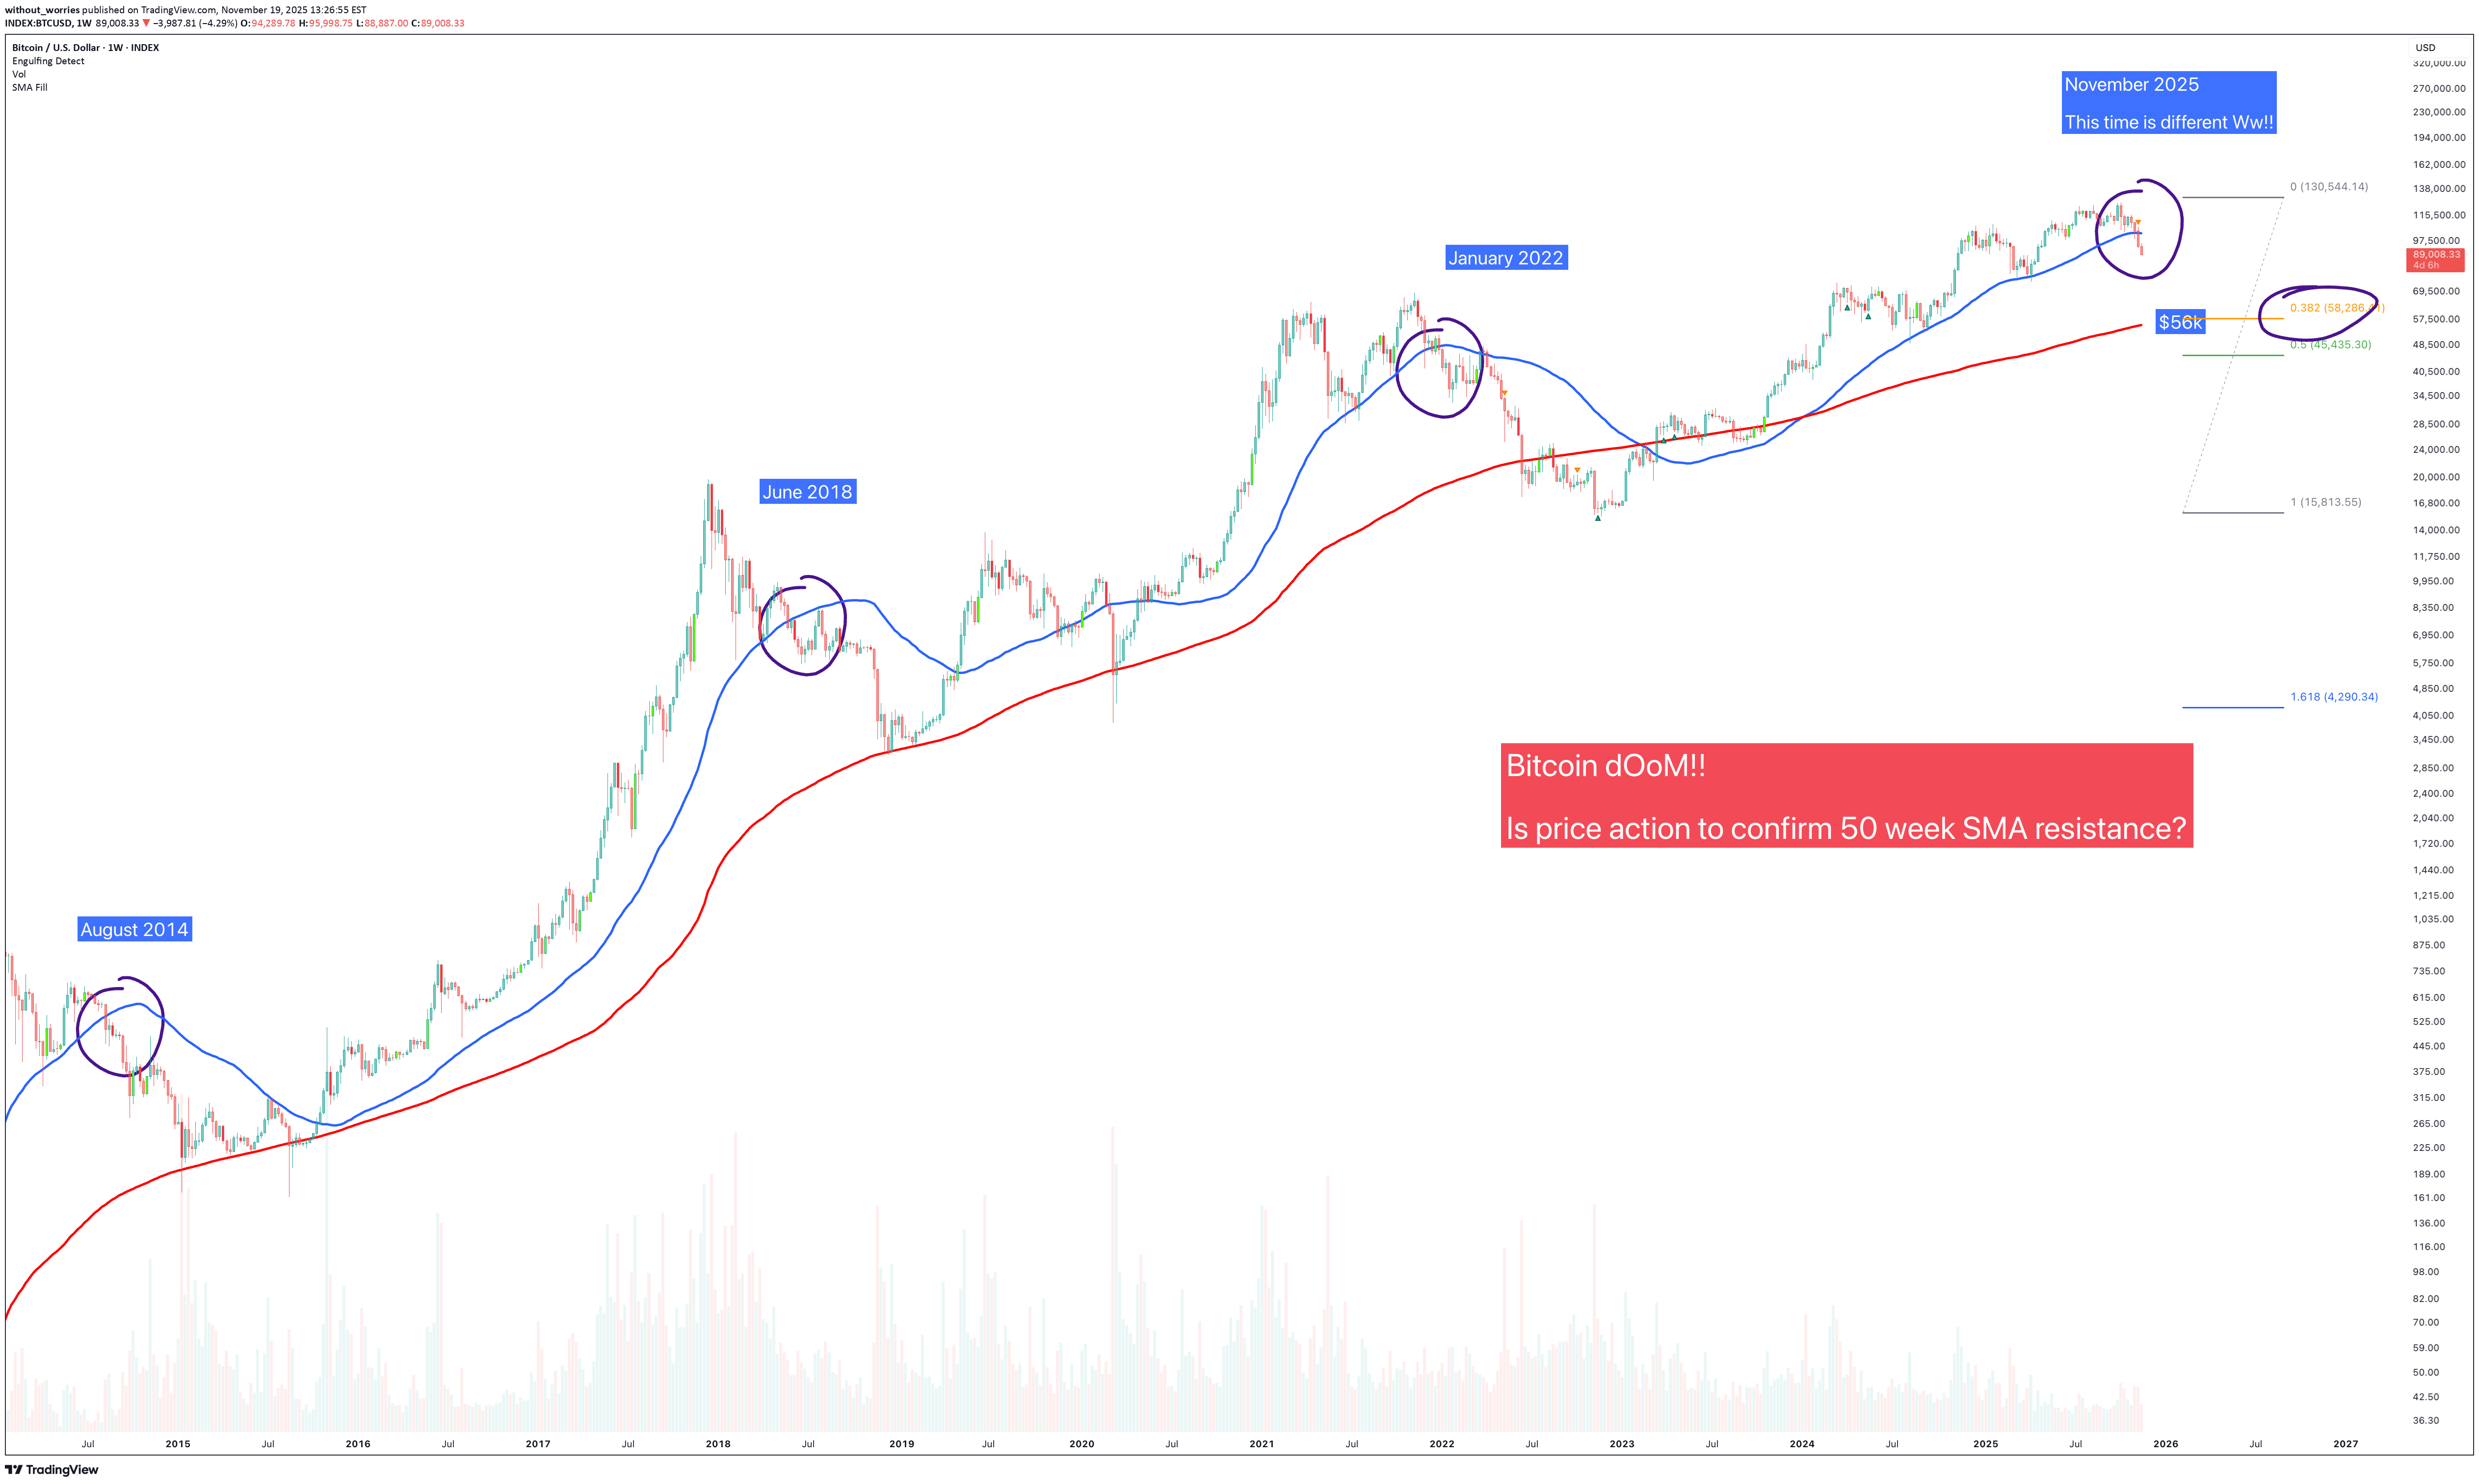
تم لفت انتباهی إلى الرسم البیانی أعلاه من قبل عدد من الأشخاص الذین طلبوا إبداء الرأی. إذن ها هو.. تذکر، أنا مجرد رسول ولست ممارسة على الهدف. أغلقت حرکة السعر الموضحة على الرسم البیانی الأسبوعی أعلاه تحت المتوسط المتحرک البسیط لـ 50 أسبوعًا، أو هذا ما قیل لی. "هل هذا هو؟ القمة الآن فی Ww؟" انظر إلى الیسار، إذا کنت تستخدم متوسطین متحرکین: 50 أسبوع SMA (الأزرق) 200 أسبوع SMA ثم بالنسبة لک، القمة موجودة. لقد انتهى الأمر، عد إلى المنزل. أهنئ نفسک مرة أخرى على توفیر سیولة الخروج لأولئک الذین دخلوا مراکز شراء بقیمة 15 ألف دولار. ولهم شکرک الدائم. ما هی الضجة؟ على مدار تاریخ Bitcoin، تم إجراء اختبار للمتوسط المتحرک البسیط (SMA) لـ 200 أسبوع فی کل مرة تغلق فیها حرکة السعر تحت المتوسط المتحرک البسیط (SMA) لـ 50 أسبوعًا. وهذا لیس موضع نقاش، بل هو حقیقة الرسم البیانی. الیوم سیکون هذا اختبارًا متوقعًا للغایة بقیمة 56 ألف دولار، وهو أیضًا مستوى فیبوناتشی 0.38. هذه التوقعات سوف تزعج الکثیر من الناس. لقد وعدهم المؤثرون بقصص عن الثروة والمجد. وبدلاً من ذلک.. حصلوا على درس فی أساسیات الاقتصاد، لکن کان علیهم دفع 50 ألف دولار مقابل ذلک. أنت لا تحصل على المبالغ المستردة للغباء، ألیس کذلک؟ هل هذه المرة مختلفة؟ لیس من الممکن أن أقول الآن. قد ینظر الکثیرون إلى الرسم البیانی وینسحبون، لقد اکتفوا. سیکون ذلک خطأً. لماذا؟ تأکید. انظر إلى الیسار. انظر دائما إلى الیسار. حتى یوم الاثنین 24 نوفمبر، لیس من المعروف ما إذا کان قد تم تأکید کسر الأسبوع الخمسین أم لا. فی الواقع، إذا ألقیت نظرة فاحصة، فستجد أن حرکة السعر لم تغلق فعلیًا جسم الشمعة الأسبوعی تحت المتوسط المتحرک البسیط لمدة 50 أسبوعًا، بل أغلقت من خلاله. هذا مهم. الیوم تأکید ینایر 2022 تأکید یونیو 2018 تأکید أغسطس 2014 الاستنتاجات وها نحن هنا مرة أخرى، Bitcoin نتأرجح على الحافة، والمؤثرون یهتفون "السوق الصاعدة!" وکأنه دین، ومع ذلک... هناک ذلک الخط الأزرق الصغیر السیئ. لم تنته حرکة السعر تحت المتوسط المتحرک البسیط لمدة 50 أسبوعًا بشکل جید على الإطلاق. لیس مرة واحدة. فی کل مرة، دون استثناء، یتبع ذلک رحلة مریحة إلى المتوسط المتحرک البسیط لـ 200 أسبوع. تاریخیًا، هذا ما یفعله Bitcoin، فهو یسقط حتى یصطدم بشیء red وباهظ الثمن، ثم یتصرف الجمیع متفاجئین. وأین هذا المستوى الیوم؟ حوالی 56 ألف دولار. مباشرة على فیبوناتشی 0.38. إنها مثل الجاذبیة مع الریاضیات. ولکن قبل أن تشعل المشاعل وتبدأ فی نشر منشورات "Ww's تحولت إلى هبوطیة"، اهدأ. الشمعة لم تؤکد بعد. هذا صحیح، أمامک حتى یوم الاثنین 24 نوفمبر لمعرفة ما إذا کانت هذه هی الصفقة الحقیقیة أم أنها مجرد صفقة وهمیة أخرى مصممة لتجعلک تشک فی کل قرار تتخذه فی حیاتک منذ الشراء بسعر 110 آلاف دولار. انظر إلى الیسار. فی کل مرة یغلق فیها السعر خلال 50 أسبوعًا، یتم تنفیذ نفس الشیء story: أغسطس 2014: تحطم الطائرة. یونیو 2018: تحطم. ینایر 2022: تحطم الطائرة. إنها فی الأساس نسخة البیتکوین من یوم جرذ الأرض، ولکن بدون بیل مورای أو النهایة السعیدة. إذا تم التأکید أسفل هذا الخط، فهذا کل شیء. یصبح المتوسط المتحرک البسیط لـ 200 أسبوع هو المغناطیس. إذا لم یکن الأمر کذلک، فسوف نرتد، وسیعود المؤثرون، وسیقنع الجمیع أنفسهم بأنهم کانوا یعرفون ذلک طوال الوقت. وفی کلتا الحالتین، أنا لا أقول "الموت". أنا فقط أقول، الریاضیات، إنها تعمل. رطب إخلاء المسؤولیة ===================================================================================================================== هذه لیست نصیحة مالیة. بوضوح. إذا کنت تتلقى إشارات استثماریة من رجل یتمتع بروح الدعابة بشأن انهیار السوق، فقد ترغب فی إعادة تقییم عملیة اتخاذ القرار لدیک. إذا کنت تبیع هنا ویضخ هذا علیک. إذا أمسکت وسقطت، فهذا علیک أیضًا. إذا ألقیت اللوم على "التلاعب بالسوق"، فتهانینا، فقد وصفت للتو کل خاسر فی مجال العملات المشفرة منذ عام 2017. لیس لدی کرة بلوریة، بل مجرد رسوم بیانیة وهم لا یکذبون، حتى لو فعل الناس ذلک. لذا، سواء انهار Bitcoin إلى 56 ألف دولار، أو ارتفع إلى 160 ألف دولار، أو بدأ فی تلقی المدفوعات بـ "الهوبیوم"، سأظل هنا، حاملًا الشای فی یدی، مبتسمًا، أشاهد التعلیقات تمتلئ بعبارة "لقد کنت مخطئًا!" من الناس الذین لم یکونوا على حق أبدا. بدون قلق (Ww) "انظر إلى الیسار، ولیس إلى الأعلى." یبلغ سعر مؤشر S&P 500 حالیًا 6630، وهو نفس السعر الذی کان علیه فی منتصف سبتمبر. لیس حادث تحطم طائرة. فی ذلک الوقت کان سعر Bitcoin 118 ألف دولار - 40 ألف دولار، نعم.. هذا انهیار. سوق الأوراق المالیة = 1 المضاربة على العملات المشفرة = 0
without_worries
هشدار بزرگ: بازگشت کانال قرمز نابودی به سهام مایکرواستراتژی (MSTR) در نوامبر ۲۰۲۵!
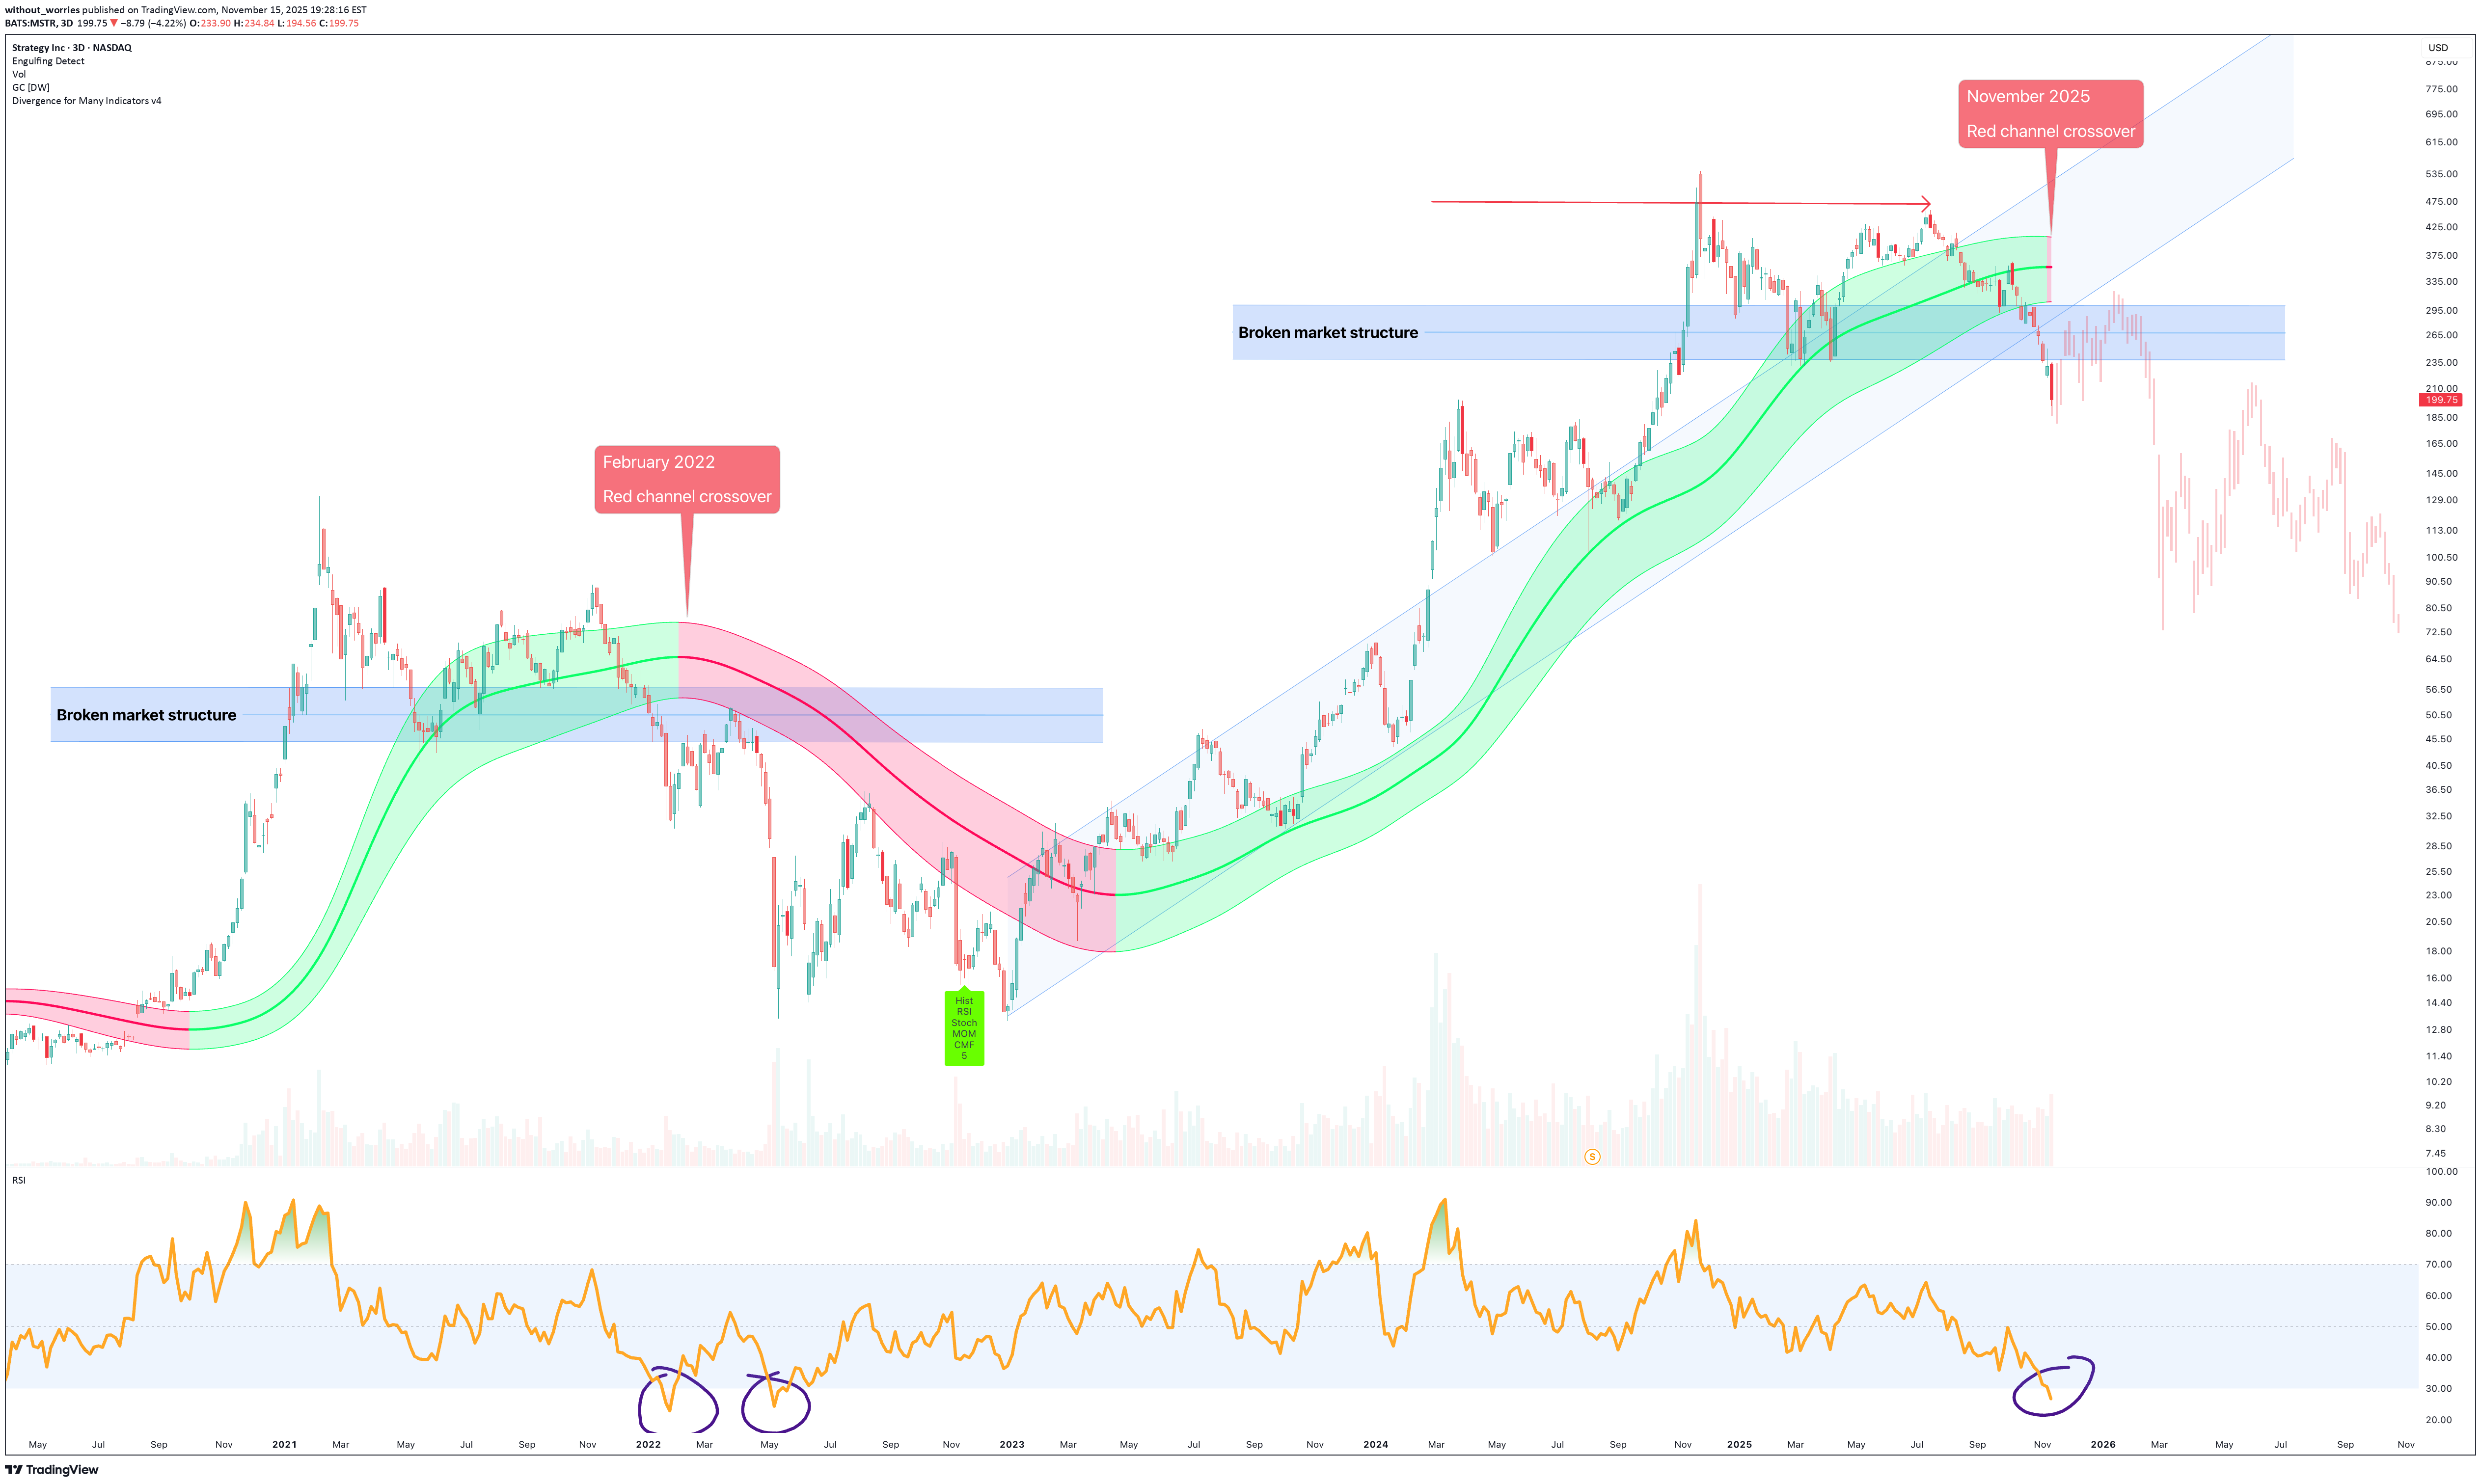
آه، مایکروستراتیجی…. السهم نصفه شرکة برمجیات، ونصفه الآخر Bitcoin عبادة. فی کل مرة تعتقد فیها أنها على وشک التصرف مثل شرکة تکنولوجیا عادیة، یظهر مایکل سایلور مبتسمًا، وملیار دولار أخرى من الدیون، وإدانة رجل لم یسمع أبدًا عبارة "نداء الهامش". وها نحن، نوفمبر 2025، نحدق فی Red قناة کروس أوفر. یبدو مشؤوما ألیس کذلک؟ مثل شیء ستحذر منه ناسا قبل أن یتحول Sun إلى super نوفا. دیجا فو: فبرایر 2022 یقول مرحبًا انظر إلى الیسار. آخر مرة عبرت فیها حرکة السعر القناة red کانت فی فبرایر 2022. وانهار هیکل السوق. ملقاة السعر. صلى أصحاب. وعندما ظن الجمیع أن الأمر قد انتهى، قام البائعون المخادعون بتدویر قرص الجاذبیة إلى الجیل الثانی. الآن عدنا إلیه. نوفمبر 2025، نفس التقاطع، نفس الإعداد، نفس هراء "هذه المرة مختلفة". کل مؤثر على X یکتب بالفعل "Buy the dip 🚀"، کما لو أن إضافة رمز تعبیری صاروخی یعمل بطریقة أو بأخرى على إصلاح الزخم السلبی. الفنیین تمثل القناة الخضراء المیاه الهادئة، والاتجاه الصعودی، والأوقات السعیدة، وشراء سایلور للطائرات مع الأرباح. القناة red هی العکس. یبدو الأمر کما هو الحال عندما تبدأ آثار الکحول فی الظهور وتدرک أن الثور لم یکن خالیًا من السکر Red. فی کل مرة یدخل فیها MSTR هذه المنطقة red، کان ذلک یعنی شیئًا واحدًا: هیکل السوق المکسور تصحیح 50-70%، مرحلة الإنکار الجماعی فی الوقت الحالی، یظهر الرسم البیانی نفس التقاطع red مرة أخرى، بعد الاختراق تحت الدعم الهیکلی حول منطقة 240 دولارًا. إذا کنت لا تزال تصرخ "إلى القمر" فی هذه المرحلة... حسنًا، لقد انفجر هذا الصاروخ منذ أشهر. مؤشر القوة النسبیة والمشاعر مؤشر القوة النسبیة یتدحرج بشکل أسرع من شخص مخمور فی حفل زفاف. لقد استنزف الزخم ولم یبق سوى أصحاب الحقائب الذین یشرحون لأزواجهم أن "هذا مخزن ذو قیمة على المدى الطویل". لیست کذلک. إنه سهم تقنی مع إدمان العملات المشفرة. إذن ماذا سیحدث بعد ذلک؟ إذا کان هناک أی شیء یجب أن یمر به التاریخ، وهو ما یحدث عادةً، فإن حرکة السعر تتجه نحو نفس المصیر الذی عانت منه بعد فبرایر 2022: أولاً، ارتداد قصیر الأمد لامتصاص الأمل. ثم، الانحدار البطیء والطاحن إلى الیأس. إن التراجع نحو منطقة 80-100 دولار سوف یتناسب تمامًا مع سلوک الدورة السابقة. وإذا أکد Bitcoin اتجاهه الهابط الغاوسی، حسنًا... دعنا نقول فقط أن مایکل سایلور سیحتاج إلى أکثر من "الأیدی الماسیة"، فسوف یحتاج إلى معالج نفسی. قبل أن یحدث ذلک، توقع أن تختبر حرکة السعر منطقة 300 دولار لتأکید هیکل السوق المکسور. تشهد حرکة السعر الیوم ذروة البیع إلى حد کبیر، ولا یتم التحقق من صحة هذه الفکرة إلا بعد تأکید المقاومة عند الدعم السابق . کتبت ذلک بالخط العریض لأولئک منکم الذین یکافحون من أجل تجاوز العنوان الرئیسی. أنا ألوم التیک توک الاستنتاجات کل دورة هی نفسها story: 1. MSTR یکسر الهیکل. 2. تظهر القناة >12<. 3. الجمیع یشعرون بالذعر. 4. ثم یأتی الصمت. المتغیر الوحید هو عدد التغریدات التحفیزیة التی یمکن لسایلور نشرها قبل بدء نداءات الهامش. هذا الإعداد لیس جدیدًا، ولیس نادرًا، ولیس صعودیًا، إنه مجرد ریاضیات تقوم بعملها بینما یتظاهر الناس بأنها حرب روحیة. إذن، نعم، لقد عاد تقاطع القنوات red. نفس الفیلم. سنة مختلفة. لا یزال ینتهی بشکل سیء بالنسبة للإضافات. رطب إخلاء المسؤولیة ====================================================================================================================== من الواضح أن هذه لیست نصیحة مالیة. إذا کنت بحاجة إلى شخص غریب على الإنترنت لیخبرک بعدم شراء شرکة باستخدام الأموال المقترضة للمقامرة على البیتکوین، فأنت تستحق المحفظة التی تحصل علیها. إذا ضخت، فسوف تحصل على الائتمان. إذا تخلص من ذلک، فسوف تلوم بنک الاحتیاطی الفیدرالی. وفی کلتا الحالتین، سأکون هنا مُحدِّدًا رغبتی فی قول "لقد أخبرتک بذلک".
without_worries
صلیب مرگ بیت کوین: آیا نوامبر ۲۰۲۵ پایان جهان ارزهای دیجیتال است؟
صلیب الموت. یبدو مرعبا، ألیس کذلک؟ مثل شیء من فیلم رعب منخفض المیزانیة. هنا فی بافاریا الأکثر ظلمة، لا یمکنک القیادة لمدة عشر دقائق دون رؤیة المسیح مسمرًا على صلیب عند کل تقاطع على شکل حرف T، إنه الشعار المحلی عملیًا. عند عبور الحدود النمساویة، تتضاعف الأرقام مثل متداولی الرافعة المالیة فی سباق صعودی. Lovely. لکن هذا؟ هذا هو صلیب الموت الحقیقی. أو على الأقل هذا ما یعتقده السوق. دیجا فو... للمرة الثالثة هذه هی المرة الثالثة التی أکتب فیها هذا المنشور. ونعم، إنه دائمًا فی أقصى درجات الخوف. کل دورة هی نفسها: الناس یشعرون بالذعر، وتتطایر المیمات، وفی مکان ما یقول أحدهم: "الأمر مختلف هذه المرة". المفسد: لیس کذلک. إذا کنت تشعر بالحنین، فانقر على المثلثات الصغیرة حیث تشیر الأسهم الأرجوانیة على الرسم البیانی. سترى المشارکات السابقة. لقد اصطف النقاد فی ذلک الوقت أیضًا، بارک الله فیهم. یمکن سماع أصوات عالیة ومحافظ صغیرة وصوت أمی فی الخلفیة "العشاء!". 7 أبریل 2025 صلیب الموت 18 أغسطس 2024 صلیب الموت صلیب الموت فی 17 نوفمبر على الرسم البیانی لمدة یوم واحد أعلاه، من المتوقع أن یتم طباعة الإشارة بحلول 17 نوفمبر. وذلک عندما المتوسط المتحرک البسیط لـ 50 یومًا (الأزرق) یتقاطع مع المتوسط المتحرک البسیط لـ 200 یوم (red) و حرکة السعر تقع تحت خط 200 یوم. إنها النسخة الفنیة لقول والدتک: "أنا لست غاضبًا، فقط محبطًا". تستخدم هذه التوقعات طریقة Trigg & Leach، وهی نفس الطریقة المطبقة على التقاطعات السابقة وتم تثبیتها فی کل واحدة منها منذ بدء السوق الصاعدة. أقرب التصغیر.. الوقت اللازم للوصول إلى قمة السوق: حوالی 59 یومًا إلیکم الجزء الذکی، أو کما أسمیه، الریاضیات المملة التی لا یقرأها أحد. تاریخیًا، بعد کل صلیب الموت Bitcoin، ارتفع قبل أن یتصدر القمة. لقد تقلص الوقت بین التقاطع والمحور: الدورة الأولى → 179 یومًا الدورة الثانیة → 131 یومًا الدورة الثالثة → 99 یومًا قم بتطبیق بعض التقدم الحسابی، فهذه طریقة رائعة لقول "أوجد الفرق وتظاهر بأنه یعنی شیئًا ما". الفرق 1: 131 - 179 = −48 الفرق 2: 99 - 131 = −32 متوسط الفرق = −40 إذن 99 - 40 = 59 یومًا. وهذا یضع الدورة المحتملة فی أعلى مستوى فی منتصف ینایر 2026، ولا تعلم أن عملیات البیع فی منتصف ینایر هی تقلید أقدم من الصور المصغرة السیئة على YouTube. الاستنتاجات لذا نعم، صلیب الموت قادم. ابحث عن العناوین الرئیسیة والدراما والشخص الموجود على X الذی یشرح مستویات فیبوناتشی وکأنها کتاب مقدس. انظر إلى الیسار. فی کل مرة حدث هذا، کان الأمر یحدث بنفس الطریقة: الذعر، والارتداد، والیأس، والتعافی. شطف، کرر. تشیر الریاضیات إلى منتصف ینایر 2026 لارتفاع التأرجح التالی، ثم تتولى الجاذبیة المهمة. إذا سار کل شیء کما هو مخطط له، فهذا رائع. إذا لم یکن الأمر کذلک، أضف هذا إلى مجلدک المتنامی بعنوان "لماذا لا أستمع إلى أی شخص على TradingView". رطب إخلاء المسؤولیة ============================================================================================================= هذه لیست نصیحة مالیة. أنا لست مدیر صندوقک، أو کاهنک، أو والدتک. إذا راهنت بکل شیء على Bitcoin لأن خطین متعرجین یشکلان علامة متقاطعة، فهذا خطأک، ولیس خطأی. إذا ضخت، ستقول أنک "کنت تعرف دائمًا". إذا حدث ذلک، فسوف تغرد "التلاعب بالسوق". وفی کلتا الحالتین، سأظل هنا، أشرب الشای وأضحک على قسم التعلیقات. لذا نعم إنه صلیب الموت. لکن استرخی. إنه مجرد مخطط، ولیس کتاب الرؤیا. امین
without_worries
هشدار جدی به بیت کوین: آیا کانال گاوسی نوامبر ۲۰۲۵ پایان صعود است؟
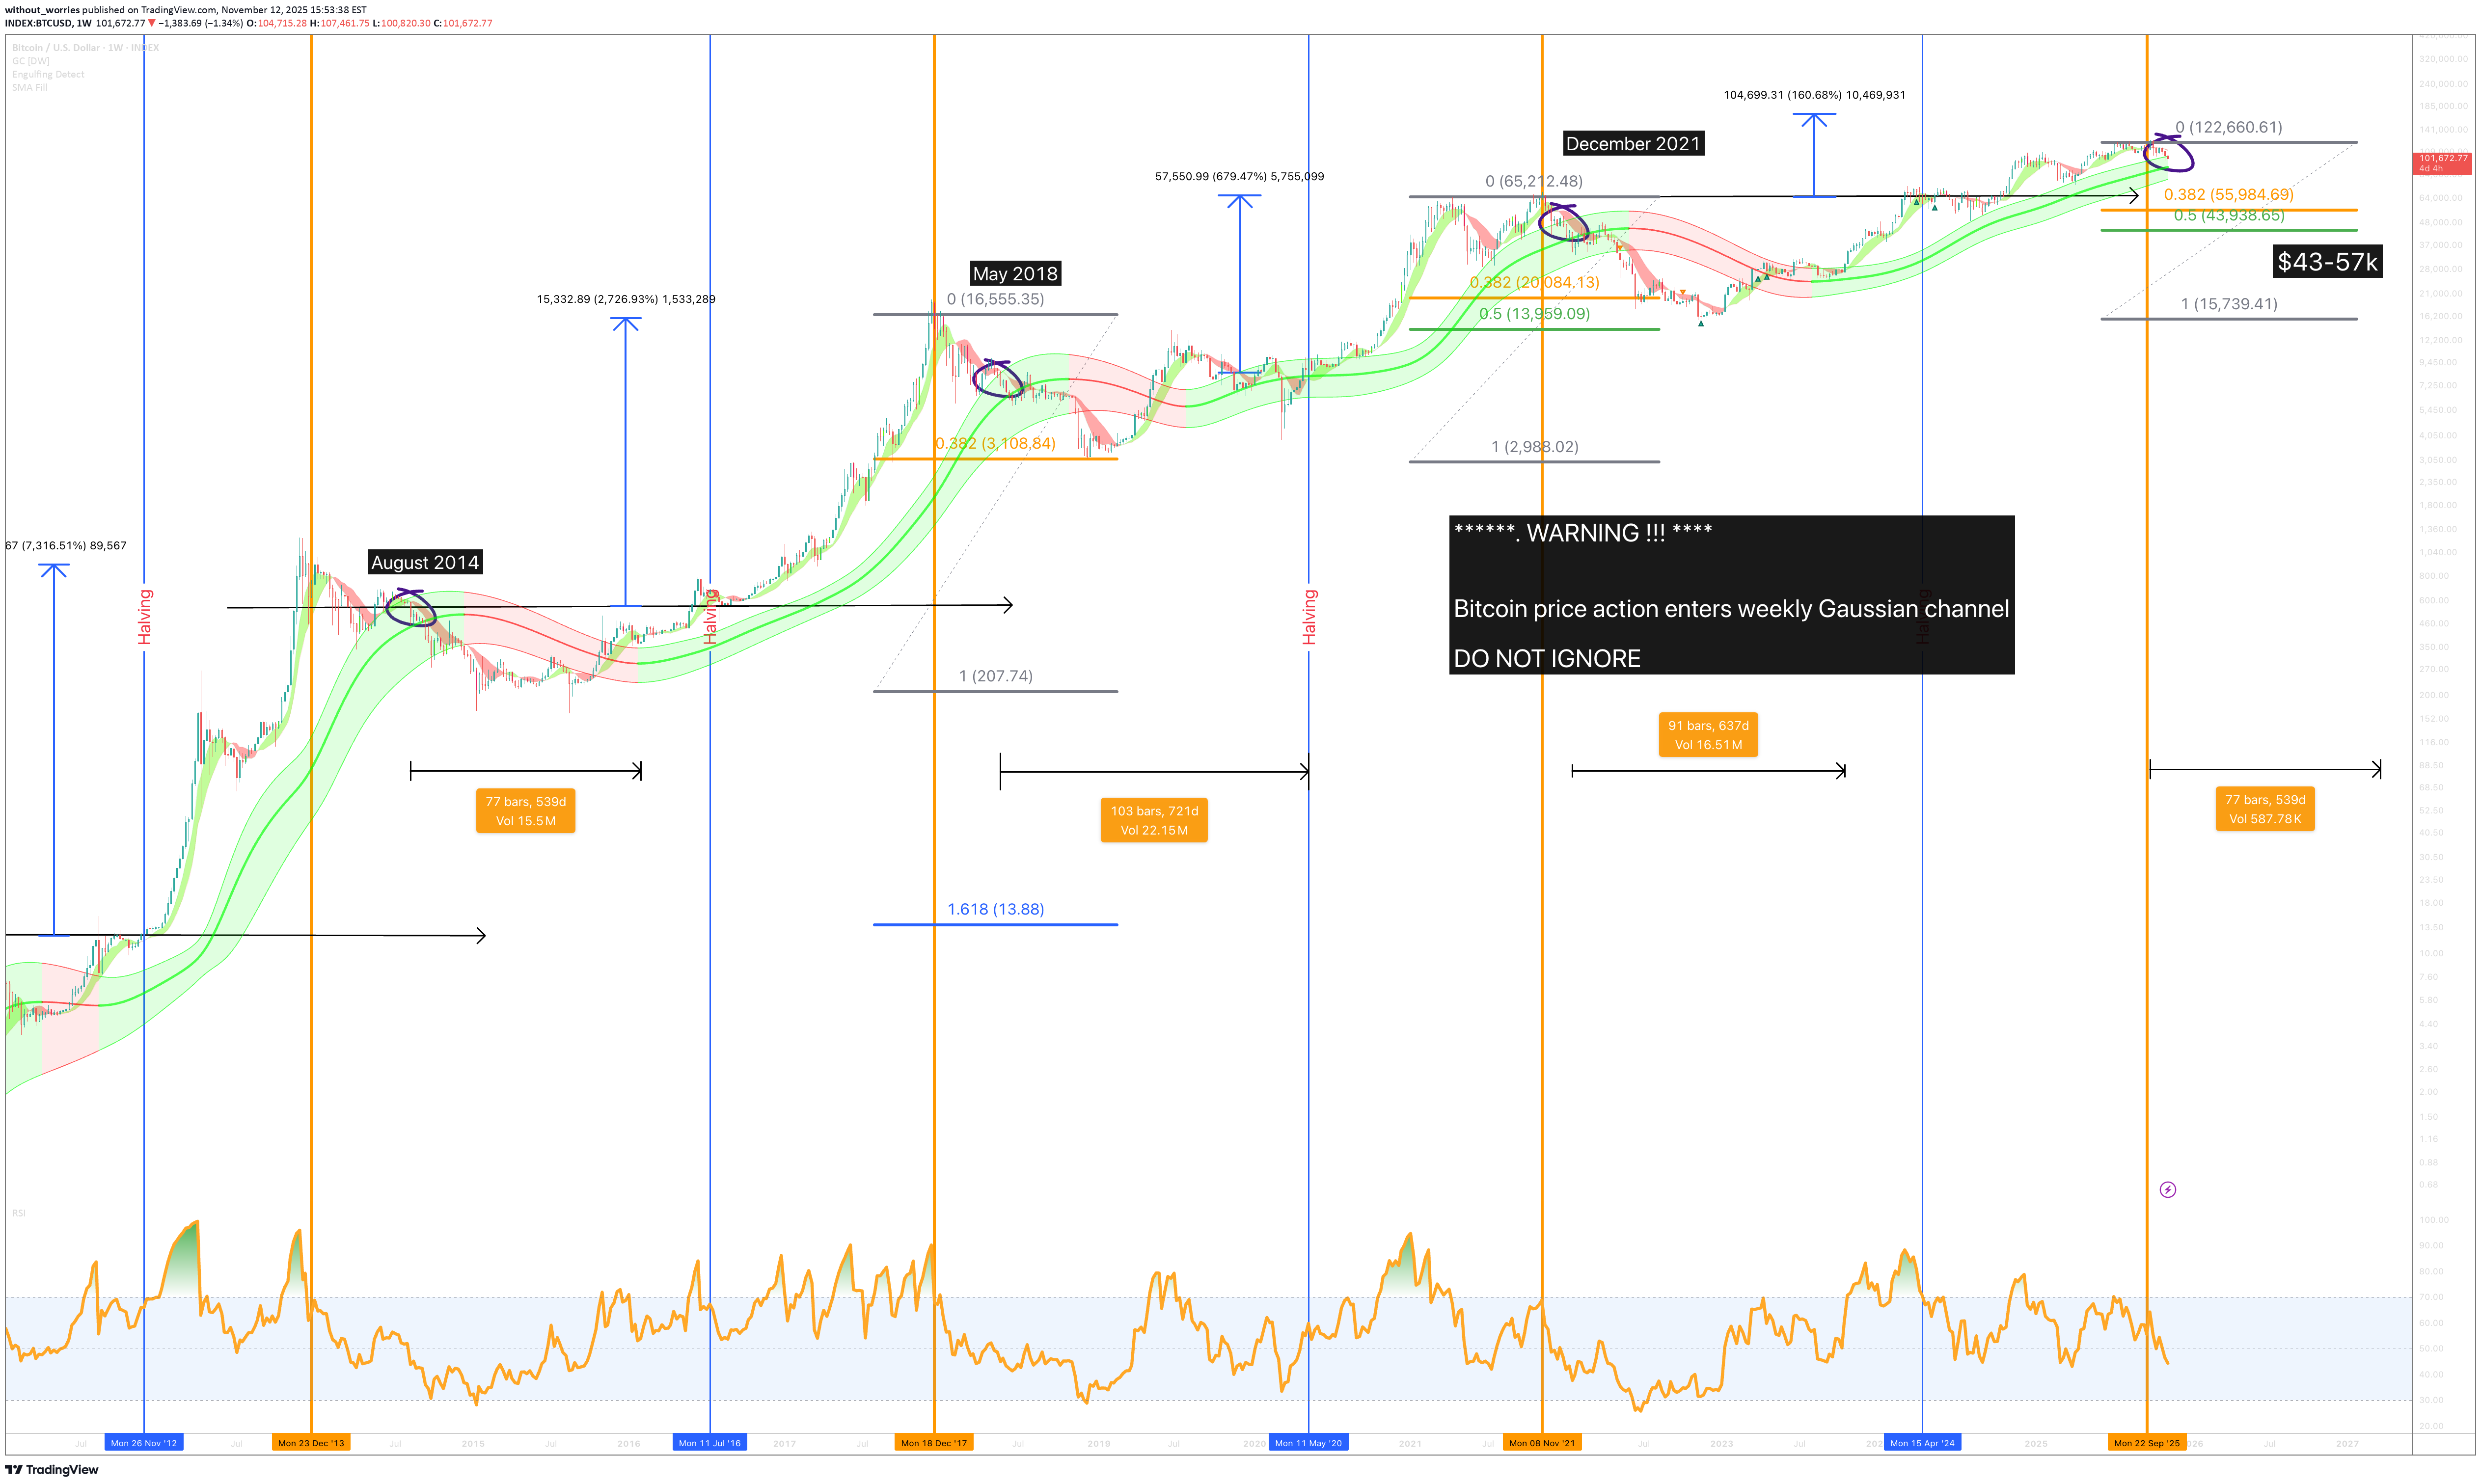
وأمام الثیران حتى 17 نوفمبر للتراجع عن ذلک، وإلا... تم إطلاق إنذار مؤخرًا، وهو إنذار تم نسیانه تمامًا. یحتوی هذا المنبه على رسالة مکتوبة لنفسی: "تدخل حرکة سعر البیتکوین فی القناة الغوسیة الأسبوعیة. انظر إلى الیسار - لا تتجاهل" ننظر إلى الیسار، ونتوقف، " حسنًا، لیس هذا مثیرًا للاهتمام "، یقول صوت العقل الصغیر. أقول لها أن تصمت لأننی أقنع نفسی أن الأمر مختلف هذه المرة. التقنیة: کل شمعة محاطة بدائرة من عام 2014 حتى عام 2021 هی الشمعة الأولى التی تدخل القناة الغوسیة الأسبوعیة بعد قمة السوق. الآن، سواء کنت تعتقد أن قمة السوق موجودة أم لا، فهذا غیر ذی صلة. نحن مهتمون فقط بالحقائق. الحقائق هی: تم تصحیح حرکة السعر بنسبة -60% کحد أدنى عند دخول القناة بعد تأکید. حرکة السعر لدیها حتى 17 نوفمبر للتأکید. سیؤدی ذلک إلى وصول السوق إلى قاع یتراوح بین 43 ألف دولار إلى 57 ألف دولار، وسیتم القضاء على صندوق سایلور. ستبقى حرکة السعر فی حالة السوق الهابطة لمدة 18 شهرًا على الأقل. لذلک لا یوجد انتعاش حتى منتصف عام 2027. أقرب کلاریس ما الذی یجب أن یحدث للبقاء فی السوق الصاعدة؟ یجب أن تغلق حرکة السعر فوق 110 ألف دولار، فی حین أن 105 ألف دولار من الناحیة الفنیة خارج القناة، فسیکون ذلک إغلاقًا ضعیفًا. إغلاق ضعیف حیث أن bar السابق یبتلع الطباعة. الاستنتاجات ها نحن هنا مرة أخرى، دخلت عملة البیتکوین إلى القناة الغوسیة الأسبوعیة، تلک المعکرونة الخضراء للهلاک. فی کل مرة یحدث ذلک، یصرخ الناس "اشترِ الانخفاض!" وکأن تردیدها یجعل الشموع red تتلاشى. انظر إلى الیسار، بجدیة، فقط انظر. فی کل مرة تتجول فیها حرکة السعر فی تلک القناة منذ عام 2014، کانت هذه بدایة تراجع لمدة 18 شهرًا للمضاربین على الانخفاض. ویقولون: "هذه المرة مختلفة". فی کل دورة Bitcoin دخل سعر القناة الغوسیة وانخفض تقریبًا -60% وظل بائسًا لأکثر من عام. وکان عام 2025 مجیدًا، ألیس کذلک؟ کل ما أراده Bitcoin ماکسی هو استبدال السیارة الورقیة. تهانینا، حرکة السعر هی نفسها کما کانت فی هذا الوقت من العام الماضی ویبدو أنها مستعدة لمواصلة هذا الاتجاه! لماذا الوجوه الطویلة؟! ألیس هذا ما أردت؟ لم یکن الأمر یتعلق أبدًا بمزید من الدولارات، ألیس کذلک؟ 1 Bitcoin لا یزال = 1 Bitcoin بعد کل شیء. الآن لدى الثیران حتى 17 نوفمبر إلى prove وهذه لیست إعادة أخرى. إذا لم یتمکن المضاربون على الارتفاع من دفع السعر إلى ما فوق 110 آلاف دولار (والاحتفاظ به)، فهذا یعنی أن الأمر سینتهی. 43 ألف دولار - 57 ألف دولار تصبح منطقة التأمل الجدیدة بینما یحذف سایلور وطاقم عین اللیزر تغریداتهم بهدوء. رطب إخلاء المسؤولیة ============================================================================================================= هذه لیست نصیحة مالیة. إنه رجل على الإنترنت یشیر إلى منحنى بلون قوس قزح ویقول "هذا سیء". إذا قمت برهن منزلک لأنک تعتقد أننی اکتشفت رمز secret للآلهة الغوسیة، فهذا علیک. إذا کان الأمر کذلک، فسوف تسمی نفسک عبقری. إذا تخلصت من النفایات، ستقول إن الحیتان تلاعبت بها. وفی کلتا الحالتین، سأظل هنا، أضحک على قسم التعلیقات. لذا نعم، لا تتجاهل القناة. ولکن أیضًا، لا تبیع کلیتک لأن شخصًا غریبًا على TradingView رسم بعض الخطوط المتعرجة.
without_worries
پیشبینی سقوط دوجکوین: آیا نوامبر ۲۰۲۵ به ۴ سنت میرسیم؟
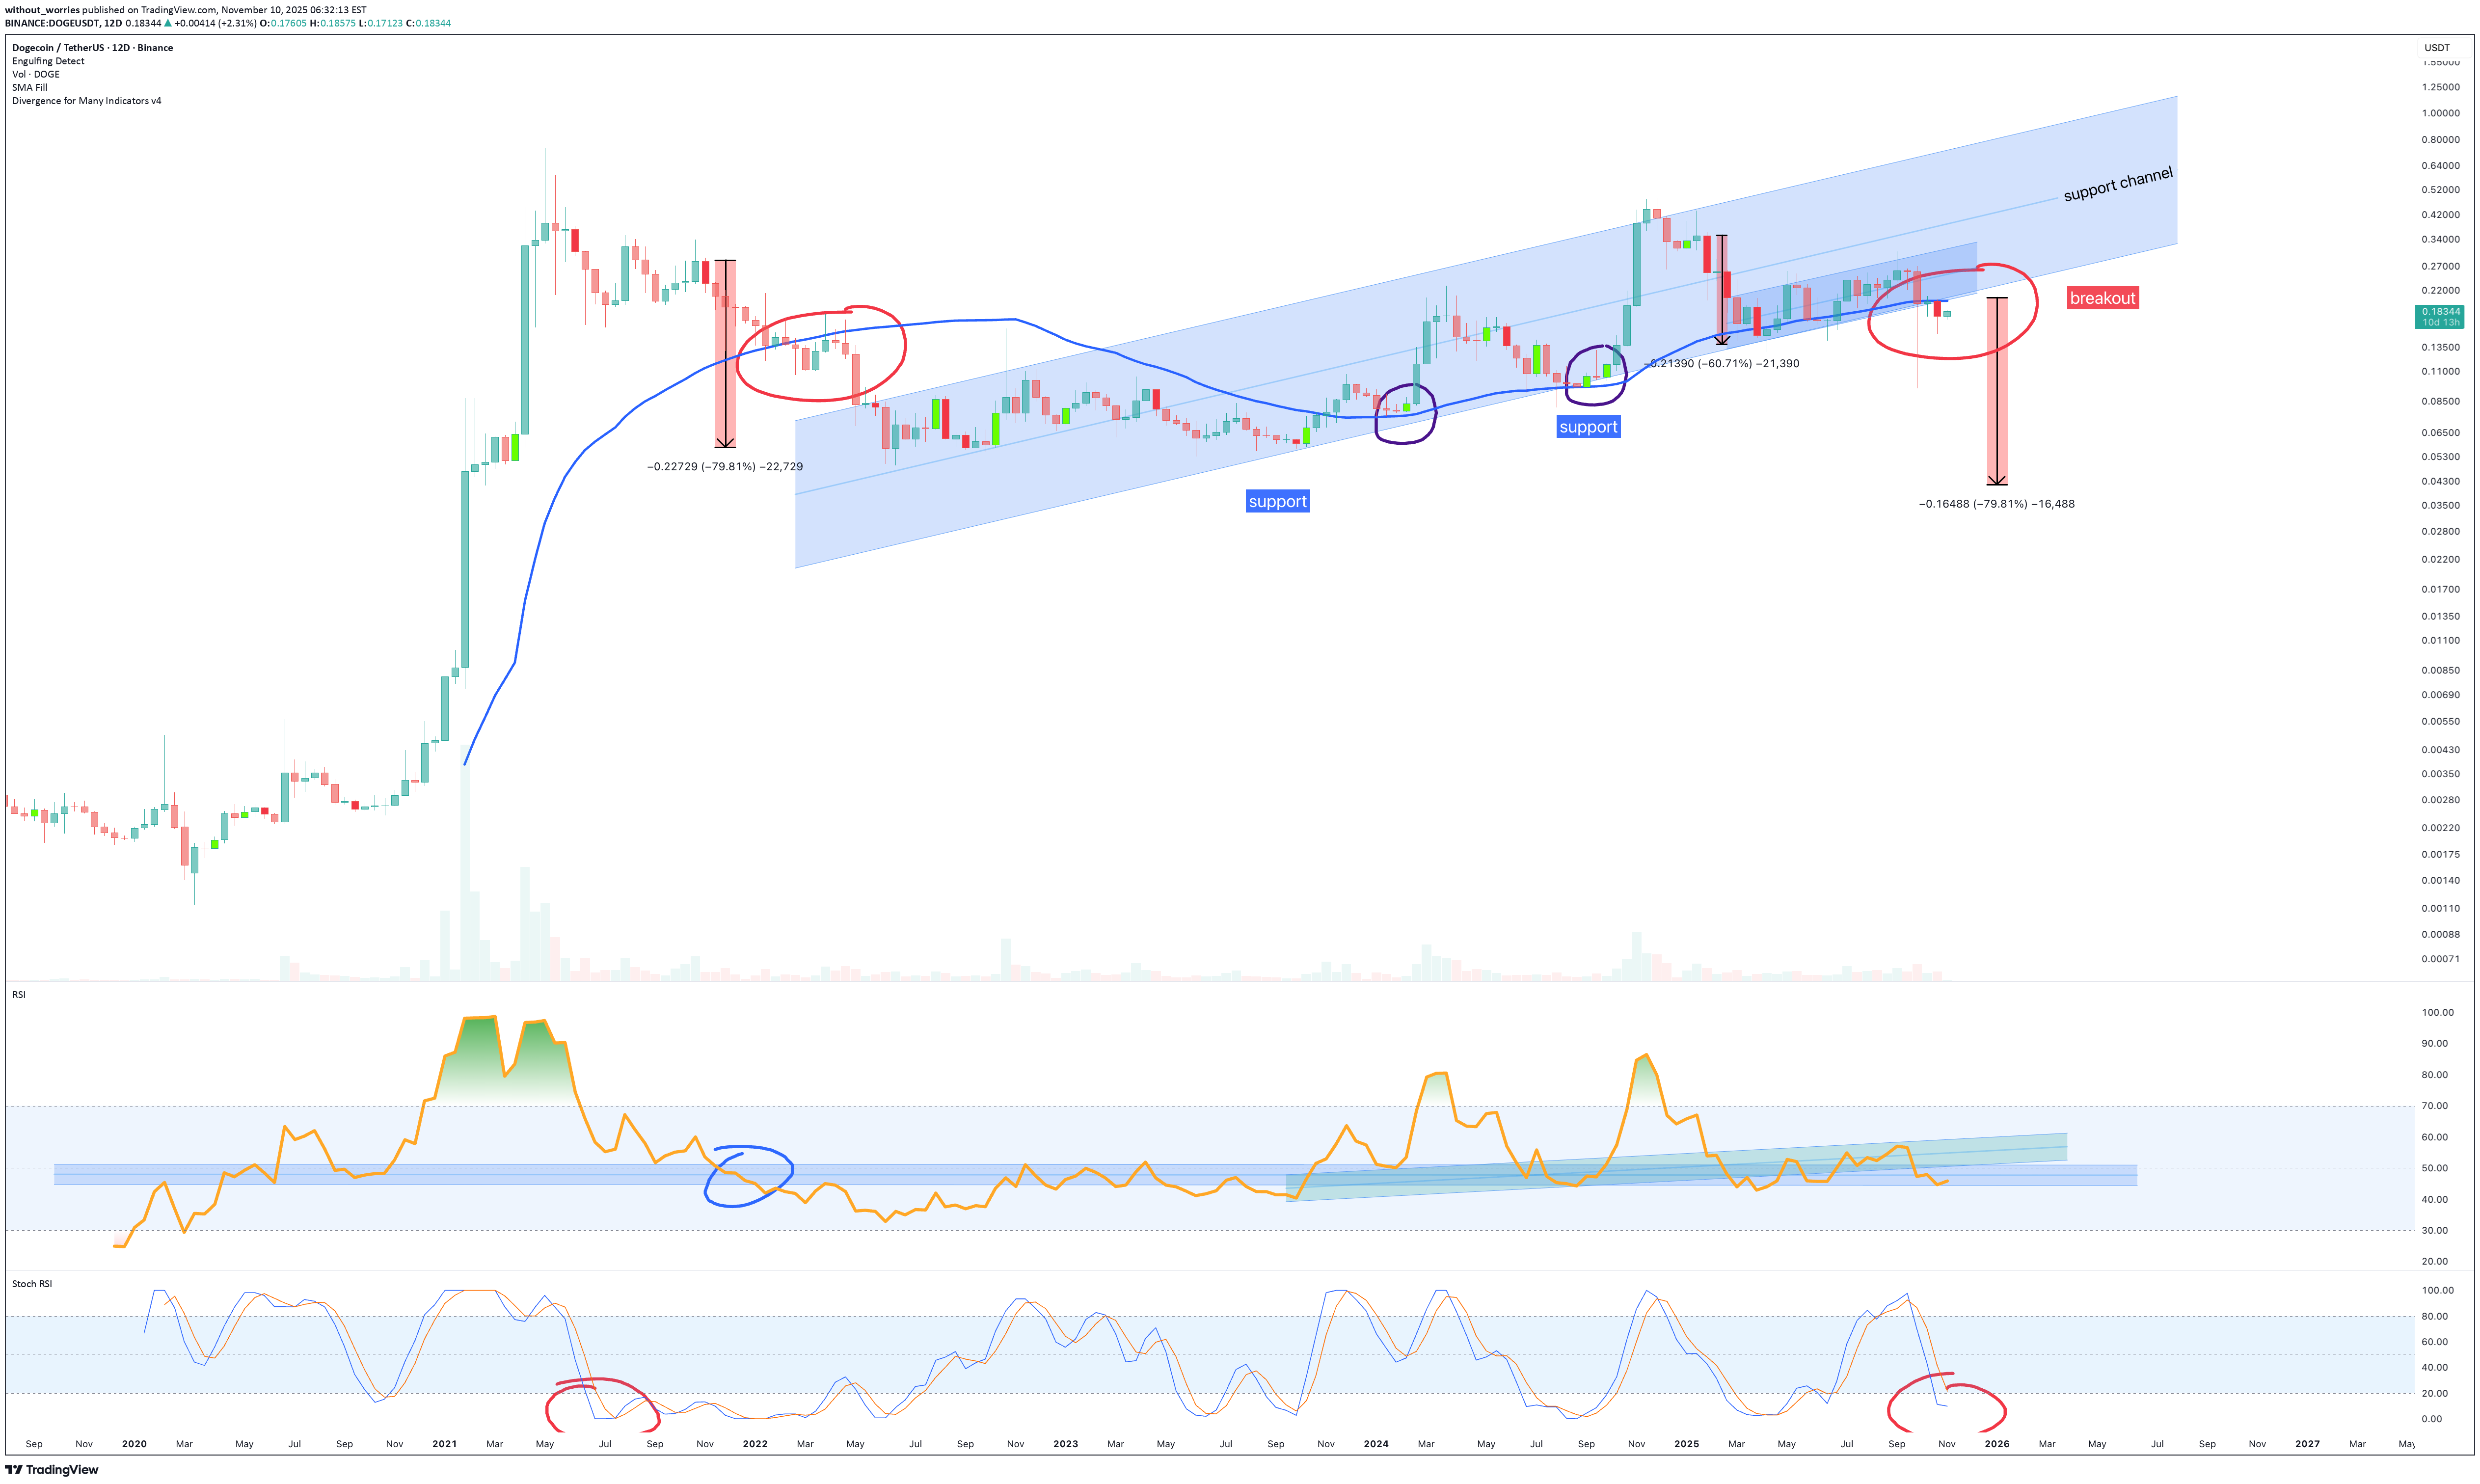
نحن نعید الکَرَّة مرة أخرى. الدوجکوین، "العملة" الوحیدة التی بدأت کمزحة، أصبحت دینا، ویبدو الآن أنها عادت إلى أجهزة دعم الحیاة. فی کل مرة یلامس فیها الخط الأزرق (وهو المتوسط المتحرک البسیط 50 على الرسم البیانی لمدة 12 یومًا الموضح أعلاه) السعر، یصرخ الجمهور: "إنه ینفجر!" ثم تُذکّر الجاذبیة الجمیع بکیفیة عمل المخططات والفیزیاء فعلیًا. انظر إلى الیسار عندما أغلقت حرکة السعر شمعة 10 أو 12 یومًا على أو أسفل الخط الأزرق، وهو المتوسط المتحرک البسیط 50، یرتفع السعر إلى القمر أو یسقط من الهاویة. إنه مثل déjà vu ولکنه أکثر تکلفة. التقنیات (A.K.A. التحقق من الواقع) 1. قناة الدعم: کان السعر یرتد بشکل مطیع داخل تلک القناة الصاعدة الصغیرة اللطیفة منذ عام 2022. عندما ترى حرکة السعر تتبع القناة بدلاً من التفاعل معها، فهذا تحذیر. وهذا تحذیر من الضعف الوشیک. الآن انخفض السعر مثل السکران من خلال طاولة القهوة. 2. مؤشر القوة النسبیة: یحوم فی منتصف الأربعینیات، وهو ما یعنی فی الأساس أنه یقرر ما إذا کان سیکلف نفسه عناء المحاولة أو الاستسلام بهدوء. إذا وصل إلى 42، اترک السفینة! 3. مؤشر القوة النسبیة مؤشر ستوکاستیک: یمکنک رؤیته یتراجع مرة أخرى. تلک الدائرة red؟ هذا هو المعادل الفنی للتثاؤب قبل القیلولة، وعادة ما یتبعه سقوط. بمجرد أن یقل عمرک عن 20 عامًا، ستبقى هناک لفترة. ترى أن التصحیح 78٪ من عام 2021؟ نعم، لقد قمنا للتو بطباعة نفس الإعداد مرة أخرى (النقاط من 1 إلى 3). الشیء الوحید المفقود هو تویتر meme من ملیاردیر یعمل بالکیتامین. التوقعات أفضل حالة: ارتداد cat میت إلى أسفل القناة (~0.17 دولار). تهانینا، لقد انکسرت حتى فی طریقک لخسارة المزید. الحالة الأساسیة: تصحیح آخر بنسبة 70-80%، تمامًا مثل المرة السابقة. التاریخ لا یتکرر، ولکن التجار Dogecoin یکررون ذلک بالتأکید. ستختبر حرکة السعر 4-5 سنتات فی هذه الحالة. أسوأ حالة: Elon یغرد بشیء ما، ویضخ 40% فی ساعة واحدة، وتشتری الجزء العلوی مرة أخرى. الاستنتاجات Dogecoin لا یزال یفعل ما یفعله دائمًا، ویذکرنا بأن الأسواق مدعومة بالعاطفة أکثر من المنطق. لقد کانت fun بینما استمرت، لکن النکتة انتهت. النکتة هی محفظتک. وإذا کان للتاریخ أی دلیل، فسوف ننفق الأشهر القلیلة المقبلة فی التظاهر بأن هذا مجرد "تراکم". لیس کذلک. إنه إنکار بخطوات إضافیة. هل یمکن أن یظهر القمر مرة أخرى؟ بالتأکید. وکذلک الأمر بالنسبة لمحمصة الخبز الخاصة بی إذا قام Elon بالتغرید حول هذا الموضوع. رطب إخلاء المسؤولیة ===================================================================================================================== هذه لیست نصیحة مالیة. إنه رجل على الإنترنت یشیر إلى صورة dog وبعض الشموع. إذا اشتریت Dogecoin لهذا السبب، فلا ترسل لی رسالة مباشرة وأنا أبکی عندما ینفجر، اتصل بمعالجک. إذا کان الأمر کذلک، فسوف تسمی نفسک عبقری. إذا حدث ذلک، فسوف تسمی ذلک تلاعبًا بالسوق. وفی کلتا الحالتین، سیکون الأمر مضحکا.
without_worries
تقاطع مرگ بیت کوین SUI: فریب هولناک یا طلوع ۹۰۰ درصدی؟
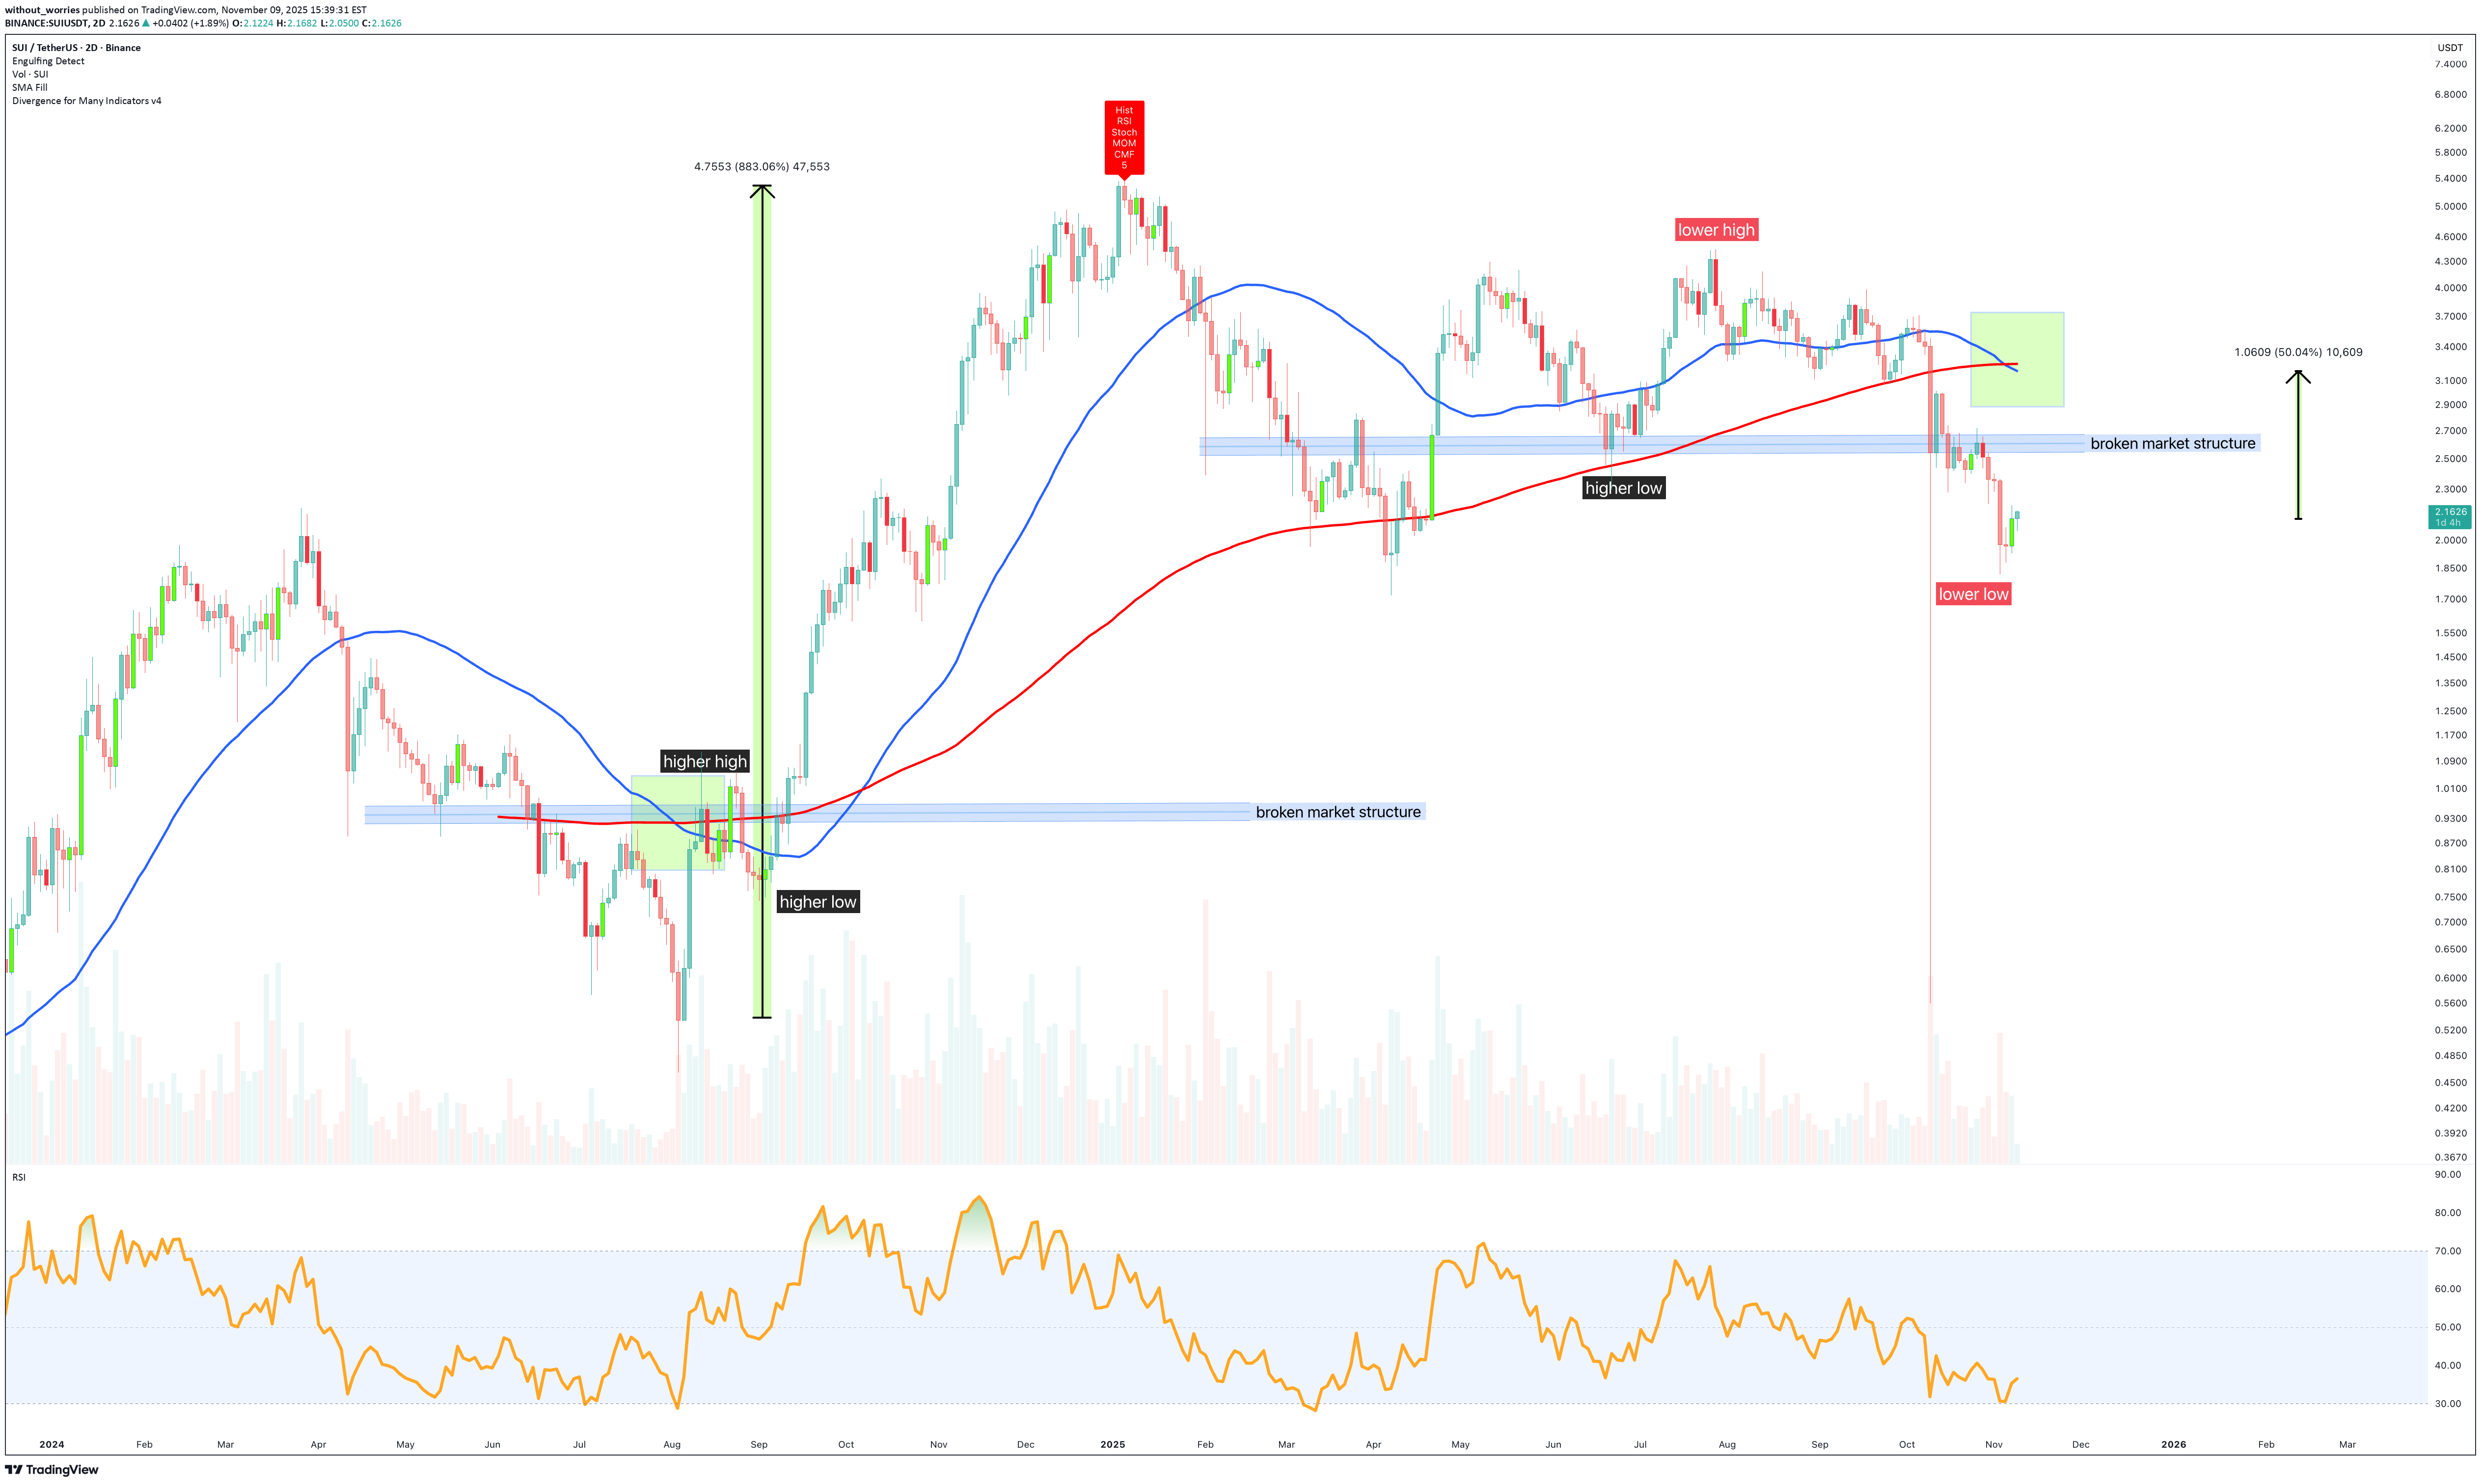
یظهر تقاطع الموت لمدة یومین على الرسم البیانی لمدة یومین أعلاه عند SUI. وذلک عندما یتقاطع المتوسط المتحرک البسیط (SMA) لمدة یومین مع المتوسط المتحرک البسیط (SMA) لمدة یومین (red). یبدو هبوطیًا ألیس کذلک؟ الحقیقة، عندما نظرت إلى الیسار، کانت مختلفة تمامًا. ارتفعت حرکة السعر بنسبة مذهلة بلغت 900% بعد یومین من الطباعة المتقاطعة للموت. هل التاریخ یتکرر؟ ربما. هناک سؤالان یجب أولاً الإجابة علیهما بشکل إیجابی قبل أن یعید التاریخ: 1. الاتجاه، هل یتم طباعة الارتفاعات الأعلى والانخفاضات الأعلى؟ 2. ما هو الدعم والمقاومة؟ یتم الرد على کلا السؤالین بشکل سلبی فی هذه اللحظة. الموقف الطویل غیر عقلانی حتى یتغیر ذلک. المتوسطات المتحرکة لا تتنبأ بالمستقبل من السهل جدًا أن یرى المتداولون المتوسطات المتحرکة کتوقعات للأشیاء القادمة. إنه شعور غبی لقول هذا: " المتوسط المتحرک هو متوسط القیمة لمجموعة من القیم خلال فترة زمنیة معینة ". سوف تتفاجأ بعدد الأشخاص الذین لا یدرکون ذلک. تخبرک المتوسطات المتحرکة بشیء عن الماضی ولا تخبرک بأی شیء عن المستقبل. فقط السؤالین 1 و 2 یمکنهم فعل ذلک. ما الذی یمکن توقعه؟ من الواضح أنه من الممکن توقع ارتفاع move فی حرکة السعر على طباعة الموت. على الأقل حتى هیکل السوق. سیکون هذا مکسبًا بنسبة 50٪ من حرکة السعر الیوم. وبعد ذلک، یجب أن یصبح السؤالان 1 و2 إیجابیین، تمامًا کما کان الحال قبل أواخر عام 2024. الاستنتاجات إن ما یسمى بصلیب الموت، وهو المصطلح الذی یبدو أکثر ترویعا مما یستحق، قد أثار مرة أخرى حالة من الهستیریا فی أرکان السوق. فی کل مرة یتقاطع فیها متوسطان متحرکان، یظهر جیش صغیر من الأنبیاء الذین نصبوا أنفسهم، متشبثین بخطوط الاتجاه کما لو کانت کتابًا مقدسًا. ولکن، کالعادة، data یسخر من الدراما. فی المرة الأخیرة التی ظهر فیها هذا التشکیل نفسه، SUI لم یمت، بل ارتفع تسعة أضعاف. هذا لیس نذیر الهلاک. إنه تذکیر بأن السوق، على عکس الخرافات، لا یهتم بالتوقعات البشریة. وإلى أن تؤکد الارتفاعات الأعلى والقیعان الأعلى نفسها، وحتى تصبح المقاومة دعمًا، تظل فکرة الاتجاه الصعودی المتجدد طموحة ولیست تجریبیة. إن التعامل مع المتوسط المتحرک على أنه تنبؤی یعنی إرباک مرآة الرؤیة الخلفیة للطریق أمامک. إنه یخبرنا بما کان، ولیس بما سیکون. ومع ذلک، یصر التجار على التعامل مع الأمر باعتباره أمرًا مقدسًا، ثم یلعنون السوق بسبب إیمانهم فی غیر محله عندما لا یمتثل السعر. من المحتمل أن یحدث ارتفاع على المدى القصیر، کما یحدث غالبًا عندما تجتمع الهستیریا مع عدم التوازن الفنی. ولکن من دون تأکید الهیکل، فإن مثل هذه الارتفاعات لیست أکثر من مجرد فترات راحة، وتوقفات رحیمة فی عملیة غیر مبالیة لاکتشاف الأسعار. رطب إخلاء المسؤولیة ==================================================================================================== هذه لیست نصیحة مالیة. إذا کنت تقوم بالتداول لأن أحد الأشخاص على الإنترنت کتب عبارة "صلیب الموت" بأحرف غامقة، فأنت تستحق کل التقلبات العاطفیة التی تلی ذلک. لا یهمنی إذا کنت صعودیًا أو هبوطیًا أو تشعر بالملل فقط، أو إذا خسرت أموالًا، فهذا لیس "مؤامرة للتلاعب بالسوق"، بل أنت مخطئ فقط. قم بالبحث الخاص بک، وقم بإدارة المخاطر الخاصة بک، ویرجى، من أجل الجمیع، التوقف عن التعامل مع المتوسطات المتحرکة وکأنها أوراق التارو.
without_worries
آیا ریزش بزرگ XRP تا ۷۵ سنت در راه است؟ تحلیل هشداردهنده نوامبر ۲۰۲۵
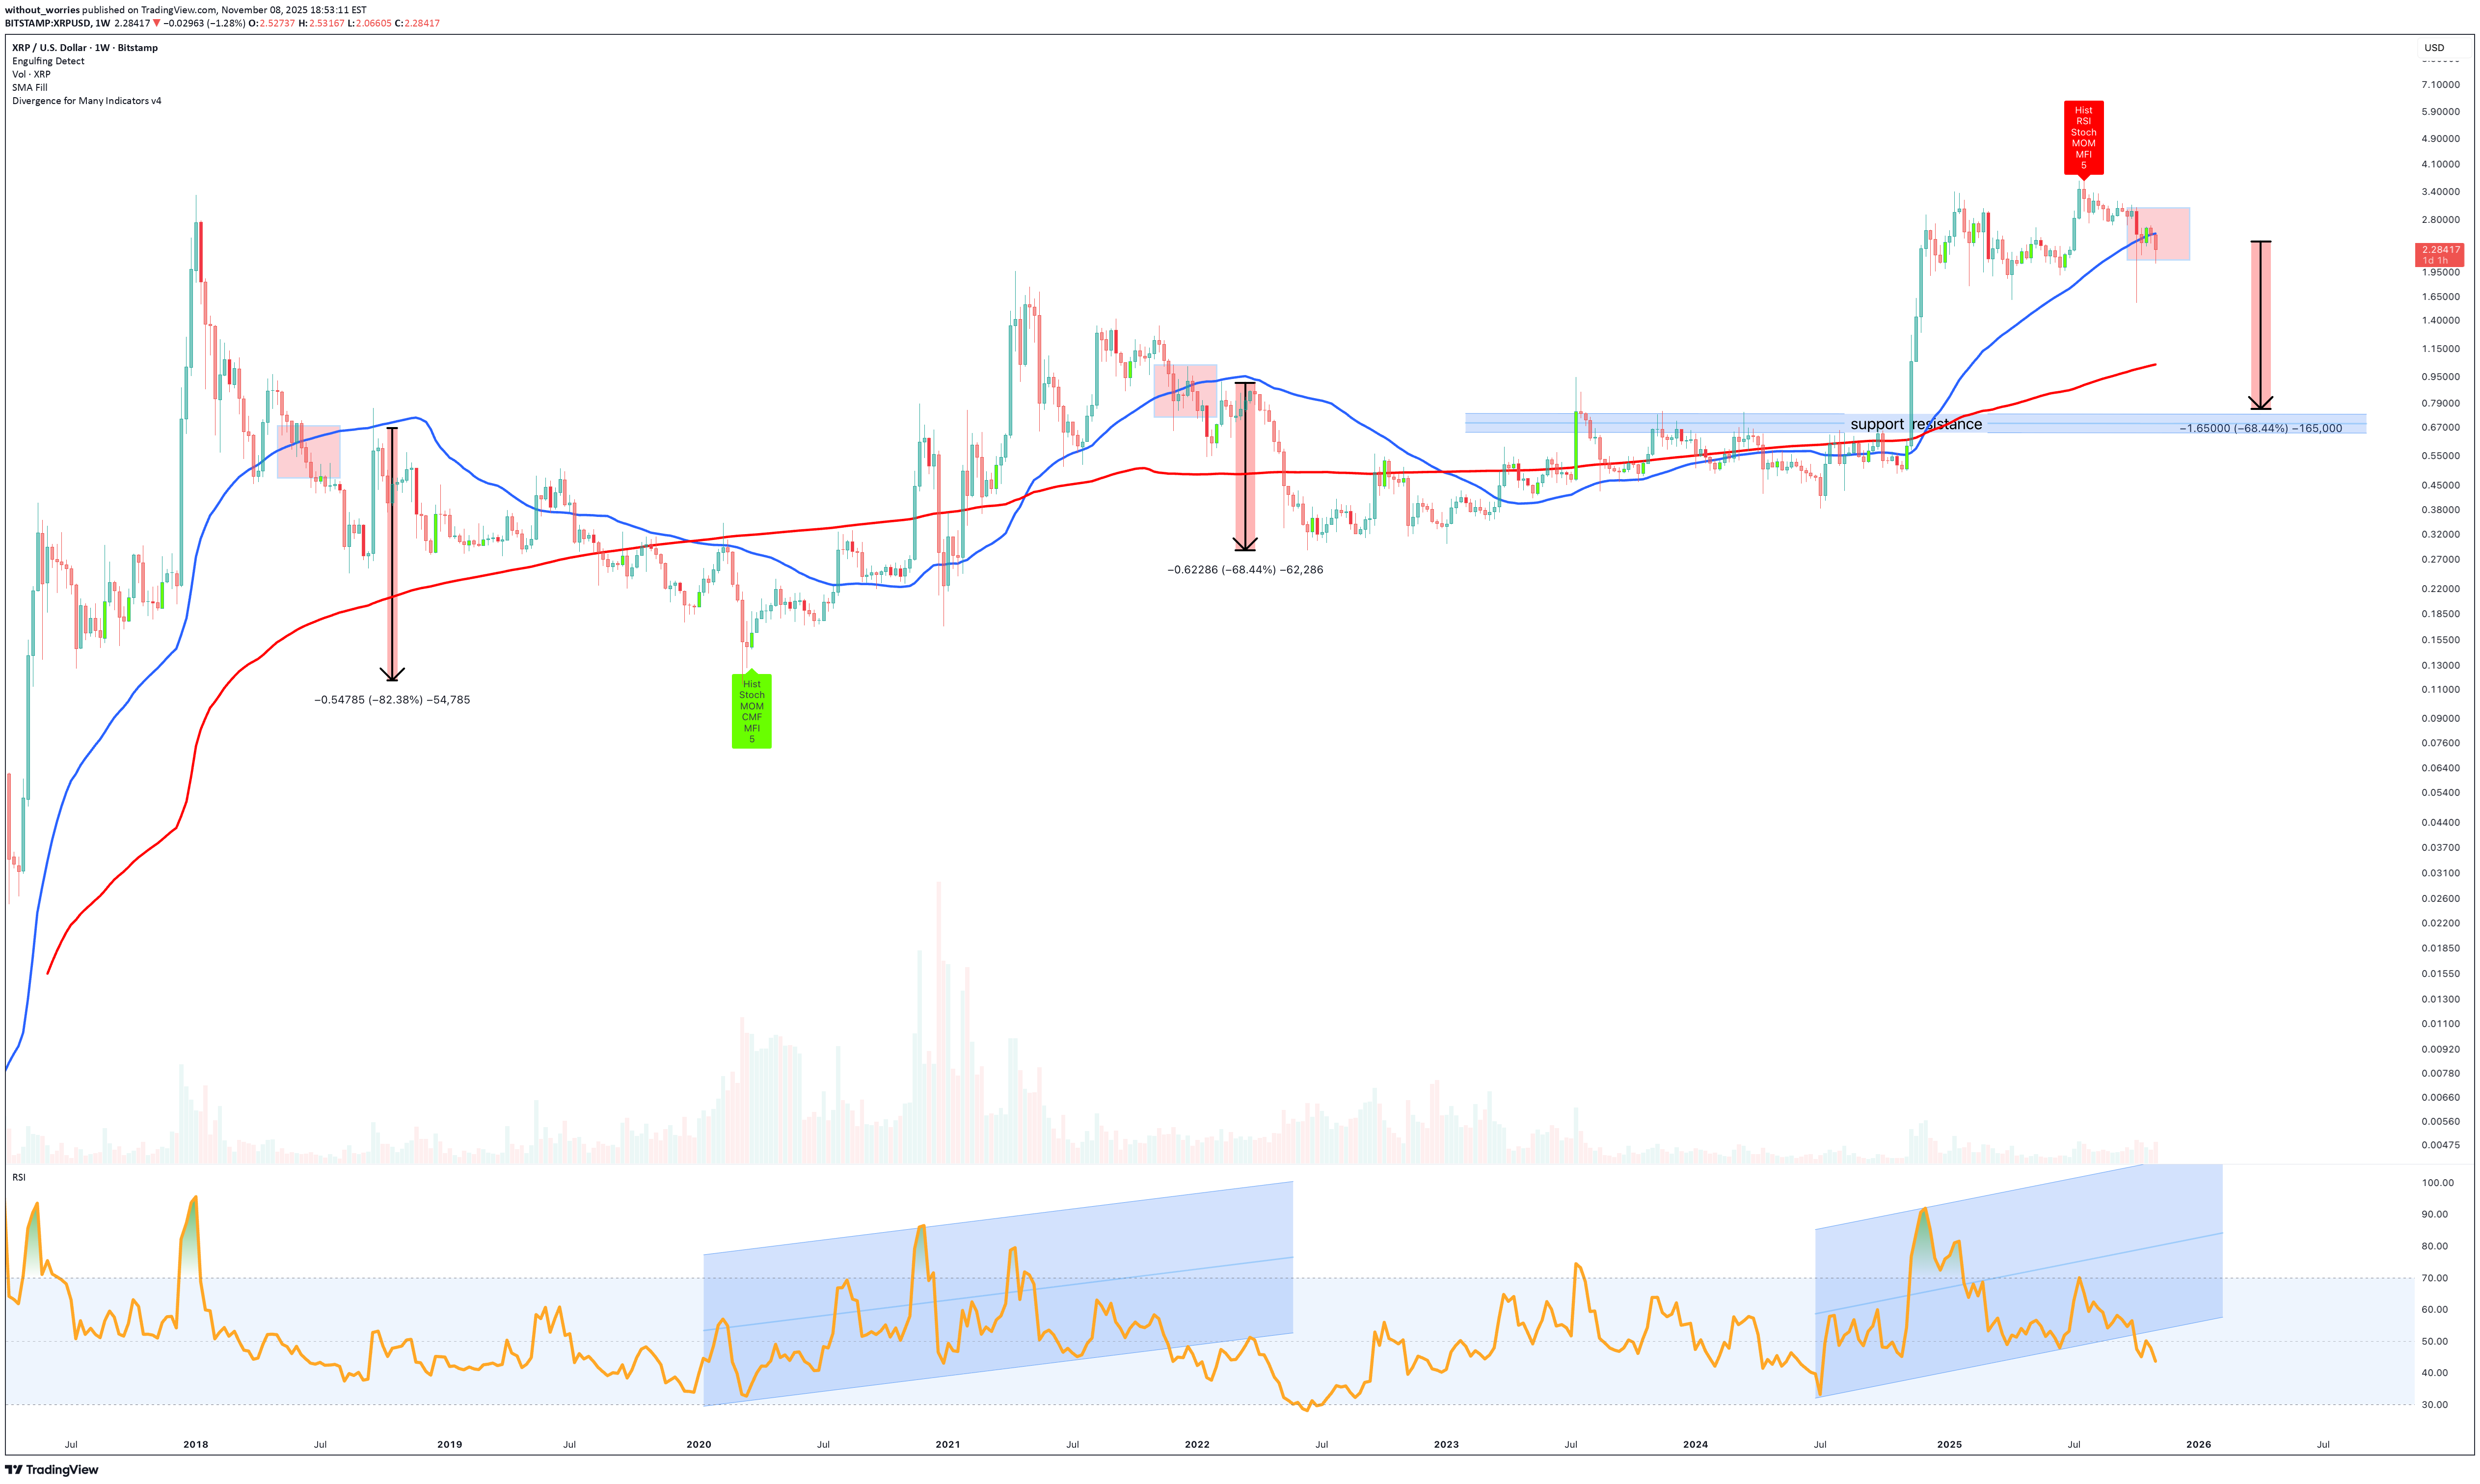
هل XRP على وشک الانهیار بشکل أسرع من أی شخص نباتی فی حفلة شواء؟ الفکرة " XRP هل یتجه نحو تصحیح 70% إلى 60 سنتا؟ تم نشره عند حوالی 2.90 دولارًا أمریکیًا بعد ارتفاع حرکة السعر بنسبة 1000٪ تقریبًا طوال عام 2024. واستمرت حرکة السعر فی الارتفاع حتى 3.30 دولارًا أمریکیًا فی الأسابیع المقبلة. ومن الطبیعی أن یشعر الکثیرون بالاستیاء من أی ناشر یتجرأ على الإشارة إلى أن المستثمرین قد یفعلون شیئًا فظیعًا، مثل البیع بعد تحقیق أرباح ضخمة. لأن کسب المال لیس هو اللعبة، لا. إن التعهد بالولاء والإیمان الذی لا یتزعزع هو الطریق الحقیقی للحریة المالیة. وإذا کنت تعتقد ذلک، فسأخبرک بشیء آخر... Trump وشرکاه تعملان فی مجال الأعمال الخیریة. تستمر صیحات الجمهور فی التسلیة "سیتم استبدال Swift بـ Ripple"، و"Blackrock تتوسع بشکل کبیر"، و"لماذا لا تتعلم قراءة الرسوم البیانیة؟"، وکل قمة فی السوق هی نفسها. النشوة السائلة. التقنیة یظهر تطور جدیر بالملاحظة على الرسم البیانی الأسبوعی أعلاه. وهو تطور کان قاتلاً لأی مستثمر طویل الأمد استمر فی تجاهل الدورات السابقة. بمجرد أن أغلقت حرکة السعر جسم الشمعة تحت المتوسط المتحرک البسیط لمدة 50 أسبوعًا، انخفض السوق مثل الحجر. بعد طبعة التباعد الهبوطی فی یولیو (بنفس قوة طبعة التباعد الصعودی فی مارس 2020 عند 14 سنتًا)، استمرت حرکة السعر فی کسر هیکل السوق. لم یکن المضاربون على الارتفاع منزعجین من هذا التطور على ما یبدو، ولکن الآن هناک تطور أکثر خطورة، وهو انهیار المتوسط المتحرک البسیط لمدة 50 أسبوعًا. الدعم والمقاومة حالیا حوالی 70 سنتا. لم یتم تأکید الدعم أبدًا بعد الاختراق. تتوافق الانهیارات السابقة فی حرکة السعر بشکل جید مع تصحیح بنسبة 70٪ من شأنه أن یعید حرکة السعر إلى الاختراق فی حالة تکرار قوة التصحیح. الاستنتاجات XRP لقد فعل ذلک مرة أخرى، وخدع المؤمنین وجعلهم یعتقدون أن الأمر مختلف هذه المرة. "الأموال المؤسسیة قادمة"، "البنوک تشحن"، "سویفت انتهى!" نعم بالتأکید. وأنا البابا القادم. انظر، لقد فهمت، کل دورة تحتاج إلى بطل التمثیل الإیمائی الخاص بها. لکن هذه لیست ثورة. إنها دیجا فو بدقة عالیة. الرسم البیانی أعلاه لا یکذب، نفس الهیکل، نفس الإشارات، والآن نفس الانهیار الذی دام 50 أسبوعًا والذی انتهى تاریخیًا بالدموع. هذا لیس سحرًا، بل إحصائیات: هل أغلق تحت المتوسط المتحرک البسیط لمدة 50 أسبوعًا؟ → -60% إلى -80% فی کل مرة. مؤشر القوة النسبیة؟ یتقلب مثل الإغماء goat. یدعم؟ لم یتم تأکیده أبدًا. کل شیء على ما یرام هناک، مختبئًا على مرأى من الجمیع بینما یستمر المؤثرون فی الصراخ "صعودی!" من قصورهم على الیوتیوب. یمکن أن ترتد؟ بالتأکید. القطط المیتة تفعل ذلک أیضًا. ولکن عندما یکون کل ارتفاع منخفض مصحوبًا بضوضاء أعلى واقتناع أضعف، فإنک بذلک تحصل على قدر أقل من "الاستثمار" وأکثر من تجربة علم نفس الحرکة الحیة. إذًا، هل XRP على باب الموت؟ دعنا نقول فقط أنه یطرق بأدب والباب مفتوح بالفعل. رطب إخلاء المسؤولیة هذه لیست نصیحة مالیة. بوضوح. إذا کنت تعتمد إستراتیجیتک الاستثماریة على ما یقوله بعض الأشخاص على الإنترنت الذین لدیهم إمکانیة الوصول إلى حساب TradingView، فأنت تستحق أی مأساة سینمائیة تأتی بعد ذلک. أنا لا أعمل لدى Ripple، ولا أکره Ripple، وبالتأکید لا أعتقد أن Ripple ستحل محل Swift، إلا إذا توقف Swift عن العمل فجأة ونسی کیفیة کسب المال. لذا، قم بإجراء البحث الخاص بک، وقم بإدارة المخاطر الخاصة بک، ومن أجل حب کل الأشیاء المقدسة، توقف عن الخلط بین الهوبیوم ونموذج الأعمال. إذا XRP أقمار، عظیم، أخبرنی بکل شیء عنها بینما أتظاهر بالاهتمام. إذا انهار السعر بنسبة 80%، حسنًا... لا تقل أن المتوسطات المتحرکة لم تحذرک.
إخلاء المسؤولية
أي محتوى ومواد مدرجة في موقع Sahmeto وقنوات الاتصال الرسمية هي عبارة عن تجميع للآراء والتحليلات الشخصية وغير ملزمة. لا تشكل أي توصية للشراء أو البيع أو الدخول أو الخروج من سوق الأوراق المالية وسوق العملات المشفرة. كما أن جميع الأخبار والتحليلات المدرجة في الموقع والقنوات هي مجرد معلومات منشورة من مصادر رسمية وغير رسمية محلية وأجنبية، ومن الواضح أن مستخدمي المحتوى المذكور مسؤولون عن متابعة وضمان أصالة ودقة المواد. لذلك، مع إخلاء المسؤولية، يُعلن أن المسؤولية عن أي اتخاذ قرار وإجراء وأي ربح وخسارة محتملة في سوق رأس المال وسوق العملات المشفرة تقع على عاتق المتداول.