
DOT
پولکادات
| تریدر | نوع سیگنال | حد سود/ضرر | زمان انتشار | مشاهده پیام |
|---|---|---|---|---|
 AAK_رتبه: 303 | خرید | حد سود: تعیین نشده حد ضرر: تعیین نشده | ۱۴۰۴/۹/۲۸ | |
 Sohaib_zafar007رتبه: 2898 | خرید | حد سود: تعیین نشده حد ضرر: تعیین نشده | ۱۴۰۴/۹/۲۷ | |
 SaykoCryptoرتبه: 30928 | خرید | حد سود: تعیین نشده حد ضرر: تعیین نشده | ۱۴۰۴/۱۰/۶ | |
 SwallowAcademyرتبه: 30658 | خرید | حد سود: تعیین نشده حد ضرر: تعیین نشده | ۱۴۰۴/۱۰/۱ | |
خرید | حد سود: تعیین نشده حد ضرر: تعیین نشده | ۱۴۰۴/۱۰/۹ |

نمودار قیمت پولکادات
سود ۳ ماهه :
خلاصه سیگنالهای پولکادات
سیگنالهای پولکادات
فیلتر
مرتب سازی پیام براساس
نوع پیام
نوع تریدر
فیلتر زمان
سطح عرضه/تقاضا در دات کوین (DOT): منتظر چه جهشی باشیم؟

بازار برای ادامه روند صعودی بیشتر به اصلاحی نیاز دارد. منطقه تقاضا برای جهش احتمالی مشخص شده است

پولکادات (DOT/USD) در آستانه انفجار؟ تحلیل الگوی انباشت وایکاف در تایم فریمهای بزرگ

DOTUSD -> تجمع Wyckoff بالقوه این برای من شبیه مدل 1 Wyckoff Accumulation است. در بازه زمانی ماهانه آشکار است، اما در هفتگی واضح تر است. اگر اینطور باشد، در حال حاضر ما در فاز بهار wyckoff هستیم. نظر شما چیست؟

Setupsfx_
#DOTUSDT: Three Targets Swing Buy With Final Target At $12

تجزیه و تحلیل هفتگی DOTUSDT بر اساس مفهوم پول هوشمند🏆📊 🔺در طی دو هفته گذشته، ما متوجه تغییری در نحوه حرکت قیمتها و میزان قوی بودن روند شدهایم، که ممکن است به این معنی باشد که از سطح 2.139 به سمت بهتر شدن میرویم. پیش از این، زمانی که DOTUSDT از بالاترین نقطه خود یعنی 11.94 سقوط کرد، به نظر می رسید که روند نزولی همچنان ادامه دارد. اما اکنون، ما امیدواریم که از این خط روند عبور کنیم، که می تواند منجر به افزایش قیمت ها به سمت سه هدف تعیین شده ما شود. 🔺زمان خوبی برای پرش زمانی است که خط روند نزولی قطعا شکسته شده باشد. از آنجایی که بازارهای ارزهای دیجیتال می توانند بسیار غیرقابل پیش بینی باشند، مهم است که صبور باشید. ما واقعاً استفاده از تکنیک های مدیریت ریسک قوی را توصیه می کنیم، زیرا این نوع دارایی می تواند نسبت به سرمایه گذاری های معمولی نوسانات بیشتری داشته باشد. همچنین، ما سه نقطه قیمت مختلف را پیدا کردهایم که میتوانید در مورد کسب سود فکر کنید، و ایده خوبی است که اینها را با آنچه فکر میکنید و میزان ریسکی که با آن راحت هستید مطابقت دهید. 🔺ما دوست داریم نظر شما را درباره این تحلیل و اگر سوالی دارید بدانیم. اگر میخواهید بیشتر بدانید، لطفاً بهروزرسانیهای ما را دنبال کنید. تنظیمات تیمFX_👨💻💥
پولکادات (DOT) در کانال نزولی گیر افتاده است: آیا فرصت صعودی از دست رفت؟

DOT همچنان به یک کانال نزولی به خوبی تعریف شده در بازه زمانی 4H احترام می گذارد. قیمت اخیراً به مرز بالایی فشار آورد، اما نتوانست بالاتر از آن نگه داشته شود، و در نتیجه رد شدن و ادامه در داخل ساختار انجام شد. این رفتار تأیید می کند که کانال معتبر باقی می ماند و عرضه همچنان در مقاومت فعال است. تا زمانی که قیمت زیر خط روند بالایی معامله می شود، هر صعودی move باید به عنوان یک عقب نشینی اصلاحی به جای معکوس شدن روند تلقی شود. برای تغییر ساختاری به سمت بالا، DOT نیاز به شکست تمیز و پذیرش بالاتر از مقاومت کانال و به دنبال آن پایینترین سطح دارد. تا زمانی که این اتفاق نیفتد، سوگیری محتاطانه باقی میماند و بر واکنشها در سطوح کلیدی تمرکز میکند تا پیشبینی بروز رخدادها.
DOT: locally long idea

dot چه از نظر محلی و چه از نظر ساختاری طولانی به نظر می رسد. ما باید نقدینگی انباشته شده درازمدت را حذف کنیم و سپس می توانیم بلند شویم. این ایده است! این یک راه اندازی نیست. اگر این مدل را ایجاد کنیم، وارد شده ایم. اگر شکست بخوریم، فقط از آن می گذریم! DOTUSDT.PTAKE

CryptoAnalystSignal
#DOT/USDT Ready to go higher
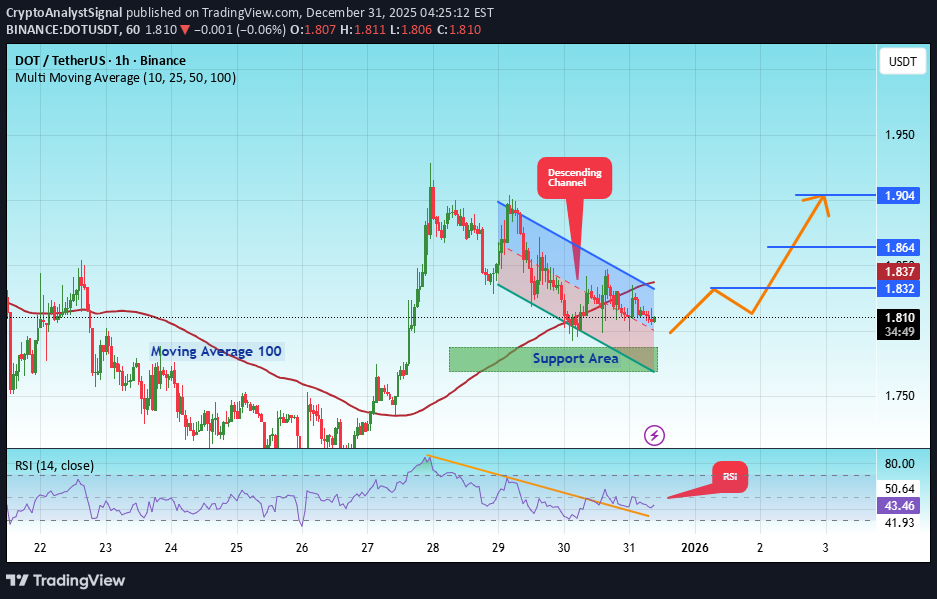
#DOT قیمت در یک کانال نزولی در بازه زمانی 1 ساعته در حال حرکت است. به مرز پایینی رسیده است و در حال حرکت به سمت شکستن بالای آن است و انتظار میرود که مرز بالایی آزمایش مجدد شود. ما یک روند نزولی در اندیکاتور RSI داریم که نزدیک به مرز پایینی رسیده است و انتظار می رود یک بازگشت صعودی داشته باشد. یک منطقه حمایت کلیدی به رنگ سبز در 1.77 وجود دارد. قیمت چندین بار از این منطقه جهش کرده است و انتظار می رود که دوباره افزایش یابد. ما یک روند به سمت ثبات بالاتر از میانگین متحرک 100 دوره ای داریم، زیرا به آن نزدیک می شویم، که از movement صعودی پشتیبانی می کند. قیمت ورودی: 1.80 هدف اول: 1.83 هدف دوم: 1.86 هدف سوم: 1.90 توقف ضرر: زیر ناحیه حمایت به رنگ سبز. یک چیز ساده را فراموش نکنید: مدیریت سرمایه. برای سوالات لطفا نظر بدهید ممنون.#DOT هدف اول: 1.83 رسیده است هدف دوم: 1.86 به #DOT رسید هدف اول: 1.83 رسیده است هدف دوم: 1.86 رسیده است هدف سوم: 1.90 رسیده است
Wedge Breakout, Bull Flag, & All Time Low

تجزیه و تحلیل فنی نمودار 1 بعدی. یک الگوی پرچم داخلی bar در یک کانال موازی پس از شکستن الگوی گوه نزولی که در مثلث سبز مایل به آبی برجسته شده است، شکل میگیرد. پشتیبانی فوری در پایین کانال موازی پرچم گاو است. پشتیبانی بعدی و قویتر در خط روند نزولی white است که 3 بازدید در بازه زمانی بسیار طولانیتری داشته است: (اول) ابتدا از پایینترین قیمت محوری 4.224 دلار در 30 دسامبر 2022 شروع میشود، اتصال به (دومین) دومین پایینترین پیوت از 3.566 دلار در 19 اکتبر 2023 و در نهایت اتصال به آخرین Thir (اتل سوم) 1.654 دلار در جمعه گذشته، 26 دسامبر. قیمت باید از بالای کانال موازی یک move افزایش یابد تا منطقه مقاومت اخیر برجسته شده در جعبه بنفش را آزمایش کند. اگر قیمت از ناحیه مقاومت بنفش بین 2.35 تا 2.54 دلار عبور کرد، به دنبال تست سطح مقاومت بعدی 3.377 دلار باشید که با خط red مشخص شده است. به طور کلی، این یک راهاندازی صعودی بسیار مناسب است که از پایینترین حد خود در حال افزایش است.
WEDGE BREAKOUT, BULL FLAG, ALL TIME LOW

تجزیه و تحلیل فنی نمودار 1 بعدی. یک الگوی پرچم داخلی bar در یک کانال موازی پس از شکستن الگوی گوه نزولی که در مثلث سبز مایل به آبی برجسته شده است، شکل میگیرد. پشتیبانی فوری در پایین کانال موازی پرچم گاو است. پشتیبانی بعدی و قویتر در خط روند نزولی white است که 3 بازدید در یک بازه زمانی بسیار طولانیتر داشته است: (اول) ابتدا از پایینترین قیمت محوری 4.224 دلار در 30 دسامبر 2022 شروع شد، اتصال به (دومین) دومین پایینترین قیمت از 3.566 دلار در 19 اکتبر 2023 و در نهایت اتصال به سومین (پایین ترین) ATL. 1.654 دلار در جمعه گذشته، 26 دسامبر. برای آزمایش ناحیه مقاومت اخیر که در کادر بنفش مشخص شده است، قیمت باید یک move بالا باشد. اگر قیمت از ناحیه مقاومت بنفش بین 2.35 تا 2.54 دلار عبور کرد، به دنبال تست سطح مقاومت بعدی 3.377 دلار باشید که با خط red مشخص شده است. به طور کلی، این یک راهاندازی صعودی بسیار مناسب است که از پایینترین حد خود در حال افزایش است.

citexco_trade
DOT.USDT

ما یک ساختار هفت موجی داریم که قطری است و در حال تکمیل است. تکمیل این موج می تواند یک move موقتی خوب ارائه دهد.
پولکادات (DOT) در آستانه تصمیمگیری بزرگ: آیا کانال نزولی شکسته میشود؟

DOT به یک کانال نزولی تمیز احترام می گذارد، با قیمت به طور مداوم در هر دو مرز واکنش نشان می دهد. جهش اخیر از خط روند پایین تر تأیید می کند که تقاضا همچنان در این سطح وجود دارد و این منطقه را از نظر فنی قابل توجه می کند. قیمت در حال حاضر به مرز بالای کانال نزدیک می شود که به عنوان مقاومت پویا در سراسر روند نزولی عمل کرده است. شکست تایید شده و پذیرش بالای این خط روند، کانال نزولی را باطل میکند و در را برای تغییر روند گستردهتر باز میکند. تا زمانی که یک شکست رخ دهد، این یک ساختار اصلاحی باقی می ماند. واکنش در اینجا تعیین می کند که آیا DOT به مرحله بازیابی منتقل می شود یا به تثبیت در داخل کانال ادامه می دهد.
سلب مسئولیت
هر محتوا و مطالب مندرج در سایت و کانالهای رسمی ارتباطی سهمتو، جمعبندی نظرات و تحلیلهای شخصی و غیر تعهد آور بوده و هیچگونه توصیهای مبنی بر خرید، فروش، ورود و یا خروج از بازارهای مالی نمی باشد. همچنین کلیه اخبار و تحلیلهای مندرج در سایت و کانالها، صرفا بازنشر اطلاعات از منابع رسمی و غیر رسمی داخلی و خارجی است و بدیهی است استفاده کنندگان محتوای مذکور، مسئول پیگیری و حصول اطمینان از اصالت و درستی مطالب هستند. از این رو ضمن سلب مسئولیت اعلام میدارد مسئولیت هرنوع تصمیم گیری و اقدام و سود و زیان احتمالی در بازار سرمایه و ارز دیجیتال، با شخص معامله گر است.