
SUN
سان
| تریدر | نوع سیگنال | حد سود/ضرر | زمان انتشار | مشاهده پیام |
|---|---|---|---|---|
 DragonCaoBرتبه: 2773 | خرید | حد سود: تعیین نشده حد ضرر: تعیین نشده | ۱۴۰۴/۹/۲۳ | |
 BullBearBTC1رتبه: 31226 | خرید | حد سود: تعیین نشده حد ضرر: تعیین نشده | ۱۴۰۴/۹/۲۴ | |
 Alpha-GoldFXرتبه: 32114 | خرید | حد سود: تعیین نشده حد ضرر: تعیین نشده | ۱۴۰۴/۹/۲۲ |
نمودار قیمت سان
سود ۳ ماهه :
سیگنالهای سان
فیلتر
مرتب سازی پیام براساس
نوع پیام
نوع تریدر
فیلتر زمان
BullBearBTC1
تحلیل بلندمدت SUN/USDT: نقاط ورود دقیق و سطوح سود (1R و 2R)
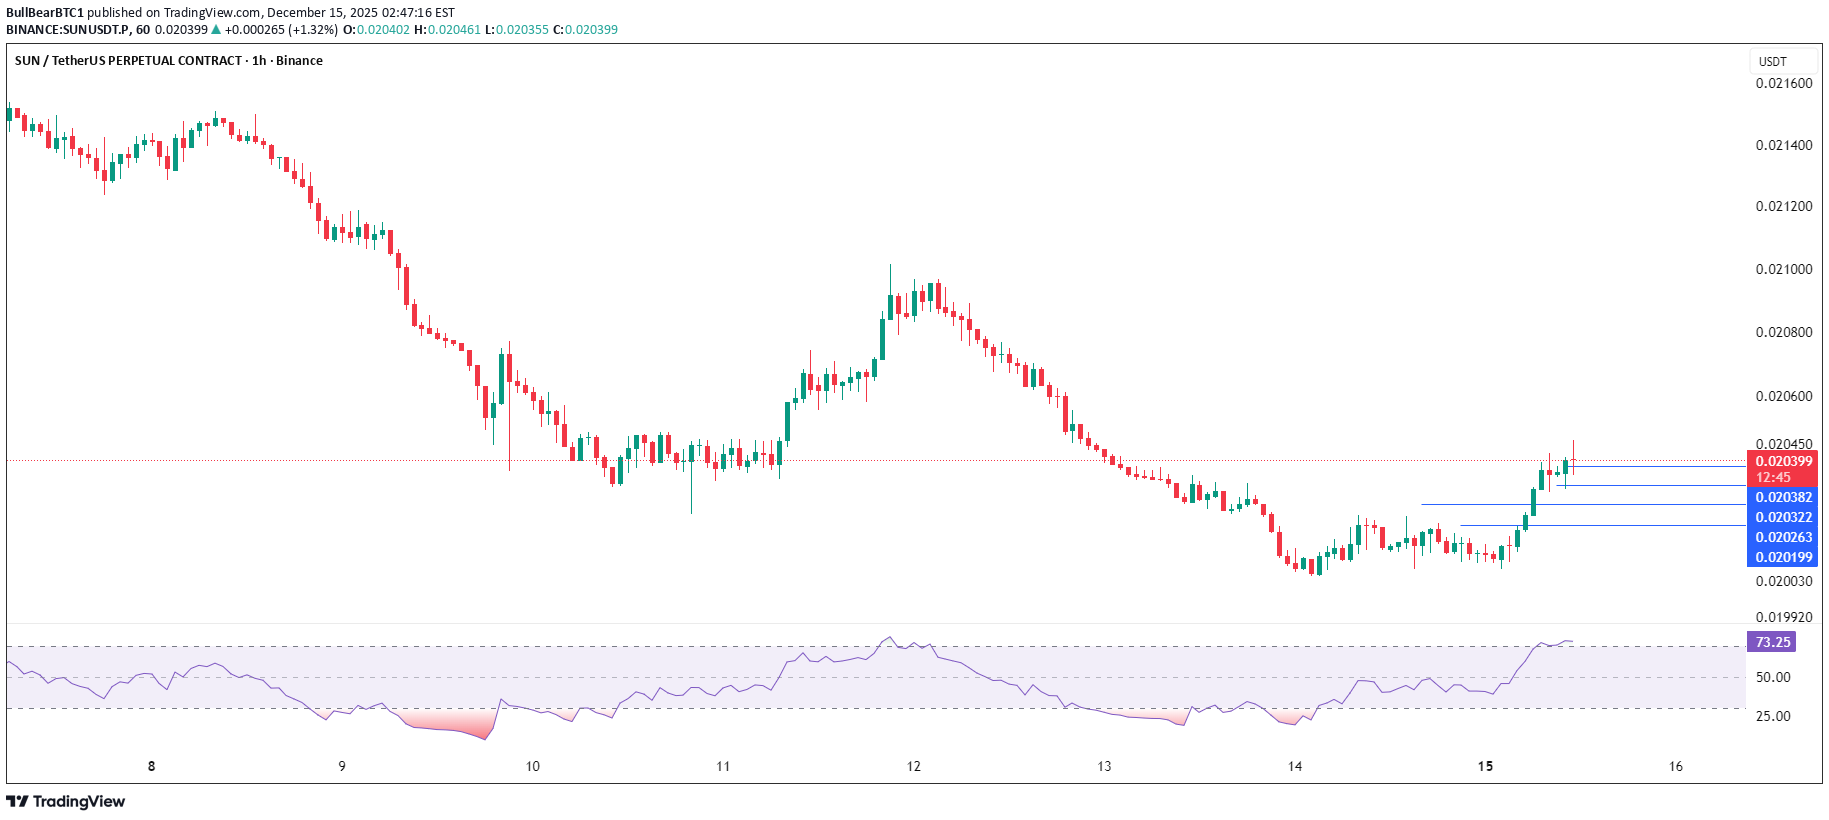
ورود به عقب در صورت ایجاد بالاترین جدید نامعتبر است ایده طولانی با ورودی های ذکر شده در نمودار. تجارت 1R و 2R
DragonCaoB
سیگنال خرید قوی: خورشید (SUN) در آستانه انفجار صعودی! (تحلیل تکنیکال)
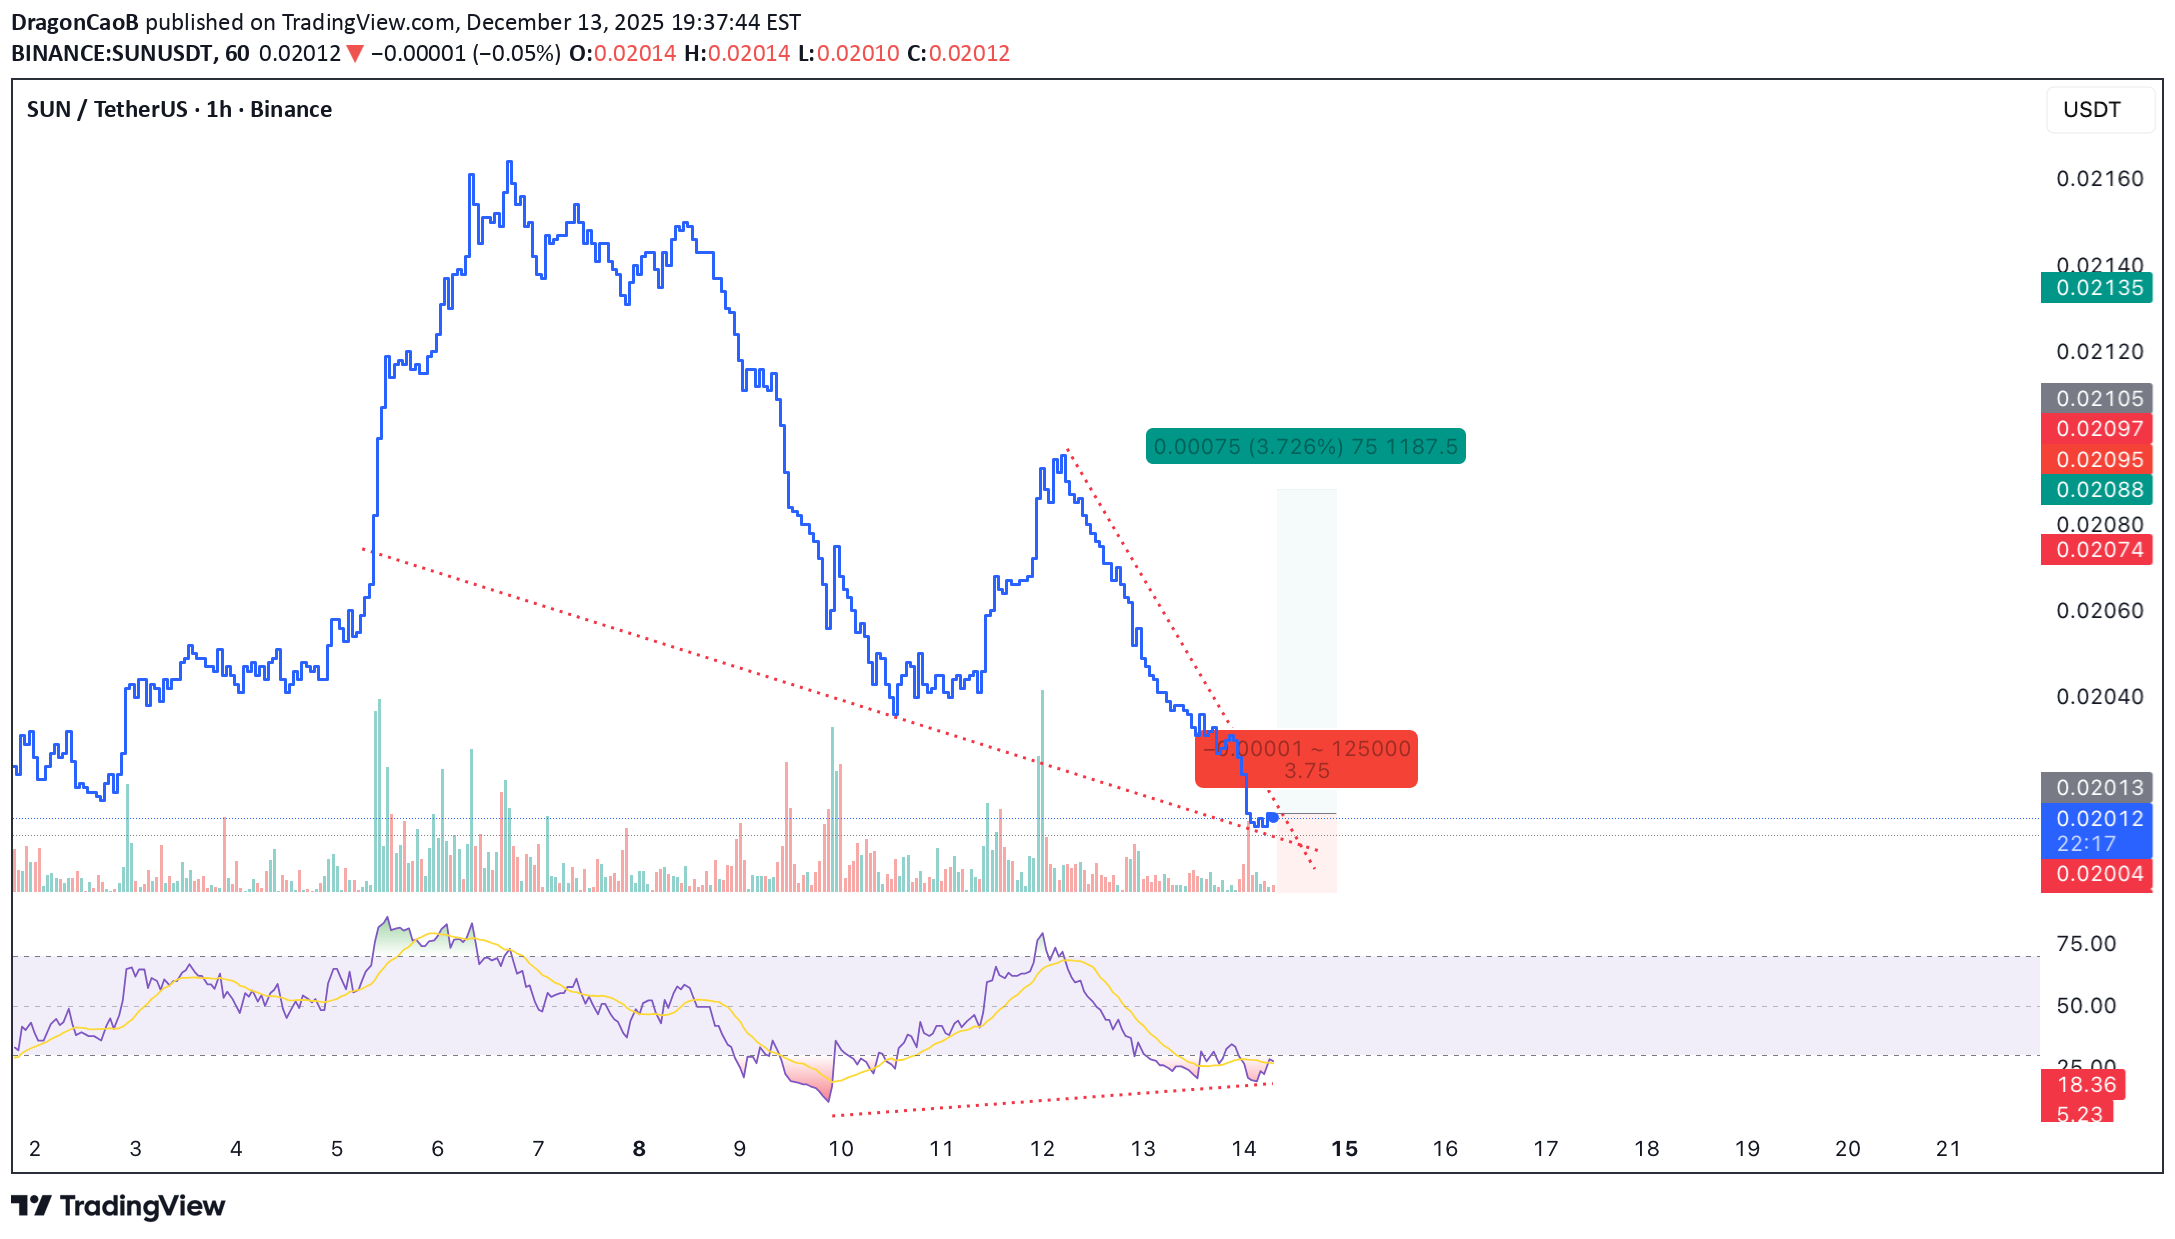
🐂 پوست سر بلند - SUN SUN در بازه زمانی 1 ساعت به شدت بیش از حد فروخته می شود که نشان دهنده فرسودگی در سمت فروش است. اقدام قیمت در حال فشردهسازی و نزدیک شدن به یک ساختار شکست کلاسیک است، که نشان میدهد شتاب برای گسترش شدید صعودی ایجاد میشود. یک شکست صعودی قوی پیش بینی می شود. 🎯 TP: 0.02088 🛡️ SL: 0.01993 📊 RR: 1: 3.75 تنظیم طولانی با کیفیت بالا: شرایط فروش بیش از حد یک ساعت + ساختار شکست → پتانسیل بازگشت قوی با ریسک به پاداش جذاب.
Alpha-GoldFX
سیگنال صعودی بزرگ در SUNUSDT: منتظر جهش ۵۰ درصدی باشید!
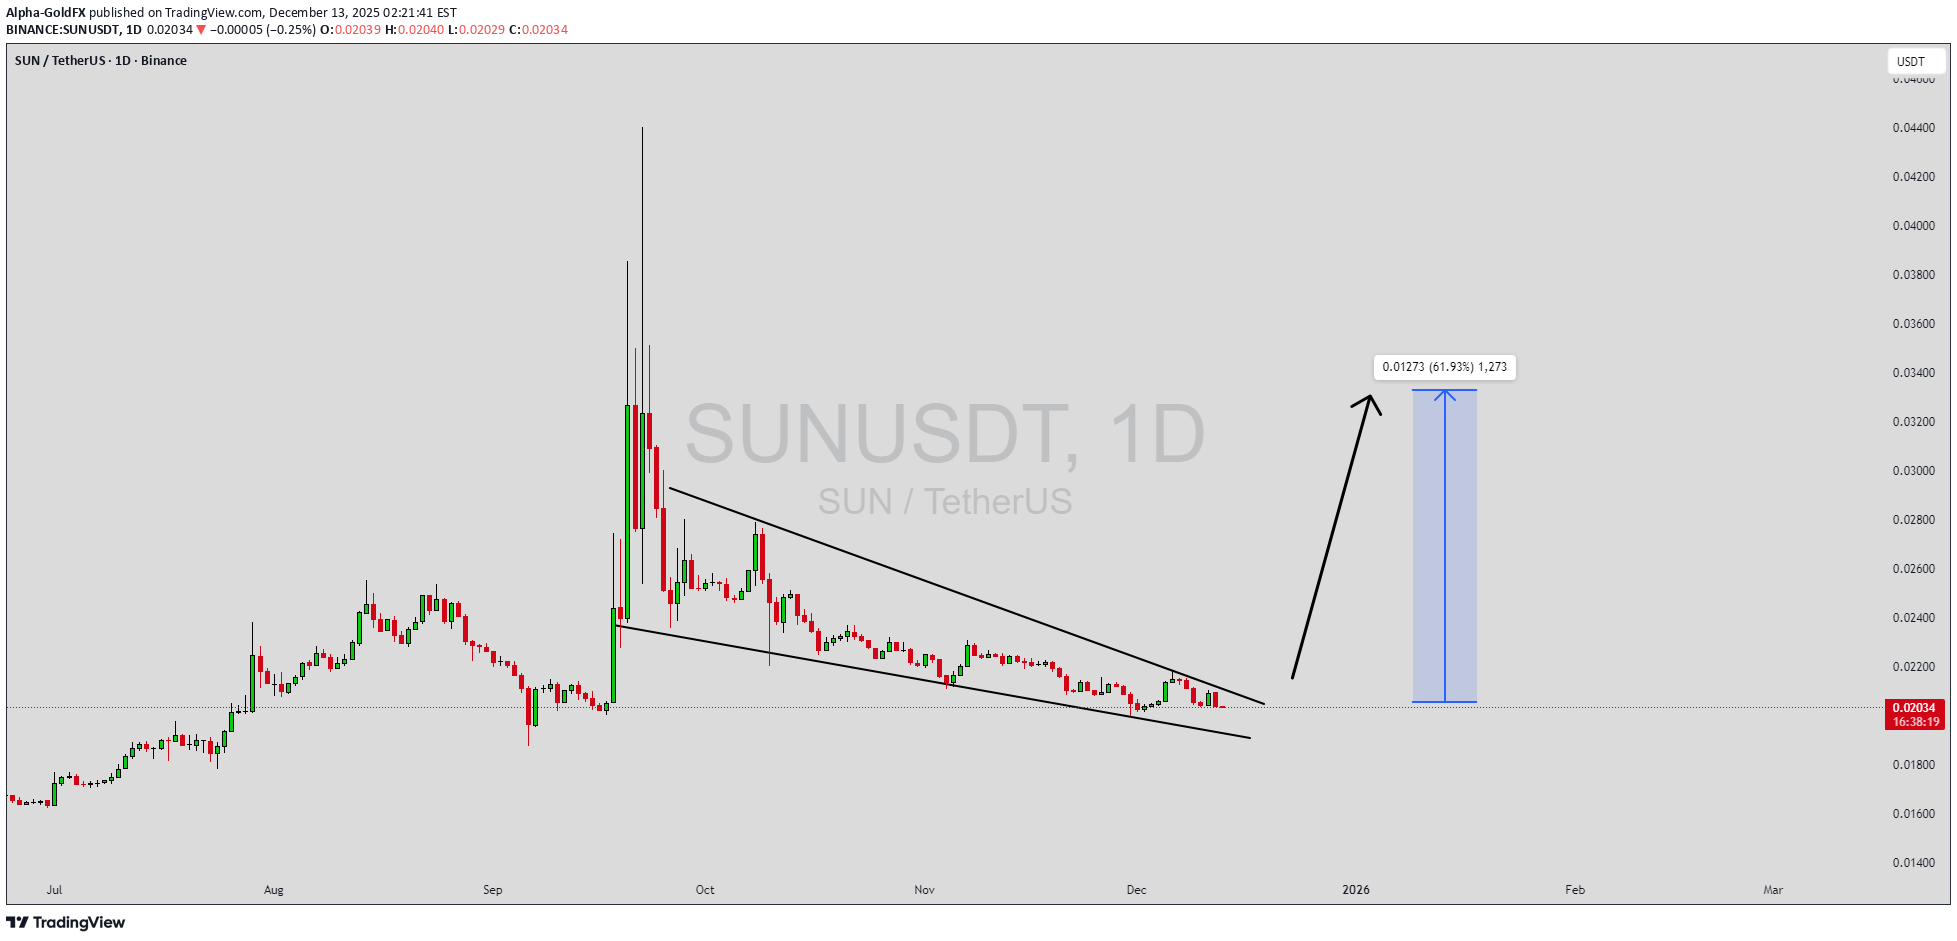
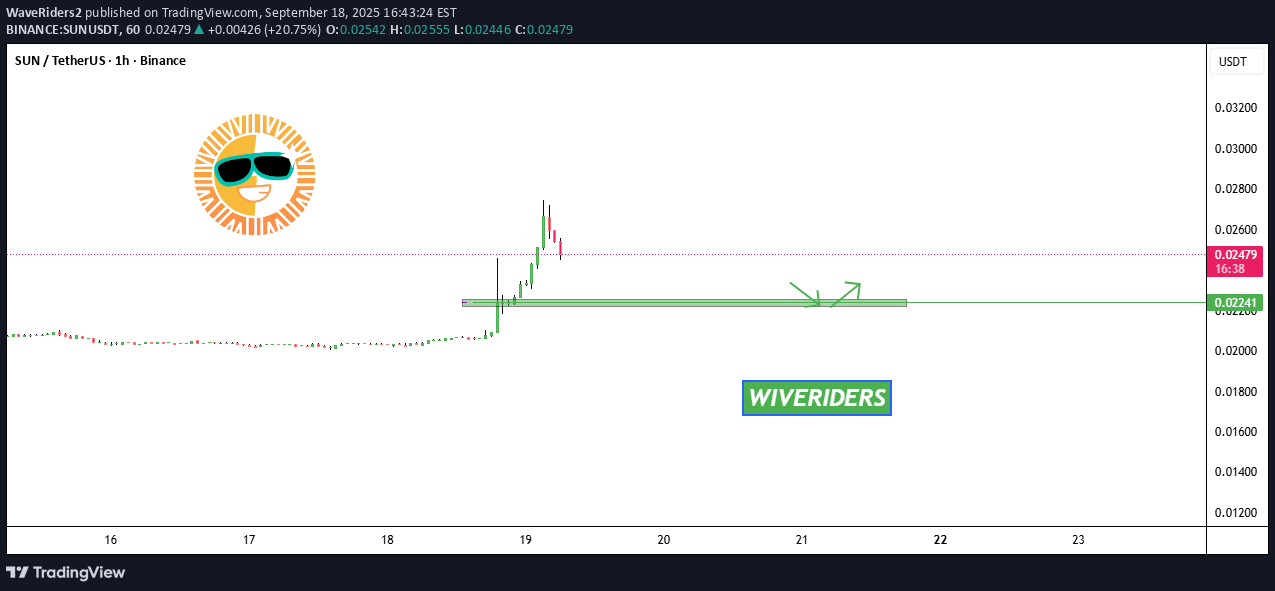
SUNUSDT در حال تشکیل یک الگوی گوه سقوطی واضح است، یک سیگنال بازگشتی کلاسیک صعودی که اغلب نشاندهنده شکست آینده است. قیمت در یک محدوده باریک تثبیت شده است، که نشان می دهد فشار فروش در حال تضعیف است در حالی که خریداران شروع به بازپس گیری کنترل می کنند. با حجم ثابتی که انباشت را در سطوح پایینتر تأیید میکند، تنظیم به یک شکست بالقوه صعودی soon اشاره میکند. پیش بینی شده move می تواند منجر به افزایش چشمگیر در حدود 50٪ تا 60٪ هنگامی که قیمت بالاتر از مقاومت گوه شود. این الگوی گوه نزولی معمولاً در پایان روندهای نزولی یا مراحل اصلاحی دیده میشود و نشاندهنده یک تغییر بالقوه در احساسات بازار از نزولی به صعودی است. معامله گرانی که از نزدیک SUUSDT را زیر نظر دارند، با نزدیک شدن به یک منطقه شکست، به تقویت حرکت توجه می کنند. حجم معاملات خوب به این الگو اعتماد میافزاید و نشان میدهد که فعالان بازار با پیشبینی یک معکوس، در موقعیت اولیه قرار میگیرند. علاقه فزاینده سرمایه گذاران به SUUSDT نشان دهنده افزایش اعتماد به مبانی بلندمدت پروژه و قدرت فنی فعلی است. اگر شکست با حجم پایدار تأیید شود، این می تواند شروع یک حرکت صعودی تازه باشد. معامله گران ممکن است این را یک راه اندازی ارزشمند برای سود میان مدت بدانند، به خصوص با تکمیل الگوی گوه و شتاب خرید شتاب. ✅ با زدن دکمه لایک و ✅ نظر خود را در زیر بنویسید (نظر شما در مورد این سکه چیست؟) بازخورد و مشارکت شما به من انگیزه می دهد تا تجزیه و تحلیل بازار روشن تر را با شما به اشتراک بگذارم!

Bithereum_io
تحلیل تکنیکال SUNUSDT: شکست گُوِه نزولی و اهداف قیمتی هیجانانگیز!
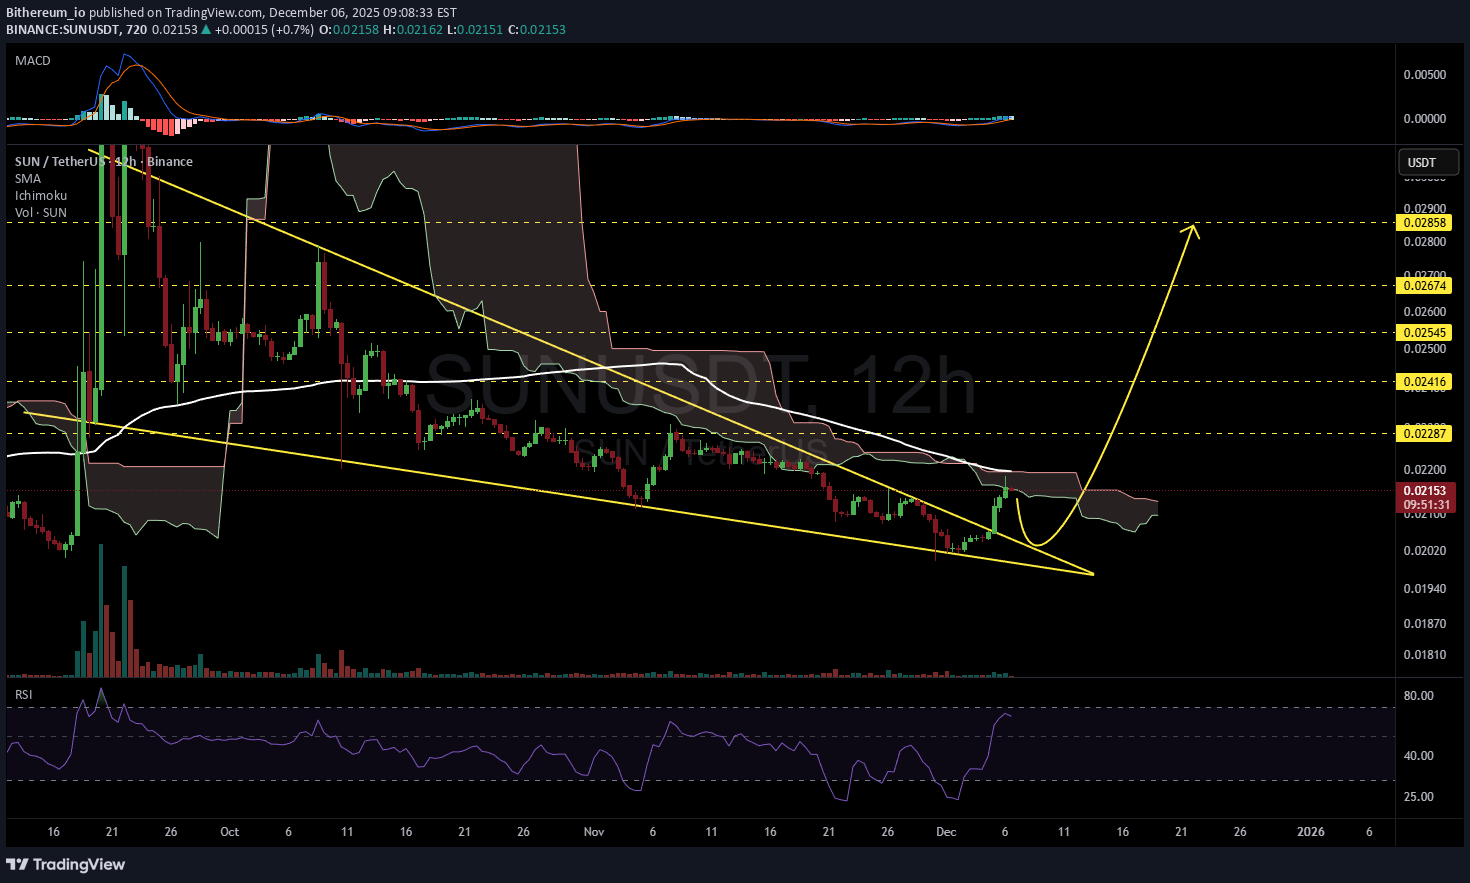
#SUN در نمودار تایم فریم ۱۲ ساعته، الگوی گوه نزولی (Falling Wedge) را شکسته و به سمت بالا حرکت کرده است و در حال حاضر با ابر ایچیموکو (Ichimoku cloud) و میانگین متحرک ساده ۱۰۰ (SMA100) در تایم فریم ۱۲ ساعته مواجه است؛ این موضوع ممکن است باعث یک پولبک (Pullback) برای بازآزمایی (رتست) گوه شود. در صورت شکست موفق و تثبیت بالای این سطوح، اهداف بالقوه عبارتند از: 🎯 $0.02287 🎯 $0.02416 🎯 $0.02545 🎯 $0.02674 🎯 $0.02858 ⚠️ همیشه به یاد داشته باشید که از حد ضرر (Stop-Loss) دقیق استفاده کرده و مدیریت ریسک مناسب را رعایت نمایید.

نوسانات اقتصاد جهانی: عامل اصلی تغییرات و چالشهای پیش رو

1. Understanding Fluctuations in the Global Economy Fluctuations refer to periodic or unpredictable changes in economic indicators such as GDP growth, employment levels, inflation, or market prices. These shifts can be short-term (cyclical), medium-term (structural), or long-term (systemic). Types of Fluctuations: Business Cycle Fluctuations: These are natural phases of expansion, peak, contraction, and recovery in an economy. Every country experiences these cycles, though their duration and intensity vary. Financial Market Fluctuations: Driven by investor sentiment, interest rates, and corporate performance, these include stock market rallies and crashes that influence global wealth and investment. Currency and Exchange Rate Fluctuations: Changes in the value of one currency against another affect trade competitiveness, inflation, and cross-border investments. Commodity Price Fluctuations: Volatile prices of oil, gold, natural gas, and agricultural goods can create inflationary or deflationary pressures worldwide. Geopolitical and Policy Fluctuations: Political instability, trade wars, and monetary policy changes often disrupt global supply chains and financial flows. These fluctuations are not random; they emerge from a complex interaction of economic fundamentals, investor behavior, and policy interventions. 2. Causes Behind Global Economic Fluctuations Understanding why fluctuations occur is crucial to managing their impact. Several interrelated factors trigger these shifts: Monetary and Fiscal Policy Changes: Central banks influence liquidity through interest rates and quantitative easing. When interest rates are low, borrowing increases, spurring growth. However, tightening measures to control inflation can slow down the economy, causing cyclical fluctuations. Global Supply and Demand Imbalances: A mismatch between production and consumption—such as oversupply in commodities or chip shortages in technology—creates price volatility. Technological Innovations: Innovations can disrupt existing industries. For instance, the rise of renewable energy affects oil prices, while AI and automation reshape job markets. Investor Psychology and Speculation: Markets are heavily influenced by collective emotion—fear and greed. A surge in optimism can inflate asset bubbles, while panic can trigger sharp corrections. Geopolitical Tensions and Conflicts: Wars, sanctions, and trade barriers affect global trade routes and resource availability, leading to supply shocks and inflationary spikes. Natural Disasters and Pandemics: Events like COVID-19 illustrate how quickly global production, logistics, and consumption patterns can be disrupted, leading to large-scale fluctuations. 3. The Domino Effect: How Fluctuations Spread Globally In today’s globalized economy, no country operates in isolation. Fluctuations in one economy can cascade through several channels: Trade Linkages: When demand drops in one major economy, exporters in others suffer. For instance, a slowdown in China can hurt commodity exporters like Brazil or Australia. Financial Markets: Global investors move capital rapidly between countries. A crisis in one market can trigger sell-offs across others, as seen during the 2008 financial crisis. Currency Transmission: Exchange rate volatility affects import-export competitiveness. A weakening yen, for example, can pressure South Korea’s exports. Commodity Channels: Oil price swings influence transportation costs, inflation rates, and household spending worldwide. Sentiment and Confidence: Even without direct exposure, economies can feel the psychological effects of global uncertainty, reducing investment and spending. 4. Impact on Different Sectors of the Global Economy A. Trade and Manufacturing Trade volumes fluctuate with changing demand and currency valuations. A strong dollar may make U.S. exports expensive, while a weaker rupee might boost India’s export competitiveness. Manufacturing sectors dependent on global supply chains—such as electronics or automobiles—are especially sensitive to such shifts. B. Energy and Commodities Oil and natural gas prices are key determinants of inflation and transportation costs. A sudden oil price surge can trigger global inflation, while a drop can hurt energy-exporting nations like Saudi Arabia or Russia. C. Financial Markets Stock indices mirror investor confidence. Bull markets encourage investment and innovation, while bear markets reduce liquidity and consumer spending. Fluctuations here affect everything from pension funds to venture capital. D. Employment and Wages During downturns, companies cut costs, leading to layoffs and wage stagnation. Conversely, economic expansions raise demand for labor, increasing incomes but sometimes fueling inflation. E. Developing Economies Emerging markets often bear the brunt of global volatility. Their currencies weaken faster, capital outflows rise, and inflation accelerates due to dependence on imported goods. 5. The Psychological and Social Ripple Effects Economic fluctuations don’t just affect balance sheets—they shape social behavior and confidence. When stock markets fall, households feel poorer, spending less and saving more. Consumer pessimism can then deepen recessions. Similarly, rising prices or unemployment can lead to political instability, protests, and shifts in leadership. Governments facing such pressures often turn to populist or protectionist measures, altering global policy landscapes. The social cost of economic instability is immense—ranging from increased inequality to reduced access to education and healthcare in developing regions. 6. Case Studies: Major Global Fluctuations A. The 2008 Financial Crisis Triggered by the U.S. housing bubble, this crisis spread globally through financial markets. Banks collapsed, trade volumes shrank, and unemployment surged worldwide. It illustrated how interconnected the global economy had become and led to reforms in banking regulations and monetary policy coordination. B. The COVID-19 Pandemic (2020–2021) The sudden halt in production, transportation, and consumption caused one of the sharpest global recessions in history. Yet, it also accelerated digital transformation and remote work adoption—showing how fluctuations can drive structural change. C. The Russia-Ukraine Conflict (2022–Present) This geopolitical event caused major energy and food supply disruptions. The resulting surge in oil and grain prices led to inflationary pressures in both developed and developing nations. D. Global Inflation Wave (2023–2024) As economies recovered post-pandemic, demand outpaced supply. Central banks raised interest rates aggressively, leading to sharp corrections in equity and bond markets. This episode reminded policymakers of the delicate balance between growth and stability. 7. Policy and Institutional Responses Governments and central banks play critical roles in mitigating the impact of fluctuations. Their responses can stabilize markets or, if misjudged, worsen volatility. Monetary Policies: Central banks use interest rate adjustments, bond purchases, and liquidity injections to influence credit availability and inflation. Fiscal Policies: Governments can increase public spending or reduce taxes to stimulate demand during downturns, or tighten budgets to cool overheated economies. Regulatory Reforms: Post-crisis regulations like Basel III enhanced global banking stability by improving liquidity and capital requirements. International Cooperation: Institutions like the IMF and World Bank provide financial aid and policy coordination to manage crises across borders. Market Transparency and Digitalization: Technologies like blockchain and AI now enhance real-time monitoring of global economic trends, reducing reaction delays. 8. Long-Term Effects: Evolution Through Fluctuation Though painful in the short term, fluctuations often lead to long-term growth and innovation. Crises expose weaknesses in economic systems, prompting reforms and resilience-building. For instance: The 2008 crisis accelerated the move toward digital banking. COVID-19 expanded e-commerce and remote working ecosystems. Energy market disruptions are fueling investment in renewables. Thus, fluctuations, while disruptive, serve as catalysts for modernization and adaptation. 9. Strategies to Navigate Global Fluctuations For nations, corporations, and investors, adaptability is key. Some strategic measures include: Diversification: Spreading investments across sectors and regions reduces exposure to single-market shocks. Sustainable Development: Economies focusing on renewable energy, digital infrastructure, and innovation withstand shocks better. Prudent Monetary Management: Maintaining healthy foreign reserves and debt levels allows flexibility during crises. Data-Driven Decision-Making: Using predictive analytics helps governments and businesses anticipate market turns. Global Collaboration: Shared crisis management mechanisms—like coordinated rate cuts or trade agreements—strengthen collective resilience. Conclusion: Embracing the Waves of Change Economic fluctuations are neither entirely avoidable nor entirely harmful. They are intrinsic to the global economic system—signaling transitions, correcting excesses, and driving innovation. The key lies in how the world responds to them. Policymakers must balance growth with stability, corporations must plan for volatility, and investors must understand that uncertainty is the price of opportunity. The global economy, much like the ocean, will always have tides of expansion and contraction. Learning to navigate these waves—rather than resisting them—is the essence of sustainable progress. In essence, fluctuations are not the enemies of the global economy—they are its rhythm, its pulse, and its path toward evolution.

minno91
Quick Scalp or Just a Dump?
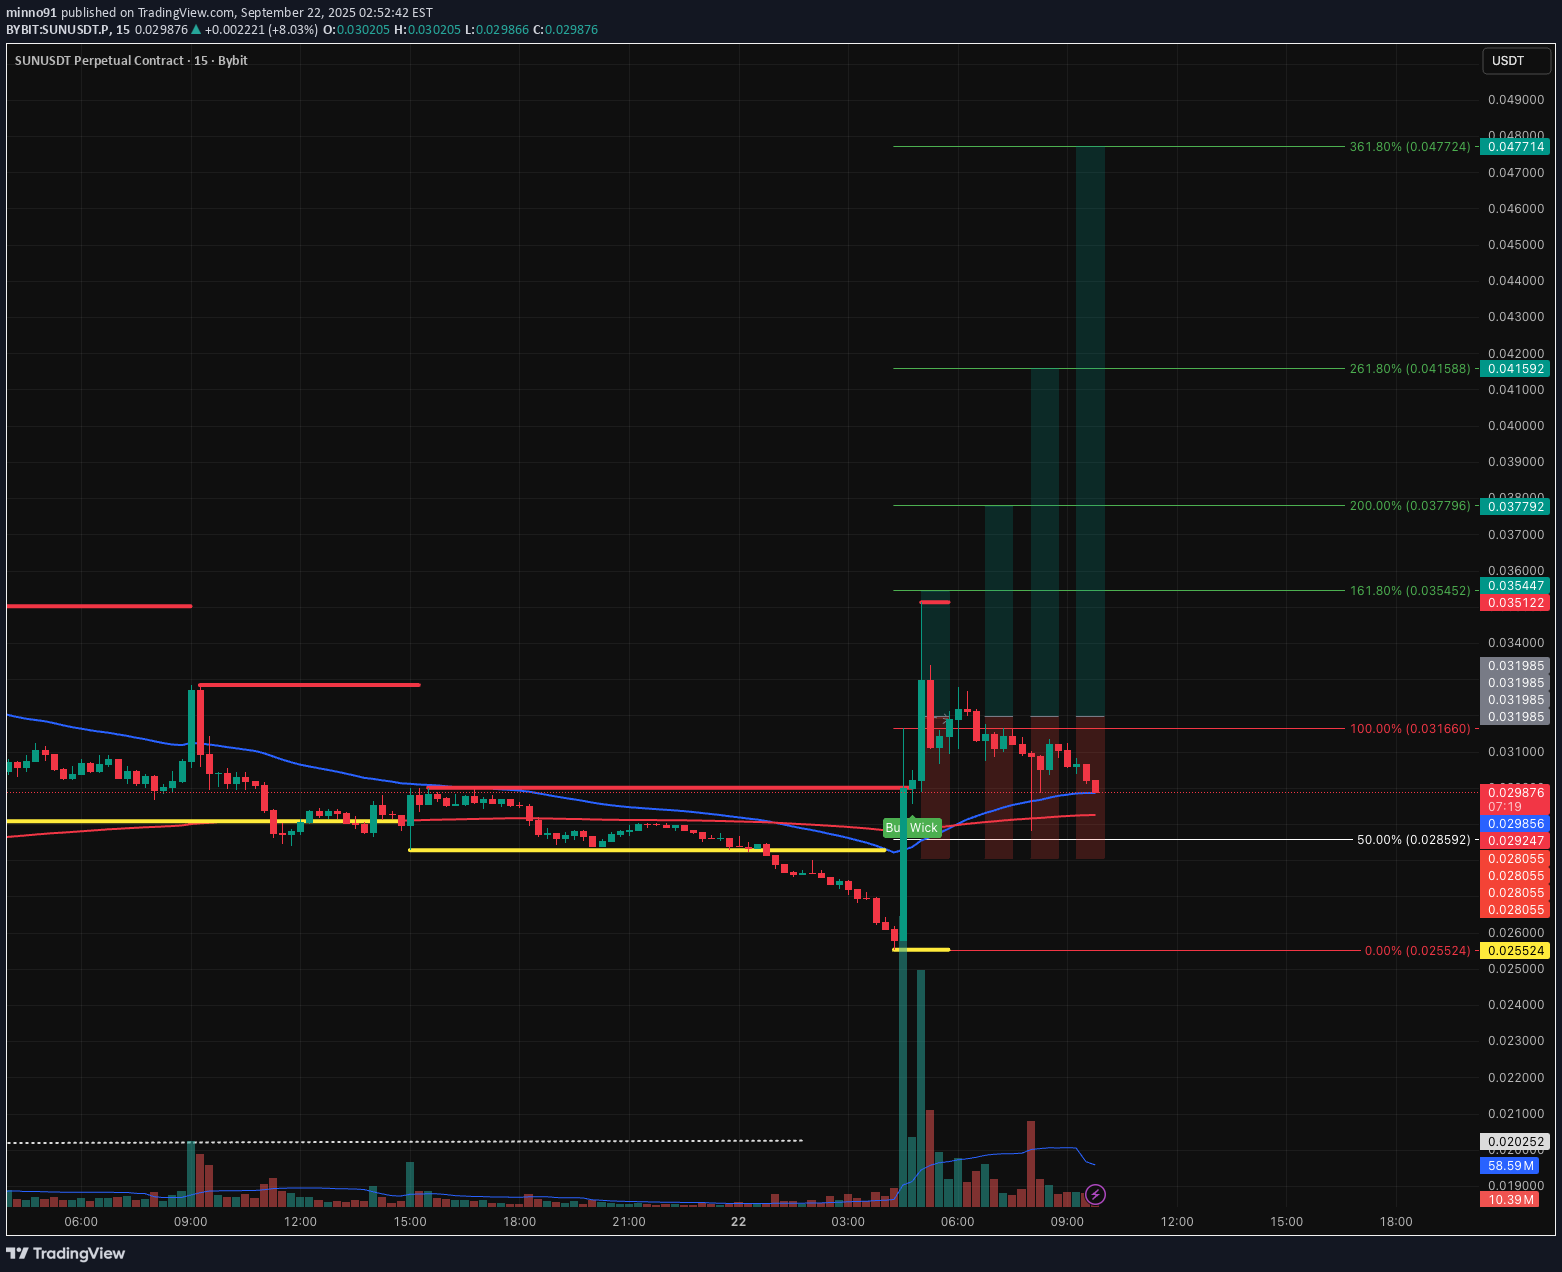
بازار در حال حاضر تحت فشار فروش قرار داره، اما این میتونه فرصتی برای یک ریکاوری سریع هم باشه. این یه موقعیت اسکالپ خالصه، ممکنه فقط در عرض چند دقیقه نتیجه بده. ریسک بالاست، معامله سریعه، هیچ چیز بلندمدتی نیست، اما بعضی وقتا این ایدههای سریع ارزش امتحان کردن رو دارن. ببینیم چی میشه! 👀🔥

WaveRiders2

AltcoinPiooners
Explode Your Gains: Epic $SUN Trading Breakthrough Awaits!
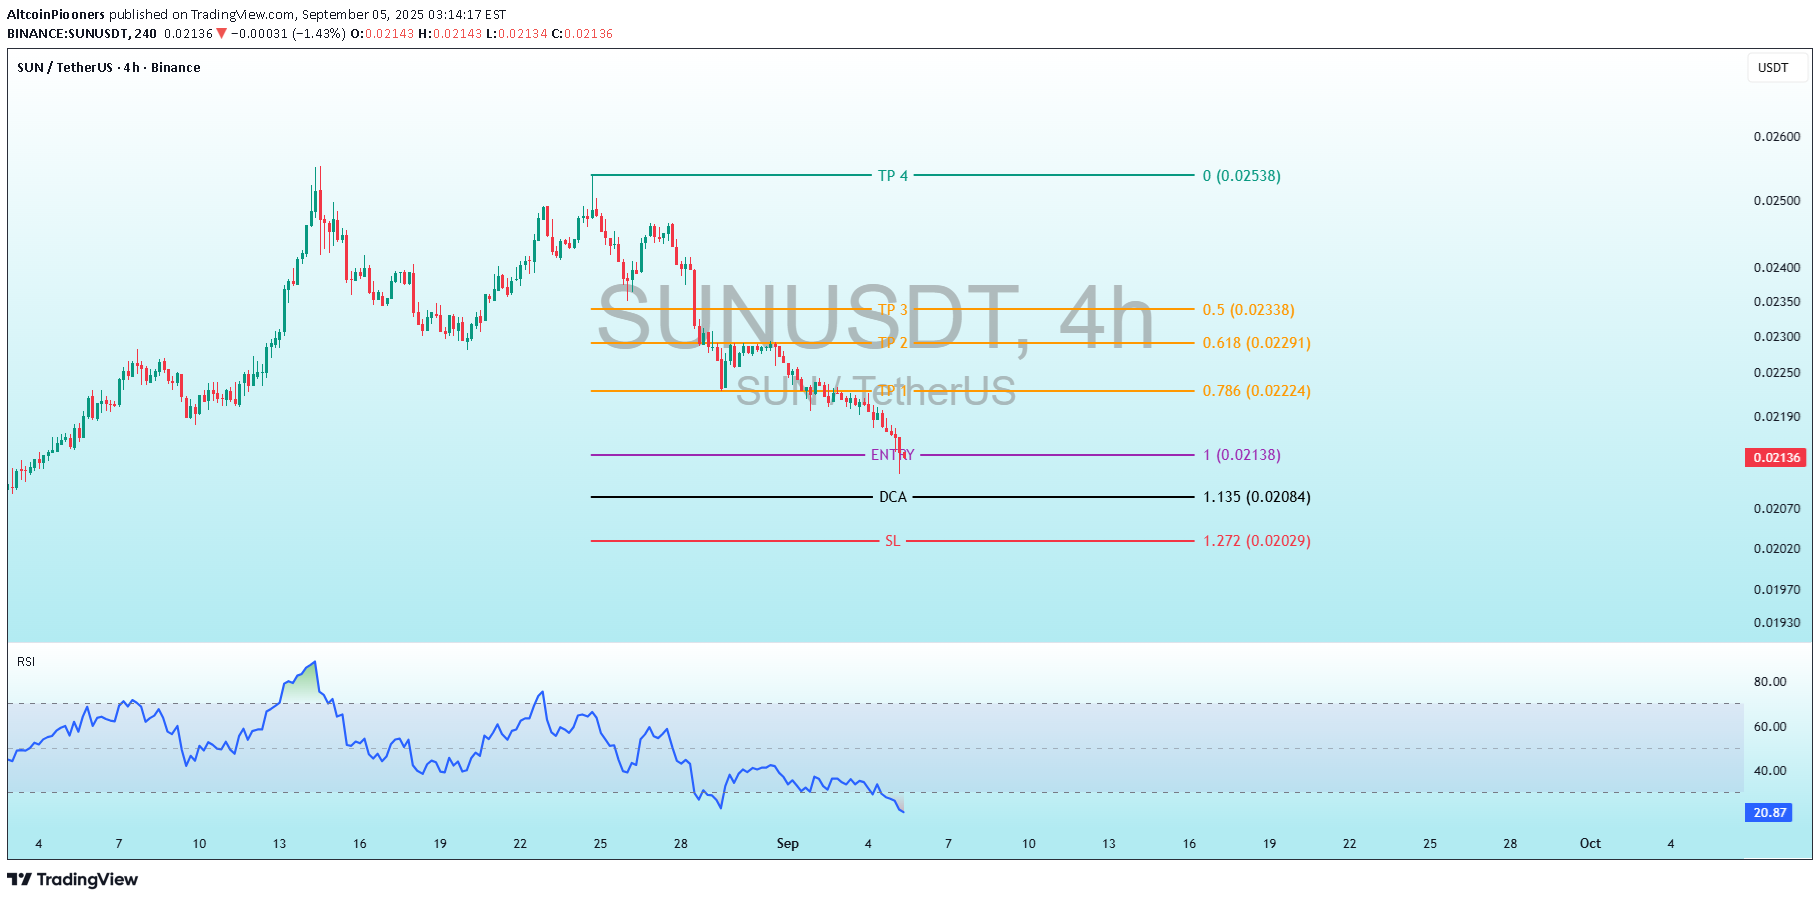
SUNUSDT سودهای خود را منفجر کنید: حماسی SUN پیشرفت معاملاتی در انتظار است! الگوهای کلیدی: روند صعودی یک افزایش سهموی واضح با افزایش نوسانات (فیتیلههای بلندتر روی کندلها) را تشکیل میدهد. روند نزولی شبیه به یک مرحله "تخلیه" است، با یک افت تقریباً عمودی، که احتمالاً ناشی از سودگیری یا تغییرات احساسات بازار است. قیمت فعلی در نزدیکی یک منطقه حمایتی بالقوه (0.0190–0.0200 USDT) در حال تثبیت است، با کندلهای کوچکجثه که نشان دهنده تردید است. هنوز هیچ الگوی برگشتی واضحی (مثلاً چکش یا کف دوقلو) دیده نمیشود، اما نزدیکی به سطوح مشخص شده نشان دهنده یک تنظیم برای یکی است. نوسانات و دامنه: دامنه قیمت در طول دوره از حدود 0.0170 USDT (کفها) تا 0.0600 USDT (سقفها) است. عملکرد اخیر در مقایسه با اوج، نوسانات کمی دارد و قیمت به انتهای پایینتر چسبیده است. تحلیل اندیکاتور: RSI RSI (دوره 14) در پایین ترسیم شده است، از 0 تا 100، با آستانههای اشباع خرید (>70) و اشباع فروش (<30) به طور ضمنی مشخص شده است (خطوط افقی در 80، 60، 40، 20). رفتار: RSI عملکرد قیمت را از نزدیک منعکس کرد. در طول روند صعودی به بالای 80 جهش کرد (اشباع خرید، سیگنال بالقوه خستگی)، سپس به شدت تا حدود 20-25 در اوایل سپتامبر سقوط کرد (اشباع فروش، نشان دهنده فرصت خرید بالقوه). قرائت فعلی: RSI تقریباً 21 است (در سمت راست قابل مشاهده است)، deep در قلمرو اشباع فروش. در حال کاهش بوده است اما در کندلهای اخیر کمی صاف شده است، که میتواند نشان دهنده واگرایی باشد اگر قیمت تثبیت شود - در صورت تأیید یک سیگنال صعودی. تفسیر: RSI اشباع فروش اغلب پیش از معکوس شدن در بازارهای پرطرفدار، به ویژه در کریپتو رخ میدهد. با این حال، در روندهای نزولی قوی، میتواند برای دورههای طولانی در اشباع فروش باقی بماند. هنوز هیچ واگرایی صعودی واضحی (کفهای بالاتر RSI در حالی که قیمت کفهای پایینتری را ایجاد میکند) مشهود نیست، اما با این وجود به عنوان تأییدی برای صعود، مراقب آن باشید. سطوح مشخص شده و استراتژی معاملاتی این نمودار شامل چندین خط افقی با برچسبها، رنگها و نسبتهای فیبوناچی است (به عنوان مثال، 0.786، 1.618)، که نشان دهنده یک برنامه معاملاتی مبتنی بر فیبوناچی برای یک موقعیت خرید است. این در معاملات کریپتو برای پیشبینی اهداف و مدیریت ریسک رایج است. به نظر میرسد که سطوح از یک نوسان اخیر پایین به بالا (احتمالاً کف تا اوج آگوست) لنگر انداخته شدهاند. حد ضرر (SL): خط Red در 1.272 USDT، با برچسب "SL" با Fib 1.272 (0.02029) - اختلاف جزئی در برچسب، احتمالاً یک یادداشت محاسبه است). این سطح ریسکی است که اگر قیمت پایینتر برود، معامله نامعتبر میشود. میانگین هزینه دلار (DCA): خط سیاه در 1.135 (1.135 Fib، 0.02004). این نشان میدهد که اگر قیمت بیشتر کاهش یابد، به موقعیت اضافه کنید و میانگین هزینه ورودی را کاهش دهید. ورود: خط بنفش در 1 (1.0 Fib، 0.02140-0.02135). این سطح خرید اصلی است، جایی که معاملهگر وارد یک موقعیت خرید میشود. قیمت فعلی بسیار نزدیک یا کمی پایینتر از این است، و آن را فعال یا قریبالوقوع میکند. سطوح برداشت سود (TP): چندین خط نارنجی و فیروزهای به سمت بالا، با برچسبگذاری با پسوندهای فیبوناچی (به عنوان مثال، 0.786، 1.618، 3.0، 4.618، 5.0) و قیمتها: TP1: ~0.02224 USDT (0.786 Fib، 0.02224) TP2: ~0.02291 USDT (1.618 Fib، 0.02291) TP3: ~0.02338 USDT (احتمالاً 3.0 یا 4.0 Fib، 0.02338) TP4: فیروزهای در 0 (هدف گسترده 0.02538 USDT، احتمالاً 5.0 Fib یا اوج قبلی).
Alpha-GoldFX
SUNUSDT Forming Descending Triangle
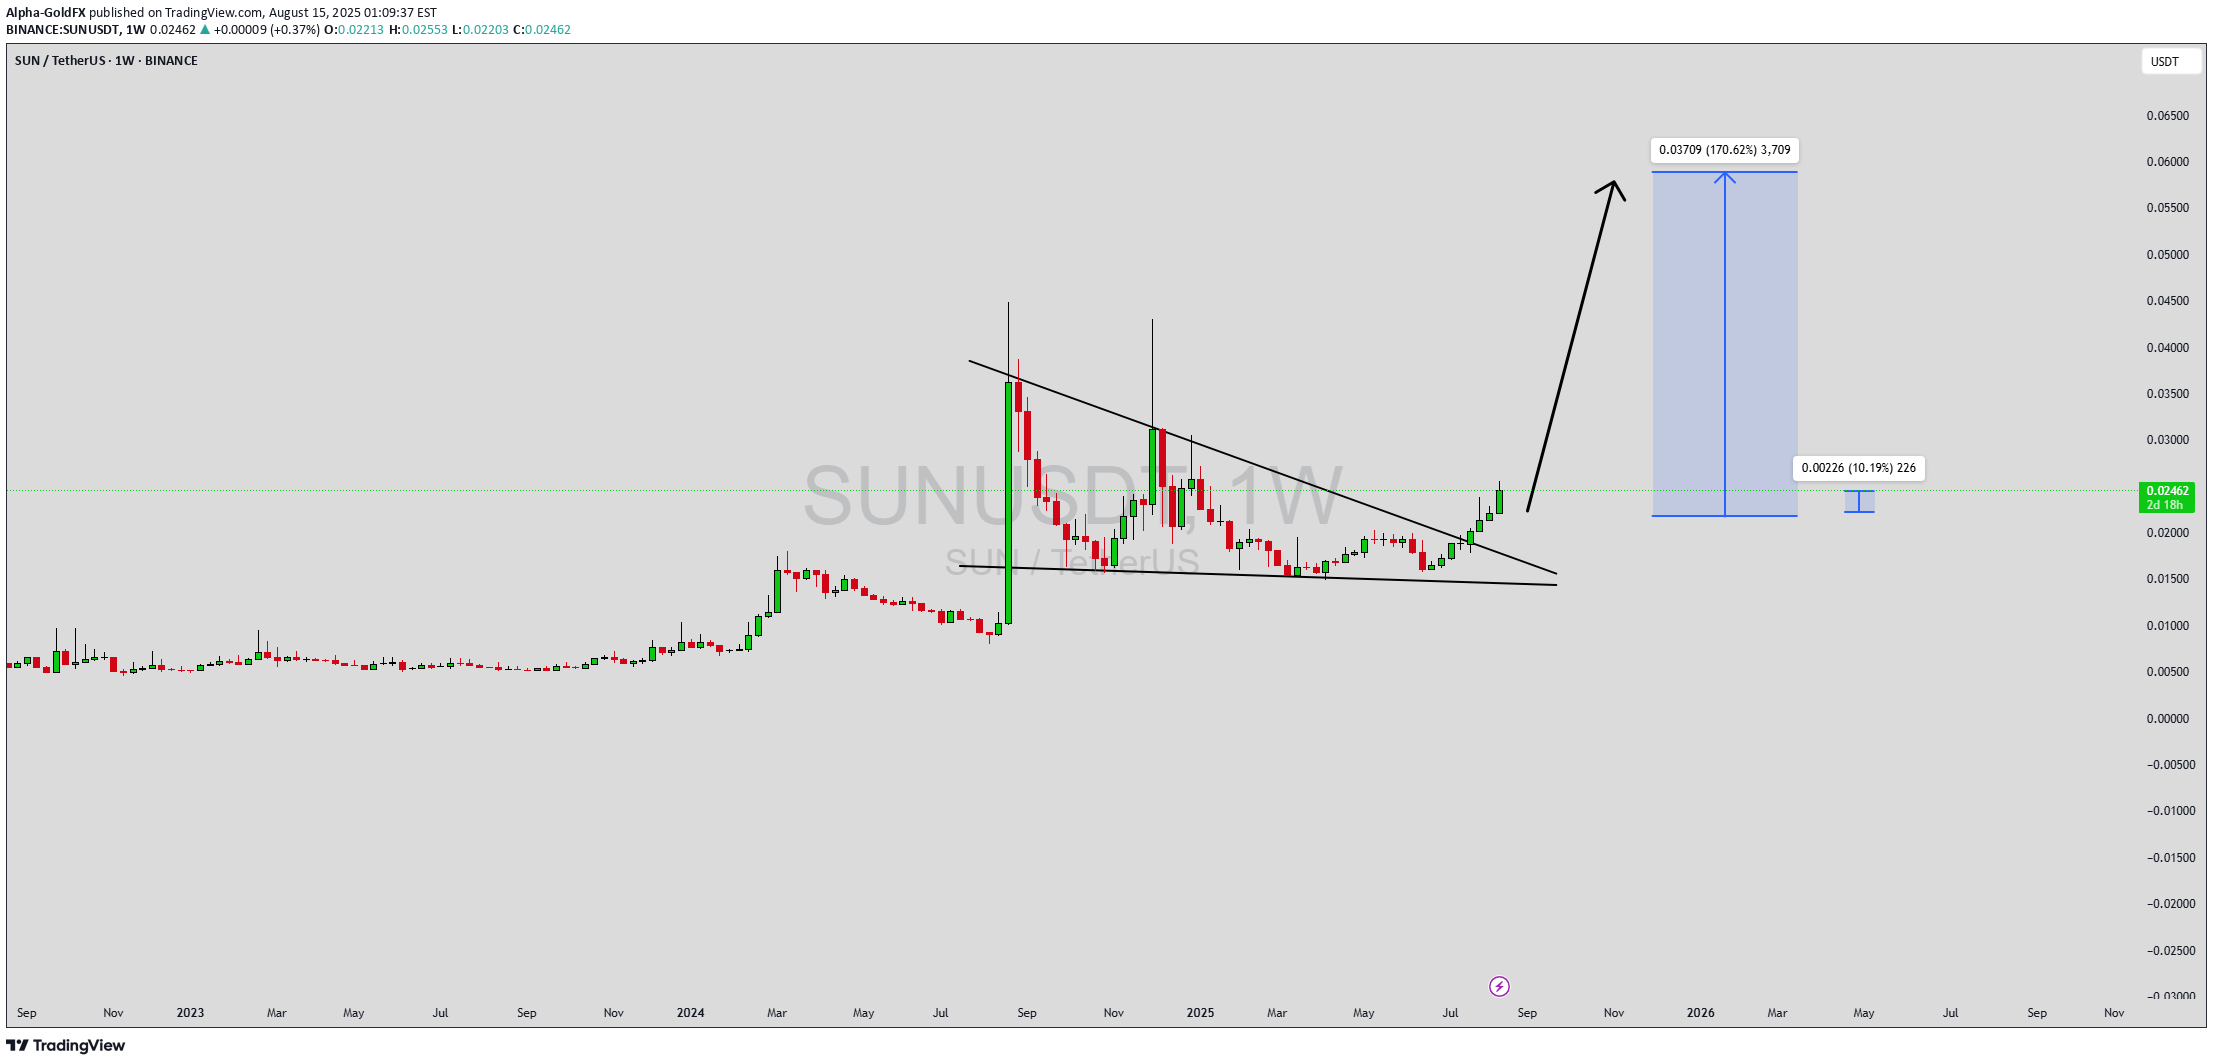
SONUSDT نشان می دهد a شکستن صعودی قوی از a مثلث نزولی بلند مدت ، شکل گیری a که اغلب پیش از عملکرد قیمت انفجاری است. نمودار هفتگی a شکست پایدار بالاتر از مقاومت چند ماهه چند ماهه ، نشان می دهد که تغییر a در ساختار بازار و سیگنالینگ مبنی بر اینکه گاوها کنترل می کنند. با استفاده از حجم به تدریج در حال ساخت و a ساختار شفاف که تجمع را تأیید می کند ، SunusDT برای a قابل توجه move آماده می شود. بر اساس تنظیم نمودار فعلی ، پتانسیل 140 ٪ تا 150 ٪ صعودی وجود دارد. از لحاظ تاریخی ، SUN پس از دوره های ادغام ، تظاهرات عمودی تیز را نشان داده است. شکست فعلی رفتار گذشته را تقلید می کند و می تواند منجر به ادامه روند قدرتمند a به سمت منطقه 0.06000 USDT شود. معامله گران و سرمایه گذاران به طور یکسان توجه زیادی به این سطح دارند ، زیرا موج بعدی احساسات صعودی می تواند SONUSDT را به کشف قیمت بفرستد ، به خصوص با بازار رمزنگاری که نشان می دهد optimism. احساسات بازار در حدود SUN به دلیل توجه بیشتر بازیکنان خرده فروشی و نهادی نیز در حال بهبود است. وزوز اجتماعی ، همراه با افزایش حجم معاملات ، نشان دهنده اعتماد به نفس فزاینده در نقشه راه این پروژه و چشم انداز آینده است. اگر حرکت فعلی ادامه یابد ، SONUSDT ممکن است از سایر آلتکین ها در دوره کوتاه تا متوسط بهتر عمل کند. با ضربه زدن به دکمه LIKE پشتیبانی خود را نشان دهید و ✅ ترک a نظر زیر! (نظر شما در مورد این سکه چیست) بازخورد و تعامل شما باعث می شود که من الهام بخش باشم تا تجزیه و تحلیل بازار بین المللی تری را با شما به اشتراک بگذارم!
Alpha-GoldFX
SUNUSDT Forming Potential Breakout

SUNUSDT در حال حاضر یک الگوی شکست بالقوه و امیدوارکننده را شکل میدهد که معاملهگران و سرمایهگذاران باید آن را به دقت زیر نظر داشته باشند. حرکت قیمت دورهای از تثبیت را در نزدیکی نواحی حمایتی کلیدی نشان داده است و پایهای قوی برای یک حرکت انفجاری بالقوه ایجاد میکند. با افزایش تدریجی حجم معاملات و در دست گرفتن کنترل توسط خریداران، به نظر میرسد این جفت ارز آماده عبور از سطوح مقاومت است که نشاندهنده آغاز یک فاز صعودی جدید است. ساختار تکنیکال از یک سوگیری صعودی پشتیبانی میکند، با پتانسیل دستیابی به سود 140% تا 150%+ در صورت تحقق کامل شکست. رفتار قیمت تاریخی و الگوهای اخیر کندلها نشان میدهد که SUNUSDT در حال آماده شدن برای یک رالی است، به ویژه با نزدیک شدن به یک خط روند حیاتی. در صورت تایید، این شکست میتواند منجر به یک حرکت سهمیوار شود که ناشی از علاقه مجدد بازار و فشار خرید است. SUN، به عنوان بخشی از اکوسیستم TRON، از یک بنیاد مستحکم و استفاده روزافزون در برنامههای DeFi بهره میبرد. این توکن شاهد افزایش علاقه سرمایهگذاران بوده است که این امر احساسات مثبت و پتانسیل بلندمدت را تقویت میکند. اصول و مبانی به خوبی با چشم انداز فنی فعلی همسو هستند و اعتماد بیشتری به معاملهگران صعودی که به دنبال تنظیمات با پاداش بالا هستند، میدهند. با توجه به شتاب و بهبود پویایی بازار، SUNUSDT به یک کاندید با پتانسیل بالا برای لیست نظارت هم برای معاملهگران نوسانی و هم سرمایهگذاران بلندمدت تبدیل شده است. یک شکست تایید شده بالاتر از محدوده فعلی میتواند دری را به سوی سودهای صعودی قابل توجه باز کند. ✅ با زدن دکمه لایک حمایت خود را نشان دهید و ✅ در زیر نظر بگذارید! (نظر شما در مورد این سکه چیست) بازخورد و تعامل شما به من انگیزه میدهد تا تحلیلهای بینشمندتری از بازار را با شما به اشتراک بگذارم!
سلب مسئولیت
هر محتوا و مطالب مندرج در سایت و کانالهای رسمی ارتباطی سهمتو، جمعبندی نظرات و تحلیلهای شخصی و غیر تعهد آور بوده و هیچگونه توصیهای مبنی بر خرید، فروش، ورود و یا خروج از بازارهای مالی نمی باشد. همچنین کلیه اخبار و تحلیلهای مندرج در سایت و کانالها، صرفا بازنشر اطلاعات از منابع رسمی و غیر رسمی داخلی و خارجی است و بدیهی است استفاده کنندگان محتوای مذکور، مسئول پیگیری و حصول اطمینان از اصالت و درستی مطالب هستند. از این رو ضمن سلب مسئولیت اعلام میدارد مسئولیت هرنوع تصمیم گیری و اقدام و سود و زیان احتمالی در بازار سرمایه و ارز دیجیتال، با شخص معامله گر است.