
TRX
ترون
| تریدر | نوع سیگنال | حد سود/ضرر | زمان انتشار | مشاهده پیام |
|---|---|---|---|---|
 MonoCoinSignalرتبه: 2236 | خرید | حد سود: تعیین نشده حد ضرر: تعیین نشده | 16 ساعت پیش | |
 MyCryptoParadiseرتبه: 31828 | فروش | حد سود: تعیین نشده حد ضرر: تعیین نشده | ۱۴۰۴/۹/۱۸ | |
خرید | حد سود: تعیین نشده حد ضرر: تعیین نشده | ۱۴۰۴/۹/۱۳ | ||
خرید | حد سود: تعیین نشده حد ضرر: تعیین نشده | ۱۴۰۴/۹/۱۱ | ||
 AloneTrader_رتبه: 5600 | خرید | حد سود: تعیین نشده حد ضرر: تعیین نشده | ۱۴۰۴/۷/۲۲ |


نمودار قیمت ترون
سود ۳ ماهه :
خلاصه سیگنالهای ترون
سیگنالهای ترون
فیلتر
مرتب سازی پیام براساس
نوع پیام
نوع تریدر
فیلتر زمان
MonoCoinSignal
TRX در آستانه انفجار صعودی؟ سیگنالهای خرید قوی از منطقه اشباع فروش!
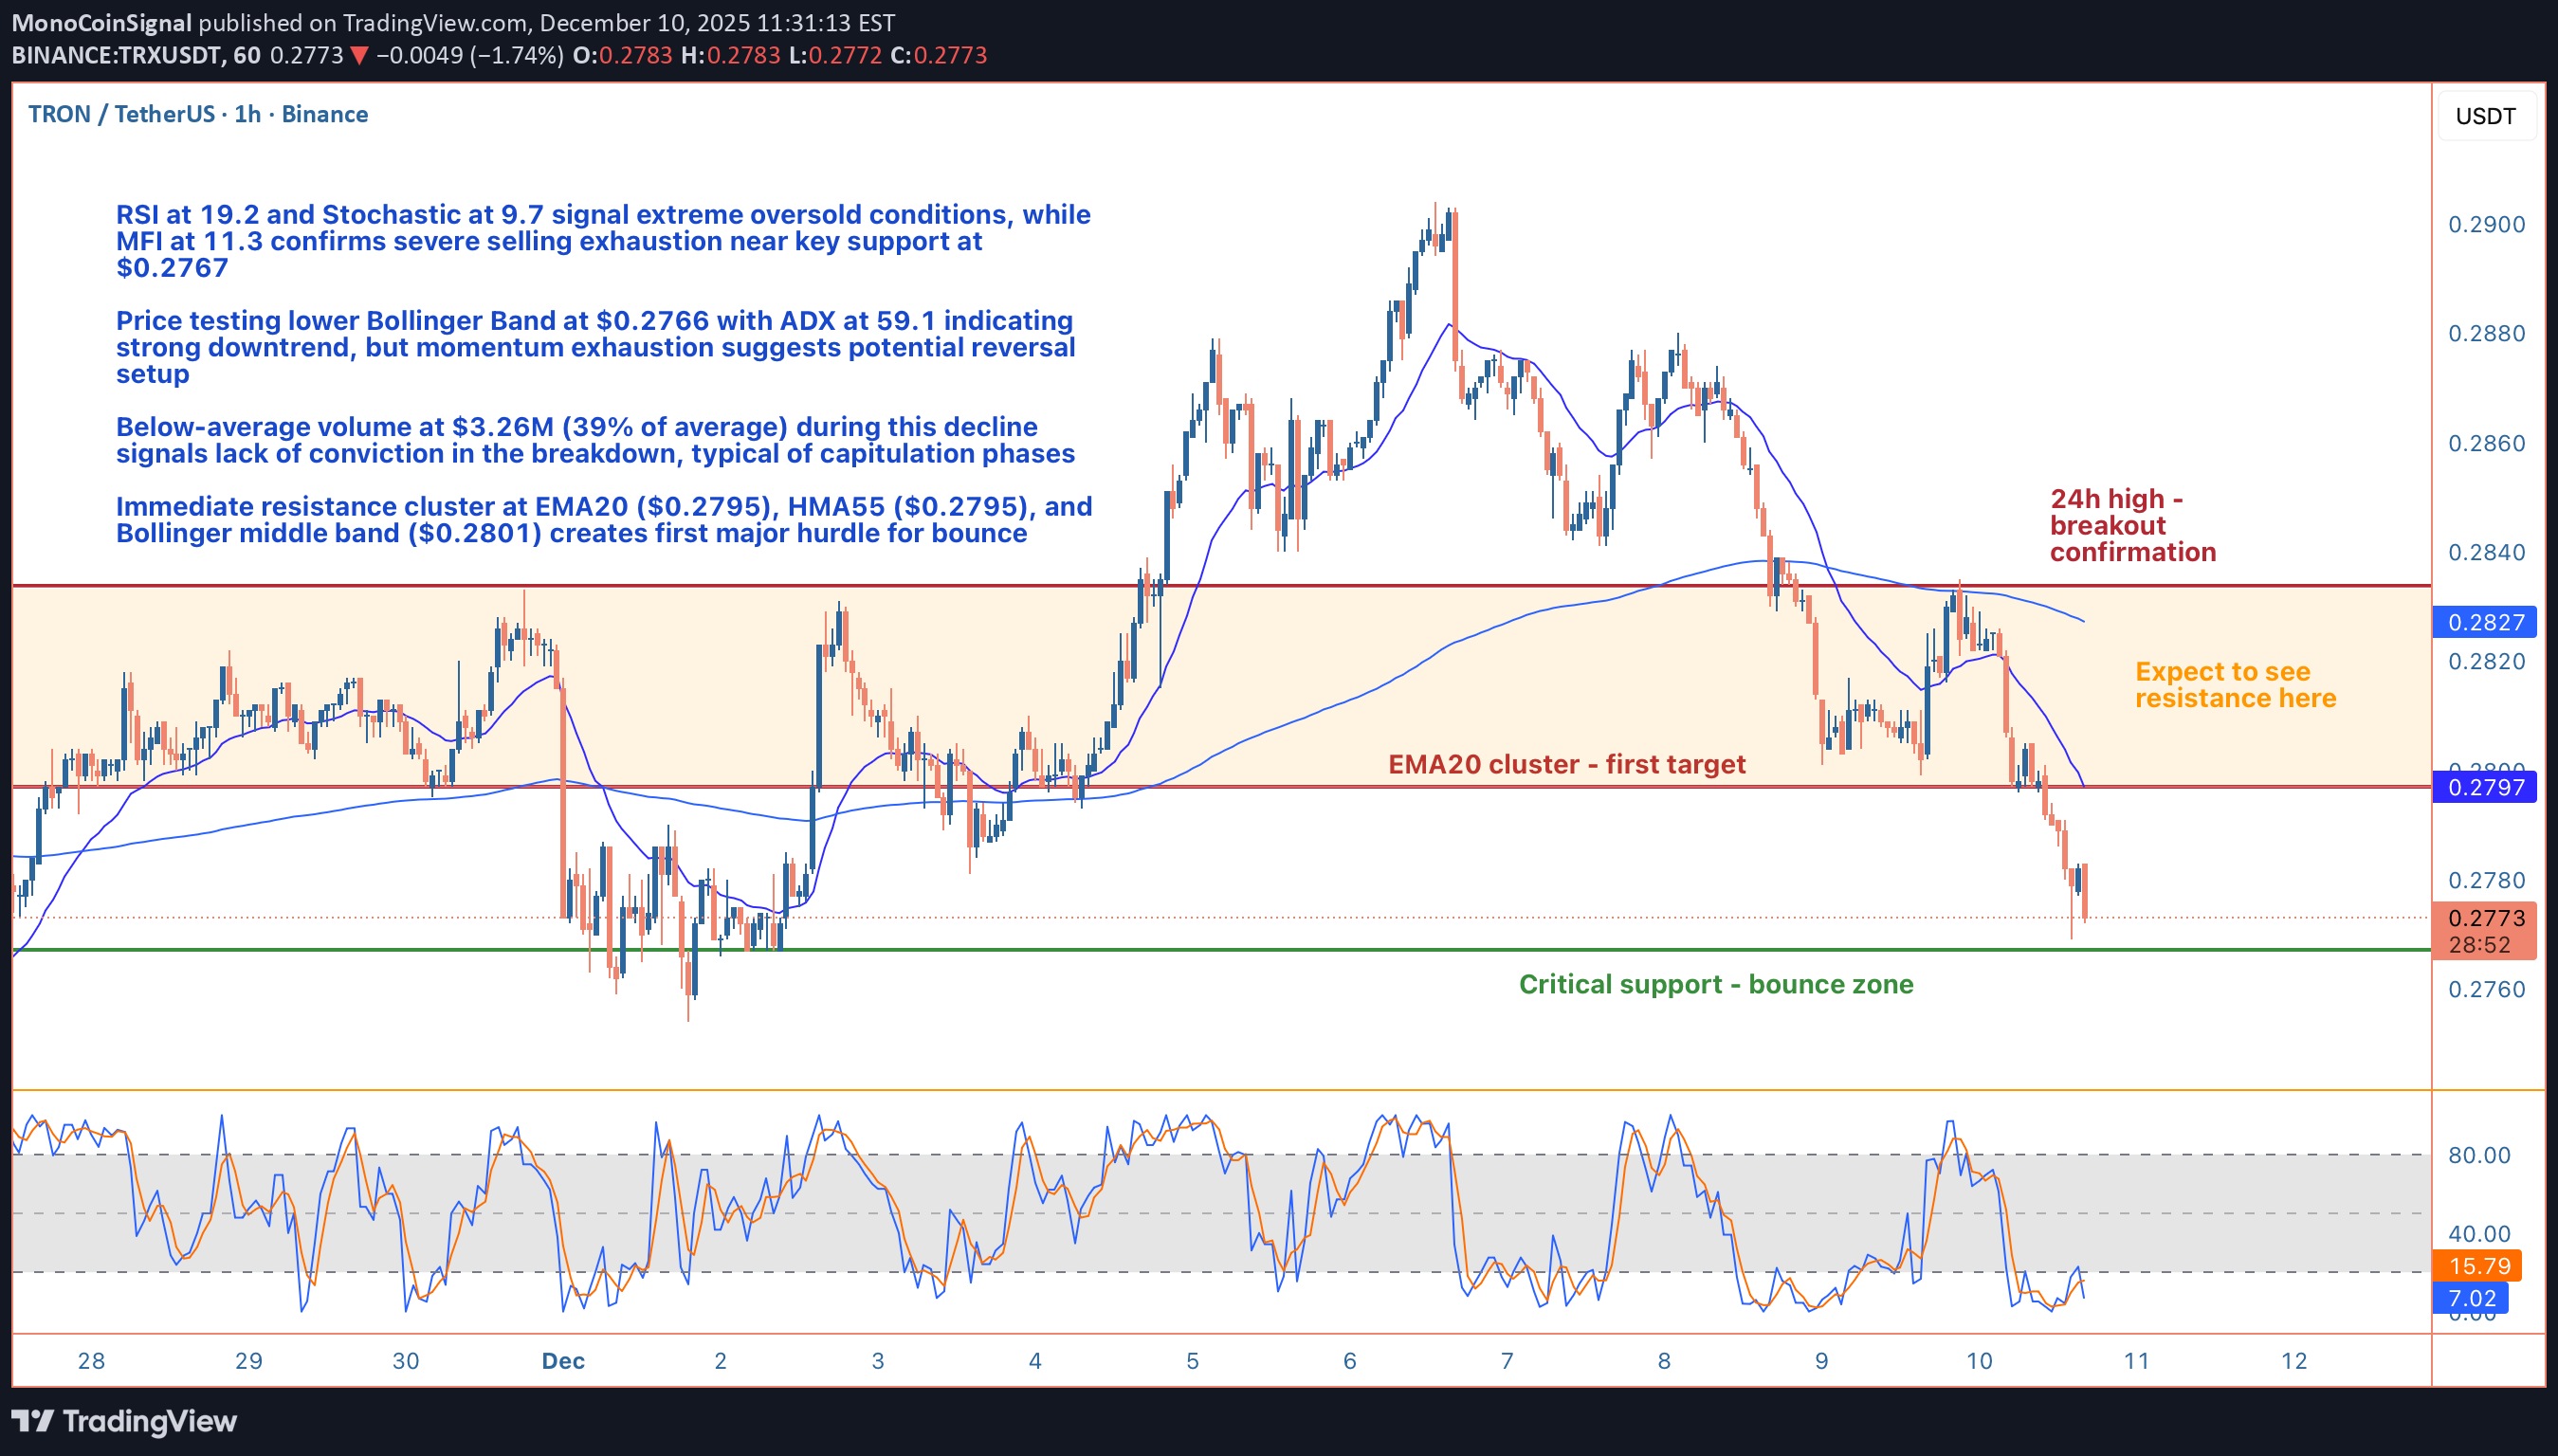
Hey guys, let's break down what's happening with Tron on the 1-hour timeframe because we're seeing some textbook oversold conditions that could set up a solid mean reversion play. TRX is currently trading at $0.2772, down 1.29% over the last 24 hours and sitting dangerously close to the daily low at $0.2767. The price action has been grinding lower throughout the session, but what's really catching my eye is the confluence of extreme oversold readings across multiple momentum oscillators. RSI has crashed to 19.2, Stochastic is pinned at 9.7, and Money Flow Index is absolutely wrecked at 11.3 - these are capitulation-level numbers that we don't see every day. When you get RSI below 20 and Stochastic under 10 simultaneously, you're typically looking at selling exhaustion rather than the start of a fresh breakdown. The ADX reading of 59.1 confirms we're in a strong trending environment, but here's the thing: strong trends paired with extreme oversold conditions often mark the final flush before a bounce. Price is literally kissing the lower Bollinger Band at $0.2766, which has been acting as a technical support floor. The 4.5% lower wick on recent candles tells us buyers are already starting to defend these levels, even if hesitantly. From a moving average perspective, the picture is clearly bearish. TRX is trading below the EMA20 ($0.2795), EMA50 ($0.2811), and EMA200 ($0.2825), with a confirmed lower high formation that validates the downtrend structure. The HMA55 sits at $0.2795, creating a resistance cluster right around that EMA20 level. This convergence zone between $0.2795 and $0.2801 (Bollinger middle band) is going to be your first major hurdle on any bounce attempt. The MACD remains bearish with the histogram negative (MACD at -0.0011, Signal at -0.0008), so we're definitely fighting against the prevailing momentum here. But here's where it gets interesting: volume analysis is showing a completely different story. Current volume sits at just $3.26M compared to the 24-hour average of $8.43M - that's only 39% of normal activity. When you see price making new lows on significantly below-average volume, it's a red flag that the move lacks conviction. Sellers aren't piling in with force here; instead, we're seeing passive drifting lower, which often precedes reversals. The 24-hour volume of $64.7M is decent, but the intraday weakness in participation suggests this decline is running on fumes. Let's talk support and resistance levels because these are critical for framing any trade setup. Immediate support is the 24-hour low at $0.2767, which coincides almost perfectly with the lower Bollinger Band at $0.2766. This is your line in the sand - hold here and we're looking at a bounce; break below with volume and the oversold condition could extend further (though that seems less likely given current momentum exhaustion). On the upside, first resistance is that EMA20/HMA55 cluster at $0.2795, followed quickly by the Bollinger middle band at $0.2801. These levels will likely act as magnets for any mean reversion move. Beyond that initial resistance zone, the EMA50 at $0.2811 and EMA200 at $0.2825 represent more substantial barriers. The EMA200 in particular is significant because it's been capping rallies and would mark a full retracement of today's decline. The 24-hour high at $0.2834 sits just above that and represents the upper boundary of today's range - breaking above that would flip the short-term structure and potentially signal a trend reversal rather than just a bounce. For a trading setup, I'm favoring a counter-trend long position here with tight risk management. Entry zone would be in the $0.2770 area, essentially current price levels while we're testing support. Your stop loss needs to be tight given we're fighting the trend - I'd place it below $0.2760 to give about 10 pips of breathing room below the support cluster. That's roughly a $0.001 risk per unit. Take profit targets would be layered: TP1 at $0.2795 (EMA20/HMA55, about 2.5:1 RR), TP2 at $0.2801 (Bollinger middle band, about 3:1 RR), and TP3 at $0.2825 (EMA200, roughly 5.5:1 RR) for those wanting to ride extended bounces. The risk-reward here is favorable if you're disciplined with your stops. This isn't a high-conviction trend-following setup - it's a tactical mean reversion play based on extreme oversold conditions and weak selling volume. The confidence level sits around 73%, which reflects the fact that we're trading against the prevailing trend but with strong technical justification from momentum indicators. You're essentially betting that the rubber band has stretched too far and needs to snap back toward the mean. One scenario to watch: if we do get that bounce to the $0.2795-$0.2801 zone and price gets rejected hard with increasing volume, that would actually be a great short setup for continuation lower. But right now, at these oversold levels with price testing support, the path of least resistance for a short-term move appears to be up rather than down. The bearish structure remains intact on higher timeframes, so this would be a scalp rather than a swing trade - get in, take profits at resistance, and don't overstay your welcome. What are you thinking on this setup? Are you comfortable fading this weakness for a bounce, or would you rather wait for confirmation above $0.2795 before getting involved?Hit the entry level (green support on chart), and reached the first target.
MyCryptoParadise
TRX Breakdown Incoming? This Trendline Retest Could Be the Final
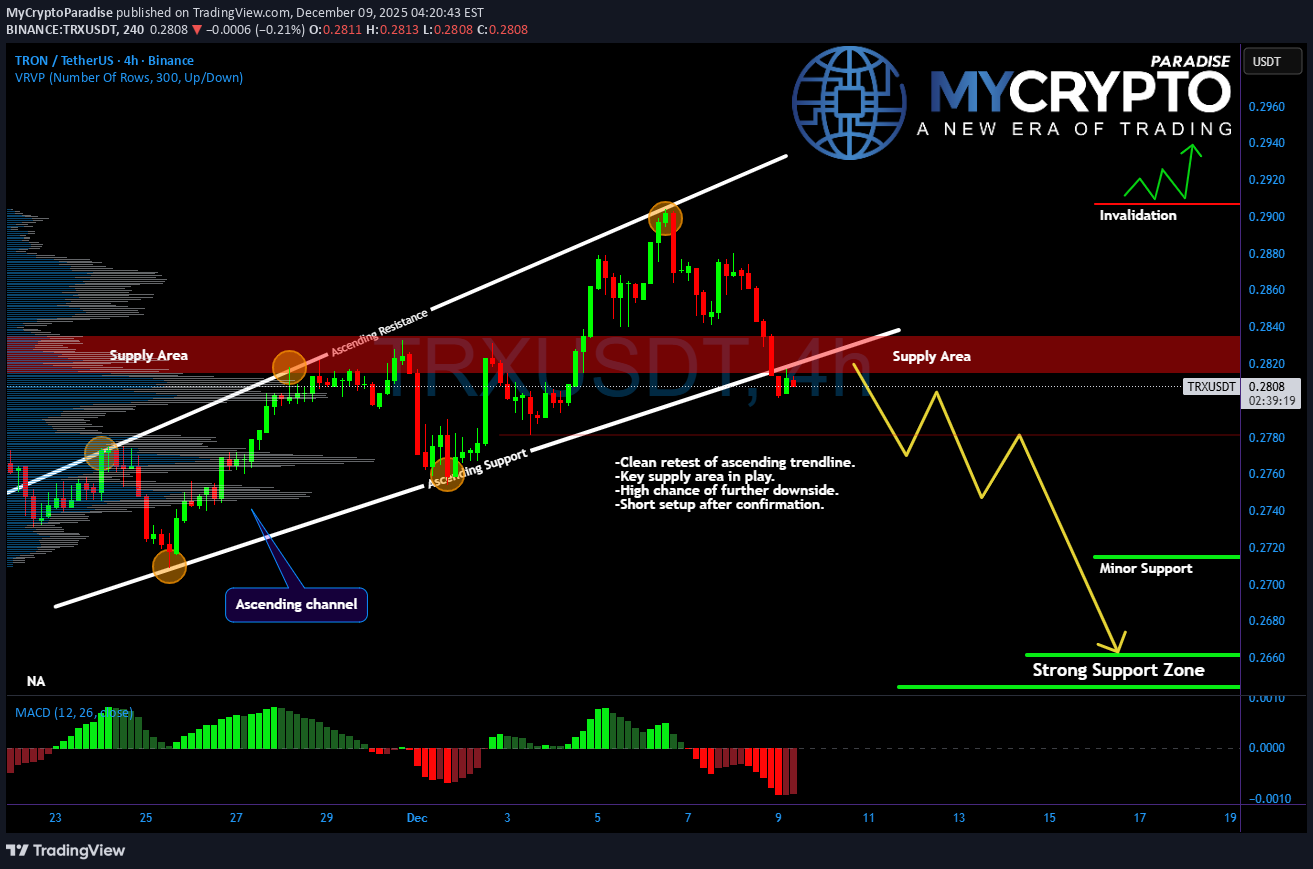
Yello Paradisers، آیا این آخرین هشدار قبل از خراب شدن کامل #TRX است؟ یا آیا بازار برای یک جعلی وحشیانه راه اندازی شده است که فروشندگان دیرهنگام را به دام می اندازد و سپس بالاتر می رود؟ 💎#TRXUSDT در حال حاضر پس از عقب نشینی از منطقه عرضه در حدود 0.2820 دلار، در حال آزمایش مجدد خط روند صعودی است، سطحی که به طور مداوم به عنوان مقاومت قوی عمل کرده است. عملکرد قیمت در یک کانال صعودی به وضوح تعریف شده باقی میماند، با خط روند پایینتر همچنان پشتیبانی فنی قوی ارائه میکند. با این حال، حرکت در حال تغییر است. MACD شروع به نشان دادن نشانه هایی از افزایش فشار نزولی کرده است که از احتمال ادامه روند نزولی بالقوه در کوتاه مدت حمایت می کند. 💎اگر تست مجدد فعلی ناموفق باشد و رد شدن از این منطقه تامین را تایید کند، احتمال move کمتر به میزان قابل توجهی افزایش می یابد. در این صورت، قیمت میتواند ابتدا حمایت جزئی را در حدود 0.2720 دلار هدف قرار دهد، و اگر فشار فروش ادامه یابد، ما به منطقه حمایت قویتر نزدیک به 0.2660 دلار به عنوان سطح کلیدی بعدی نگاه کرد. از طرف دیگر، شکست تایید شده بالای 0.2900 دلار به طور کامل تنظیم نزولی را باطل می کند و در عوض به نفع یک سناریوی برگشت صعودی است و در را برای یک حرکت تهاجمی تر باز می کند. 💎در حال حاضر، ساختار بازار یک راه اندازی کوتاه تمیز و با احتمال بالا ارائه می دهد. ریسک به وضوح بالای منطقه عرضه 0.2820 دلار تعریف شده است، و اگر رد تایید شود، راه اندازی نسبت ریسک به پاداش بسیار مطلوبی را برای معامله گران منضبط ارائه می دهد. تجارت هوشمند، Paradisers. بازار هرگز برای مدت طولانی سخاوتمند نیست و تنها کسانی که استراتژی را با نظم و انضباط ترکیب می کنند به دایره برنده می رسند. MyCryptoParadise موفقیت را احساس کنید🌴

CryptoNuclear
ترون (TRX) در بزنگاه تاریخی: حمایت شود یا سقوط کند؟
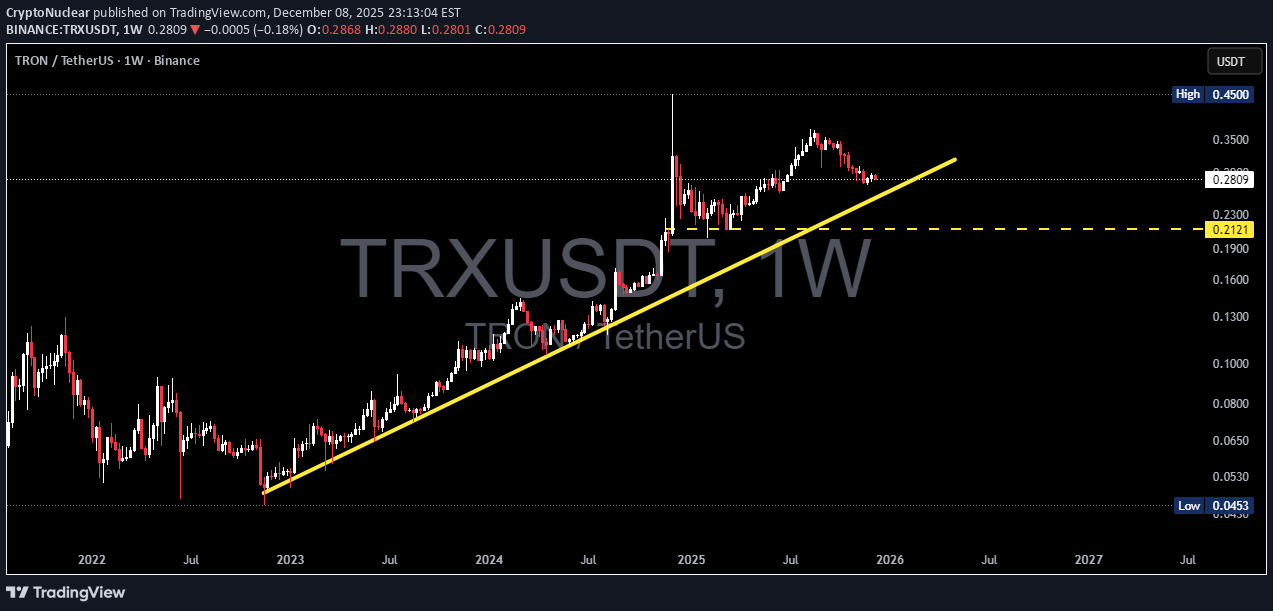
TRX ساختار چند ساله بالاتر-بالا، بالاتر-پایین را حفظ کرده است، و آن را به یکی از پایدارترین آلتکوین ها در یک چرخه نوسان بازار تبدیل کرده است. اما اکنون، قیمت مستقیماً بالاتر از خط روند صعودی اولیه قرار دارد - همان خط روندی که از کل گسترش صعودی TRX از اوایل سال 2023 پشتیبانی کرده است. این منطقه هفتگی یک نقطه تصمیم major است: آیا TRX ساختار صعودی بلندمدت خود را گسترش داد، یا در صورت شکست خط روند و حمایت 0.212 دلار، شکسته شده و وارد فاز تصحیح عمیق تری شد؟ --- تا زمانی که خط روند ادامه دارد، روند صعودی بلندمدت دست نخورده باقی می ماند. قیمت در حال حاضر در حال آزمایش مجدد خط روند است - منطقه ای که از نظر تاریخی واکنش های قوی (جهش قدرتمند یا شکست شدید) را ایجاد می کند. سطح افقی 0.212 دلار به عنوان حمایت ساختاری حیاتی عمل می کند. movement فعلی مانند یک عقبگرد سالم به نظر می رسد، نه یک برگشت کامل (مگر اینکه خط روند شکسته شود). --- 📈 سناریوی صعودی - "تجمع ادامه" اگر TRX خط روند را با موفقیت حفظ کند و یک واکنش صعودی ایجاد کند، مرحله بعدی روند صعودی ممکن است آغاز شود. سیگنال های تایید صعودی: بسته شدید هفتگی بالاتر از خط روند شمع معکوس صعودی (نوار پین، چکش یا در حال بلع) افزایش حجم خرید در طول تست مجدد خط روند اهداف صعودی: 1. 0.32 دلار – 0.35 دلار → اولین منطقه مقاومت 2. 0.45 دلار → major اوج سال 2025 3. شکستن به بالای 0.45 دلار → کشف قیمت بلندمدت بالقوه روایت صعودی: تا زمانی که خط روند ادامه دارد، این یک اصلاح نیست - این یک مرحله سوختگیری قبل از رالی بعدی است. --- 📉 سناریوی نزولی - "مرحله شکست خط روند" اگر TRX خط روند را در بسته شدن هفتگی از دست بدهد، ساختار صعودی طولانی مدت ممکن است برای اولین بار از سال 2023 شکسته شود. سیگنال های تایید نزولی: بسته شدن هفتگی زیر خط روند آزمایش مجدد خط روند تبدیل به مقاومت بسته شدن هفتگی زیر 0.212 دلار → شکست ساختار کامل اهداف نزولی: تصحیح عمیق تر در مناطق تقاضای major بعدی نوسانات بیشتر به دلیل انحلال موقعیت های خرید در زیر خط روند روایت نزولی: شکست خط روند یک عقب نشینی نیست، بلکه نشان دهنده یک معکوس ساختاری است. --- 📌 خلاصه الگو الگوی اولیه: خط روند افزایشی بلند مدت فاز فعلی: عقب نشینی هفتگی کنترل شده نتایج احتمالی: ادامه پرچم گاو نر (در صورت افزایش قیمت) شکست خط روند (اگر قیمت زیر پشتیبانی بسته شود) --- 🎯 نتیجه گیری نهایی TRX در یک سطح ساختاری بحرانی قرار می گیرد که در آن بازار بین ادامه روند صعودی چند ساله یا مرحله اصلاح کلان تصمیم می گیرد. چند شمع هفتگی آینده تعیین کننده بود. --- #TRX #TRXUSDT #CryptoAnalysis #تجزیه و تحلیل تکنیکال #Trendline #WeeklyChart #Altcoins #سناریو صعودی #سناریو نزولی

tomas_jntx
TRX Pushes Up but Faces Heavy Resistance at 0.30
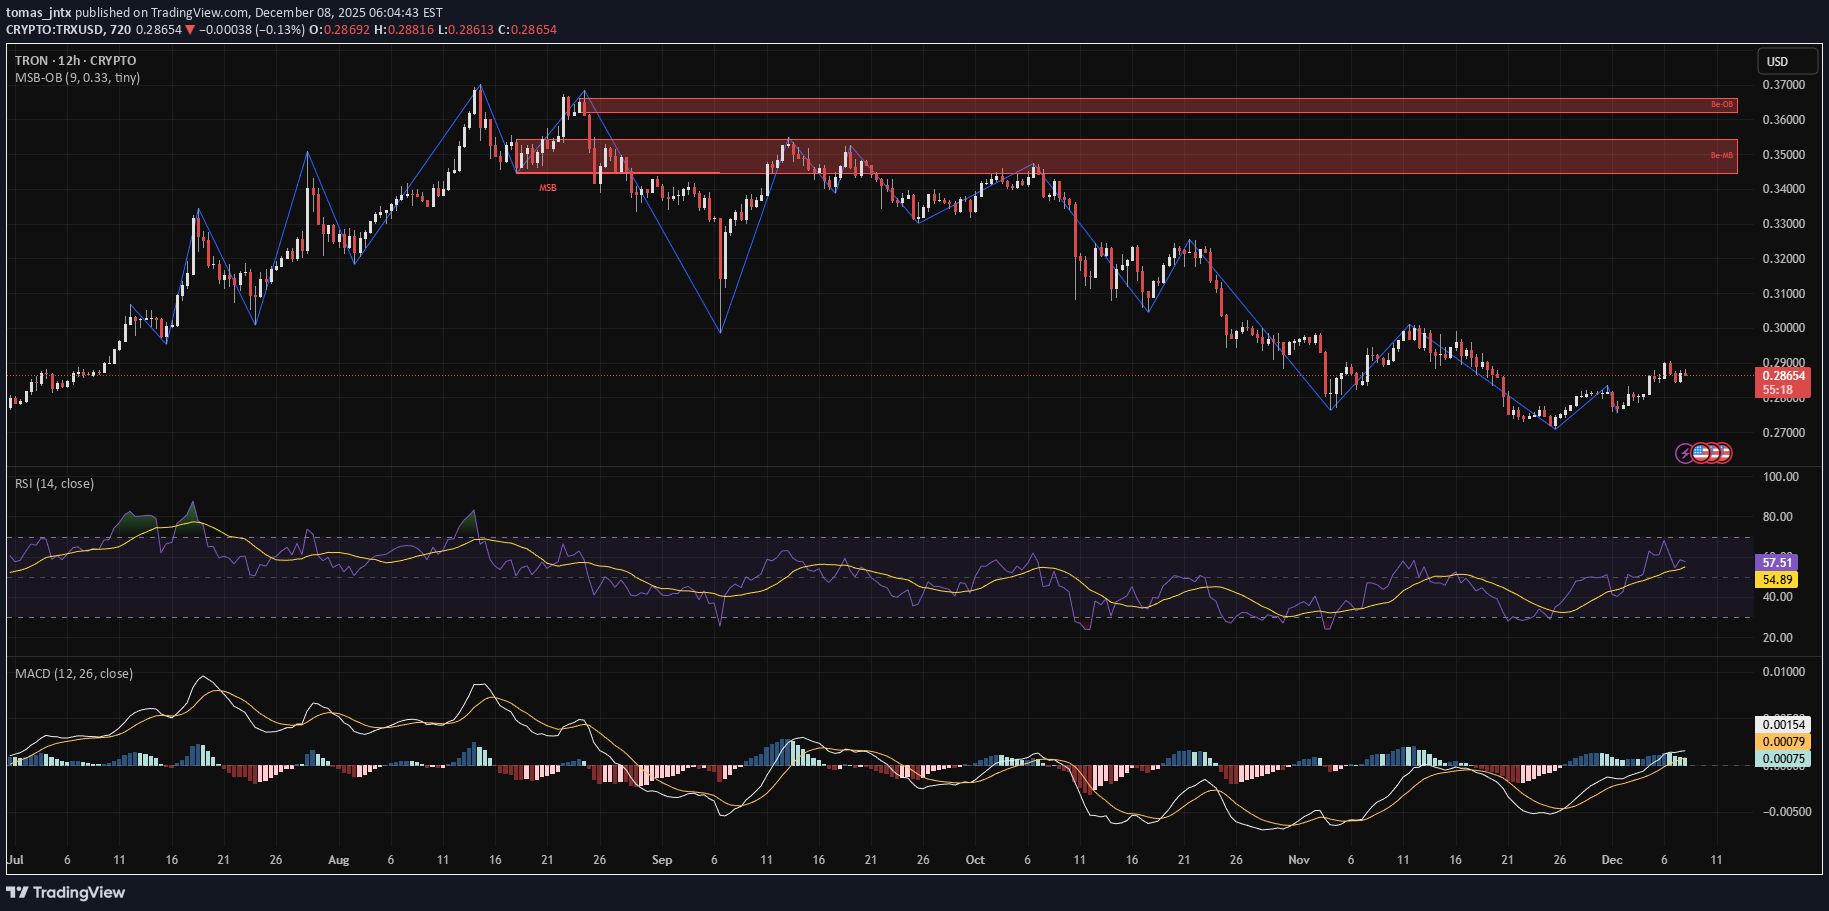
TRON از پایین ترین سطح محلی بالا می رود، اما قیمت به دیوار عرضه بین 0.32 و 0.36 نزدیک می شود. RSI در حال افزایش است و MACD در حال عبور از صعودی است که نشان دهنده صعود بالقوه کوتاه مدت است. با این حال، هیچ MSB هنوز راه اندازی نشده است. شکست تمیز بالای 0.31 سوگیری را به صعودی تغییر می دهد - در حال حاضر، این هنوز یک جهش در محدوده نزولی است. ایجاد شتاب، اما هنوز تأیید لازم است. تعصب: خنثی جفت: TRX/USDT بازه زمانی: 12 ساعت این توصیه مالی نیست، فقط تحلیل data است. لطفاً برای راهنمایی شخصی با یک متخصص مالی واجد شرایط مشورت کنید.

Bithereum_io
ترون (TRX) آماده پرواز؟ شکست خط مقاومت و اهداف جدید در نمودار روزانه!

#TRX بالاتر از گوه سقوط در نمودار روزانه شکسته است. RSI و MACD هر دو نشان می دهند که حرکت صعودی ادامه دارد، اما در حال حاضر، #TRX با SMA50 روزانه روبرو است. در صورت شکست بالای SMA50، اهداف بالقوه عبارتند از: 🎯 0.3075 دلار 🎯 0.3188 دلار 🎯 0.3301 دلار 🎯 0.3462 دلار 🎯 0.3667 دلار ⚠️ همیشه به یاد داشته باشید که از استاپ ضرر محکم استفاده کنید و مدیریت ریسک مناسب را حفظ کنید.

John_Isige
آیا TRX از رکود خارج میشود؟ سطوح کلیدی برای صعود یا سقوط تریون (TRX/USD)
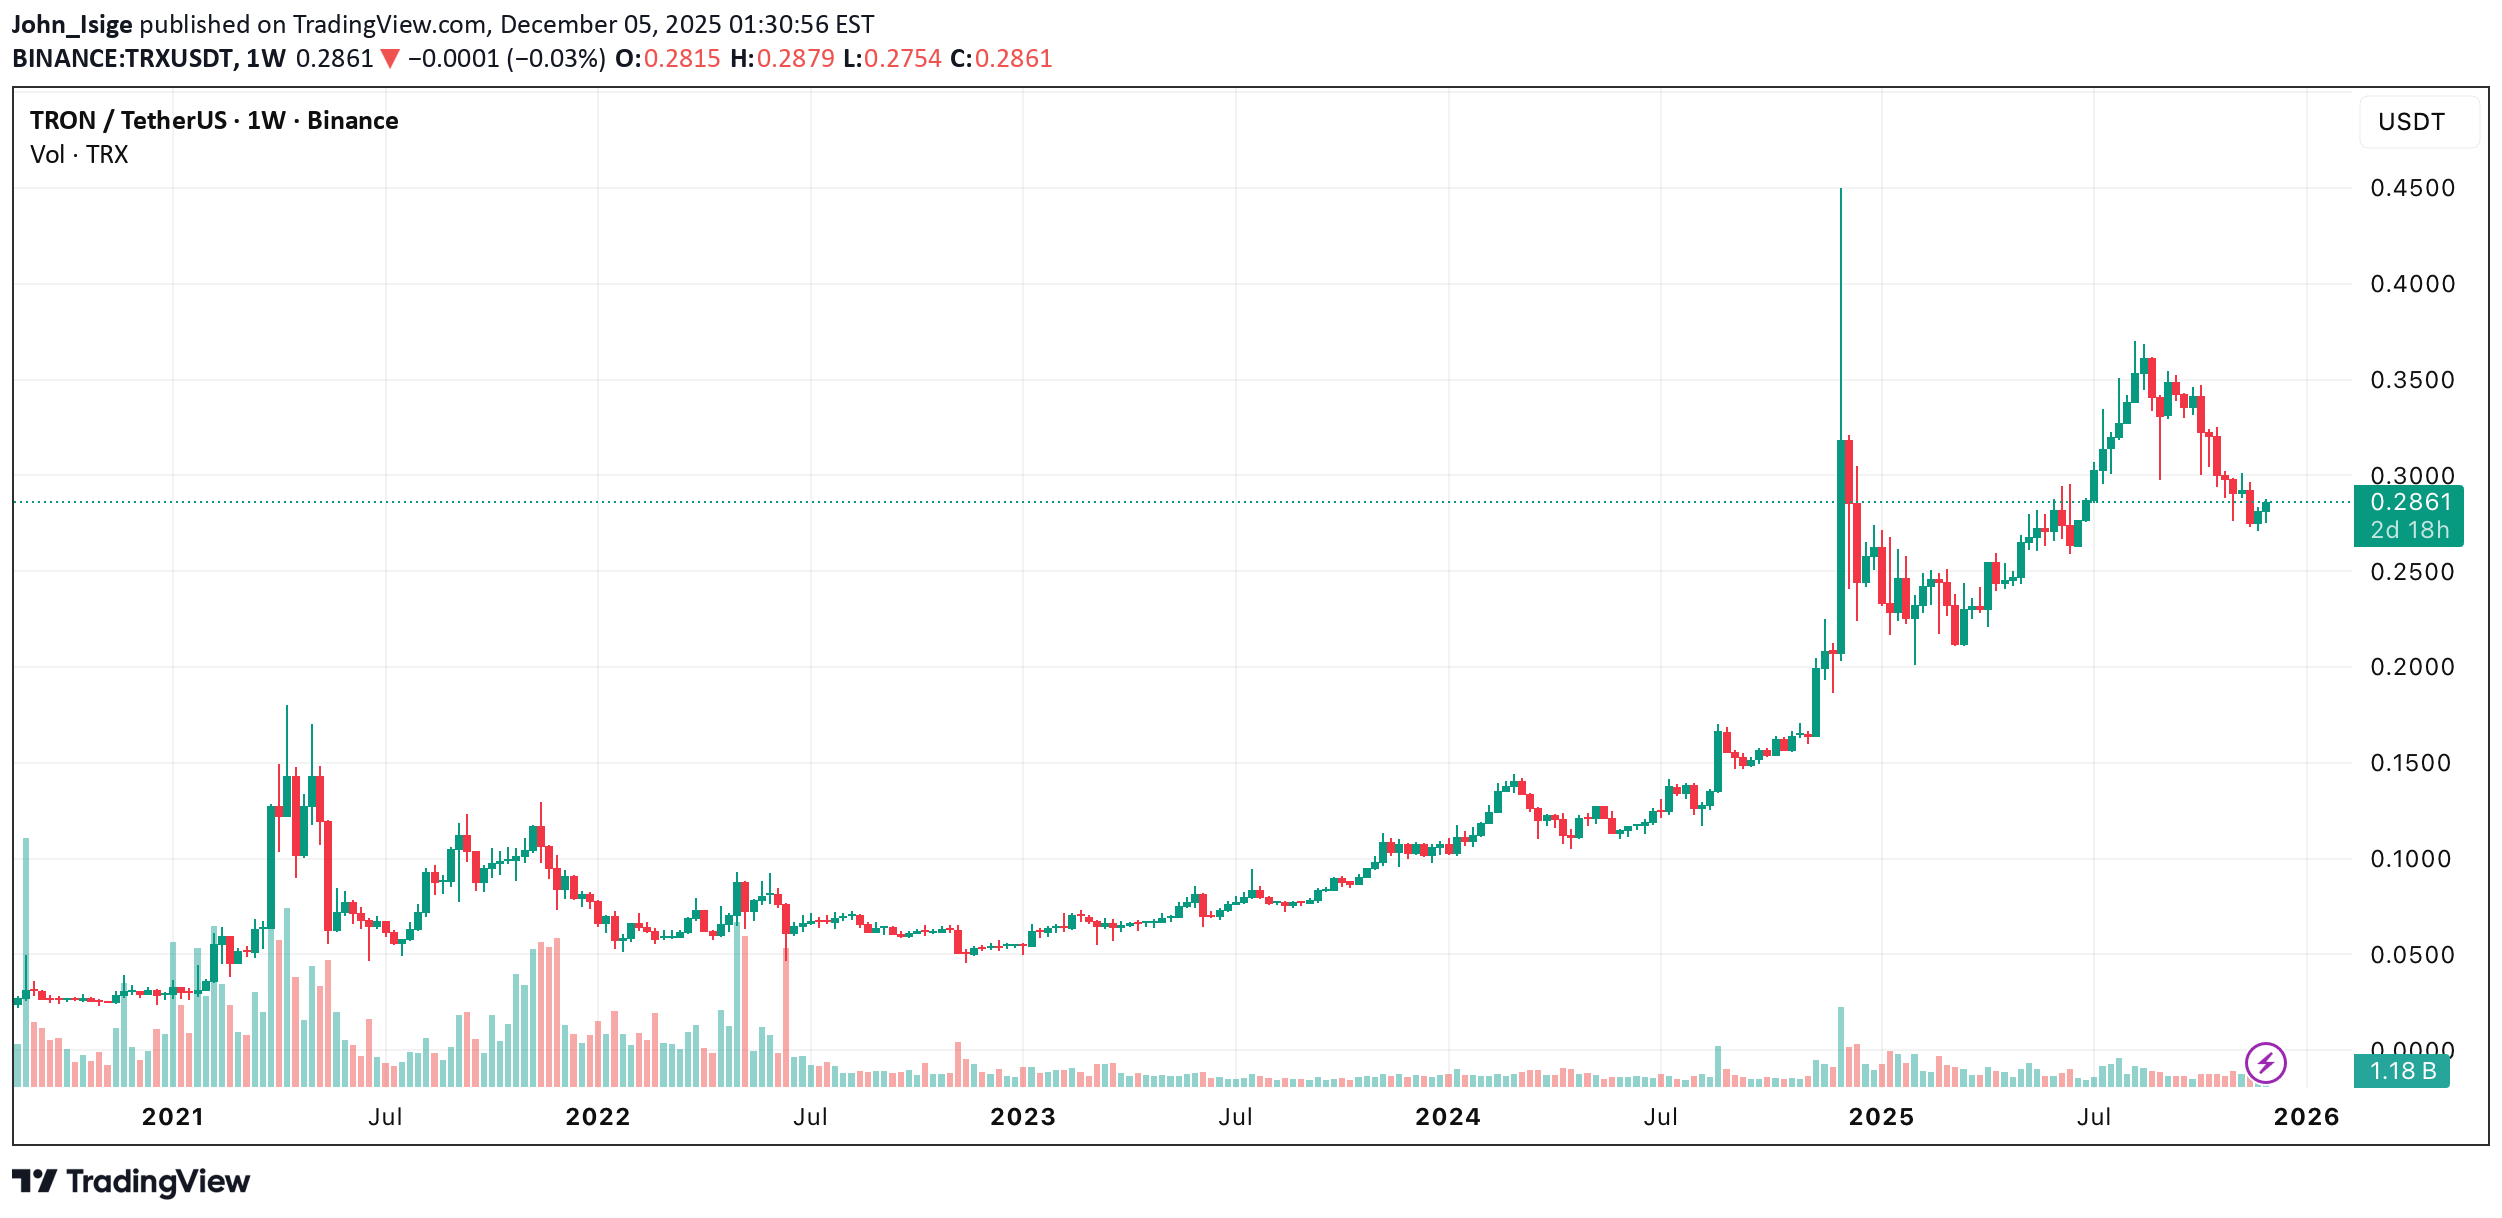
TRX/USD از ماه آگوست تحت فشار بوده و تا 26 درصد از دست داده است، اما در مقایسه با سایر دارایی های L1 این کاهش نسبتاً خفیف باقی مانده است. در هفتههای گذشته، این جفت در حدود 0.27 تثبیت شد و یک ساختار بازگشتی جزئی تشکیل داد. سوال کلیدی در حال حاضر: آیا TRX می تواند روند خود را پس بگیرد، یا این فقط یک جهش تسکین دهنده است؟ ⸻ ساختار بازار قیمت مجدداً به منطقه حمایت 0.272 واکنش نشان داد، در حالی که معیارهای روی زنجیره نشان می دهد که اصول اولیه بهبود یافته است: • مجموع حساب های Tron بیش از 350 M است • حجم Perp DEX در Tron 271 درصد در نوامبر افزایش یافت • ارزش بازار استیبل کوین در Tron به 80 میلیارد دلار نزدیک به ATH رسید TRX شبکه غالب برای جریان های USDT باقی می ماند - یک کاتالیزور صعودی در صورت بازگشت ریسک پذیری. یک معکوس روند تایید شده مستلزم شکست بالاتر از میانگین متحرک نمایی 20 روزه و به دنبال آن فشار به سمت 0.289 (مقاومت فوق روند) است. عدم حفظ 0.277 خطر دوباره آزمایش مجدد 0.272 را به همراه دارد. ⸻ سطوح صعودی 0.289 • 0.293–0.298 • 0.305 • 0.319–0.326 • 0.334 • 0.354–0.362 • 0.369 شکست 0.293-0.298 کلید باز کردن حرکت صعودی است - این منطقه EMA 50، 38.2% Fib و 200 EMA را در خود دارد. بالاتر از آن، پیوت بعدی 0.319-0.326 است، و پس از آن 0.334، و جیب طلایی در 0.354-0.362، که حداکثر صعود واقعی در هفته های آینده است، مگر اینکه شرایط کلان ریسک را تغییر دهند. ⸻ سطوح نزولی 0.278-0.271 • 0.261-0.258 • 0.240 • 0.225-0.212 در زیر 20 EMA، فشار نزولی ادامه دارد. شکست به زیر 0.271 یک لغزش به سمت 0.258 (23.6٪ فیب) را دوباره باز می کند. حرکت نزولی بیشتر 0.240 و سپس حمایت کلان 0.225-0.212 را هدف قرار می دهد که از ژانویه تا آوریل 2025 حفظ شد. با توجه به قدرت نسبی ترون، بازگشت به پایینترین سطح سالانه بعید باقی میماند مگر اینکه Bitcoin پایینترین چرخه را ایجاد کند. ⸻ شاخص ها • RSI روزانه: واگرایی صعودی - پشتیبانی از بازیابی • RSI هفتگی: اخیراً یک سیگنال فروش فلش زده است که فقط بالای میانگین متحرک نمایی 20 روزه باطل شده است. • RSI ماهانه: خنک شدن اما همچنان بالاتر از خنثی نگه داشته می شود - ساختار بلند مدت دست نخورده باقی می ماند ⸻ سوگیری: خنثی → صعودی بالای 0.293; نزولی زیر 0.277 منطقه معکوس بحرانی: 0.293-0.298 پشتیبانی کلید: 0.272 هدف شکست: 0.319-0.326 و 0.354-0.362 هدف شکست: 0.258 و 0.240
تحلیل تکنیکال ترون (TRX) پس از شکست مقاومت: سناریوهای صعود و نزول پیش رو
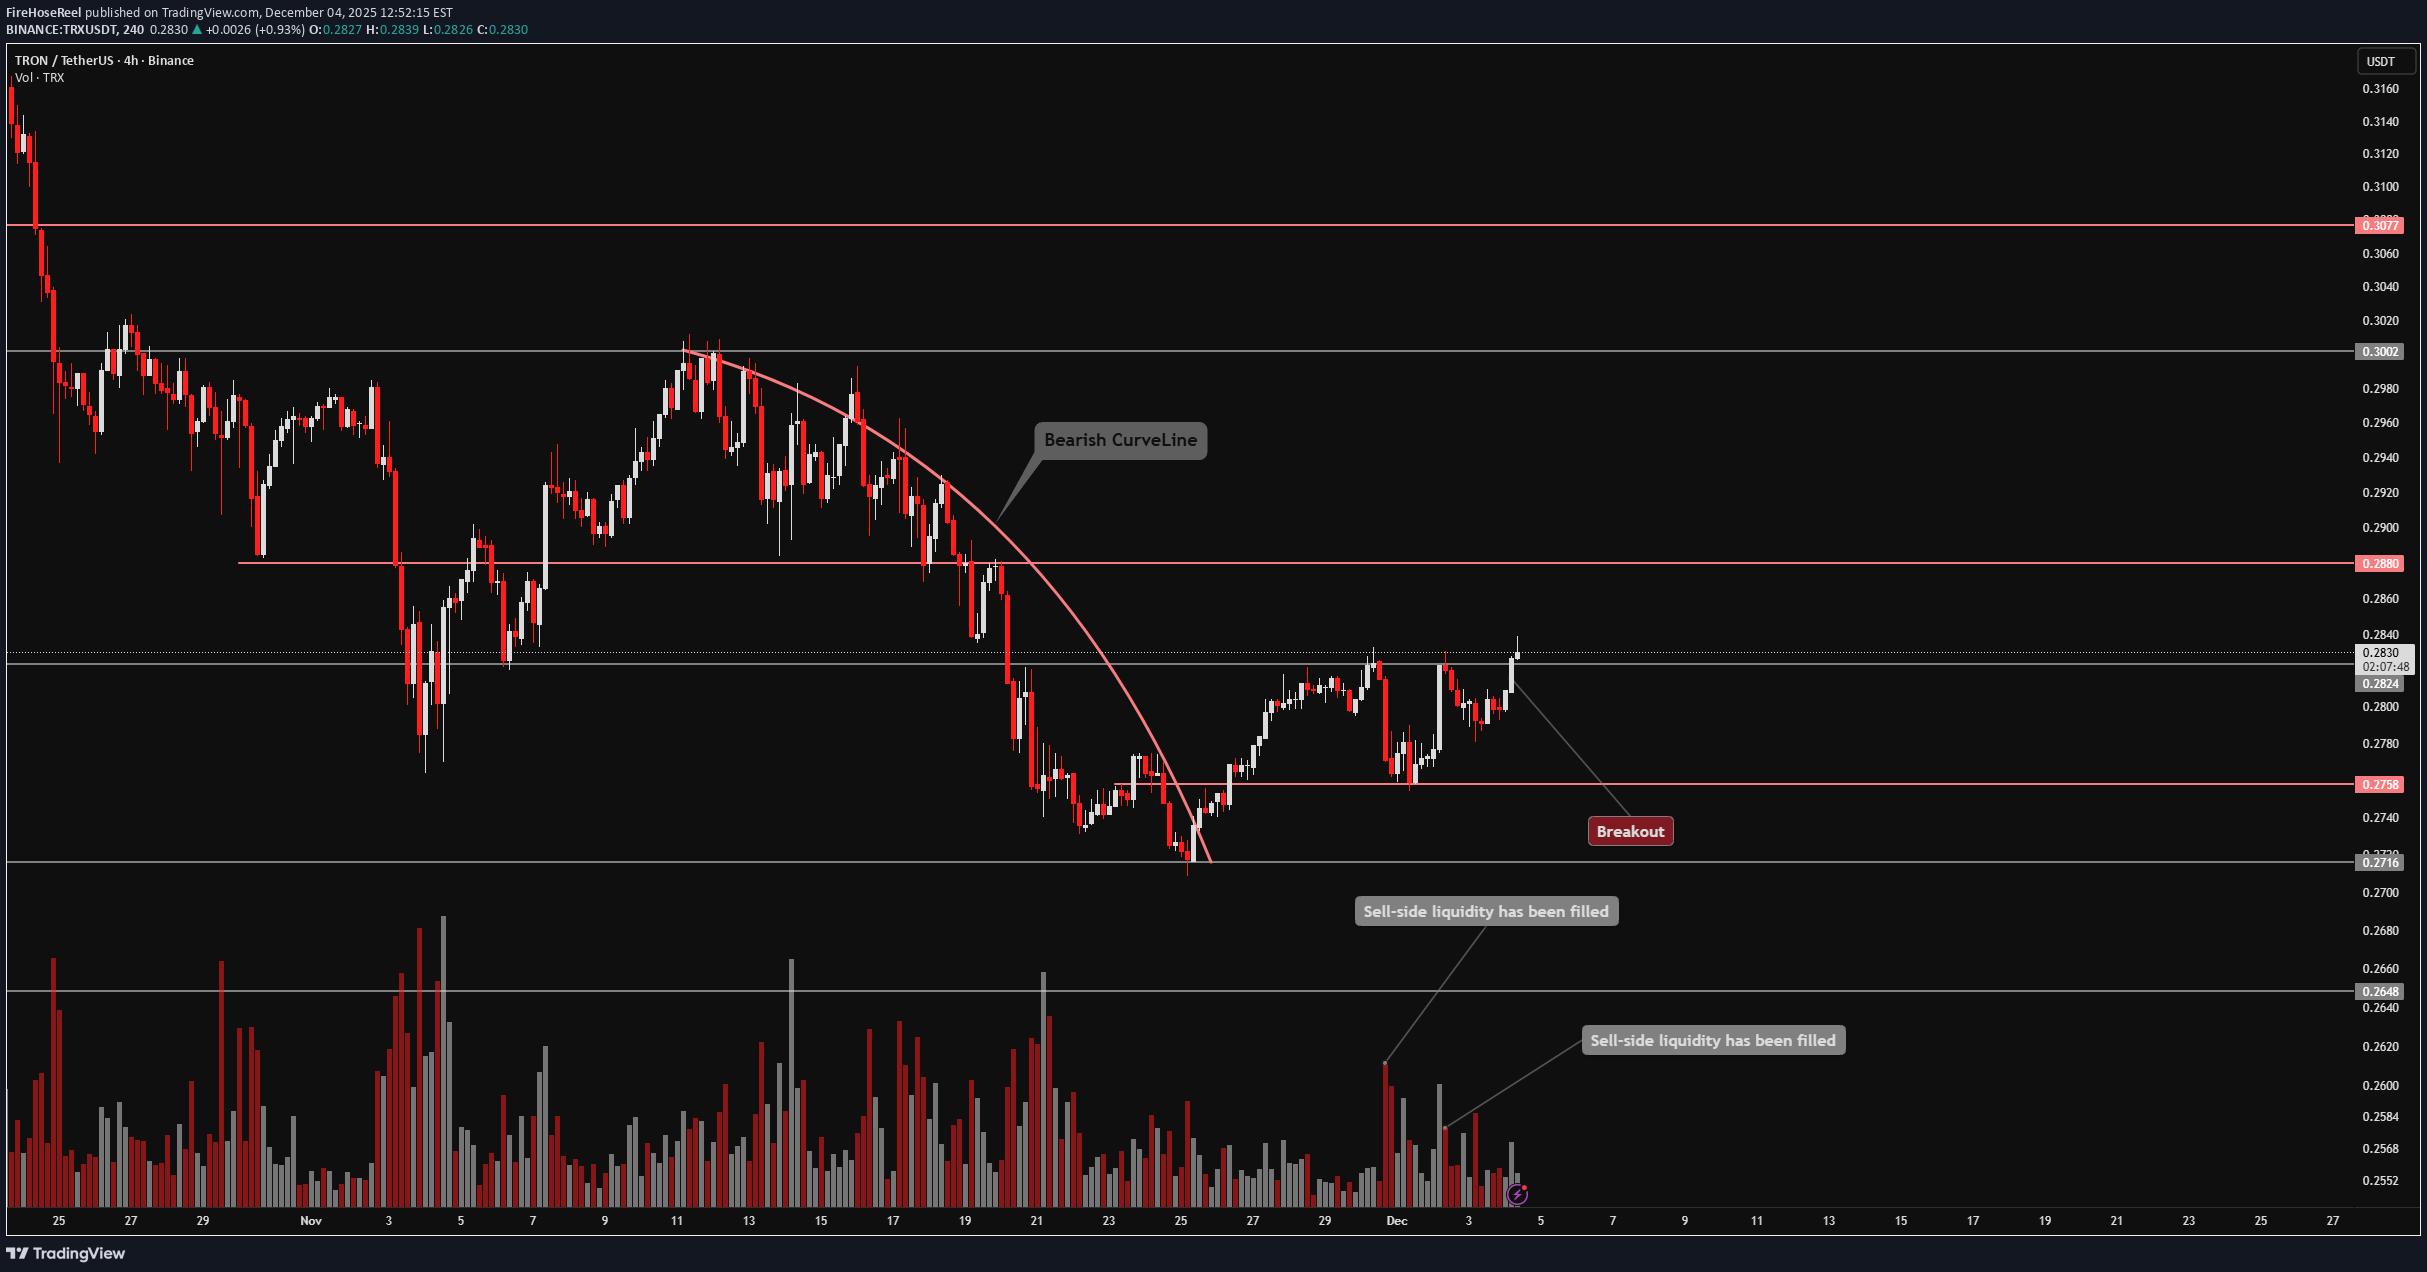
🔥 به FireHoseReel خوش آمدید! بیایید مستقیماً به تحلیل ساختار بازار TRX بپردازیم. 👀 TRX – مرور ۴ ساعته TRX با موفقیت مقاومت ۰.۲۸۲۴ دلار را شکسته و اکنون در حال پیشروی به سمت سطوح بالاتر است. طی ۲۴ ساعت گذشته، حجم معاملات TRX ۲۰ درصد کاهش یافته است. 📊 تحلیل حجم حجم را به دقت در نمودار زیر نظر بگیرید. هر بار که قیمت قبلاً به ۰.۲۸۲۴ دلار میرسید، با فشار فروش قوی مواجه میشد و سفارشات فروش به شدت پر میشدند. در سومین و آخرین آزمایش، سفارشات فروش کمتری وجود داشت و با اندکی افزایش حجم، این مقاومت سرانجام شکسته شد. ✍️ سناریوهای معاملاتی TRX در زیر سناریوهای فعالی آمده است که میتوانید در کنار استراتژی معاملاتی خود از آنها استفاده کنید: 🟢 سناریوی خرید (لانگ) از آنجایی که TRX این مقاومت را شکسته است، میتوانید وارد یک موقعیت لانگ شوید و حد ضرر خود را زیر کف (Low) فعلی قرار دهید. یا به عنوان یک گزینه جایگزین، منتظر تثبیت بهتر در بالای این سطح باشید و برای یک ستاپ مطمئنتر، روی پولبک وارد شوید. 🔴 سناریوی فروش (شورت) شکست زیر حمایت ۰.۲۷۹۱ دلار، همراه با فشار فروش قوی، میتواند منجر به کاهش عمیقتری شود و یک ستاپ شورت (فروش) معتبر ارائه میدهد. 🧠 ابتدا از سرمایه خود محافظت کنید. هیچ ستاپی ارزش از دست دادن کل حساب شما را ندارد. اگر ریسک کنترل نشود، سود بیمعناست. با قوانین معامله کنید، نه با احساسات.

SwallowAcademy
شکست روند مهم ترون (TRX): پایان حمایتها و فرصت فروش؟
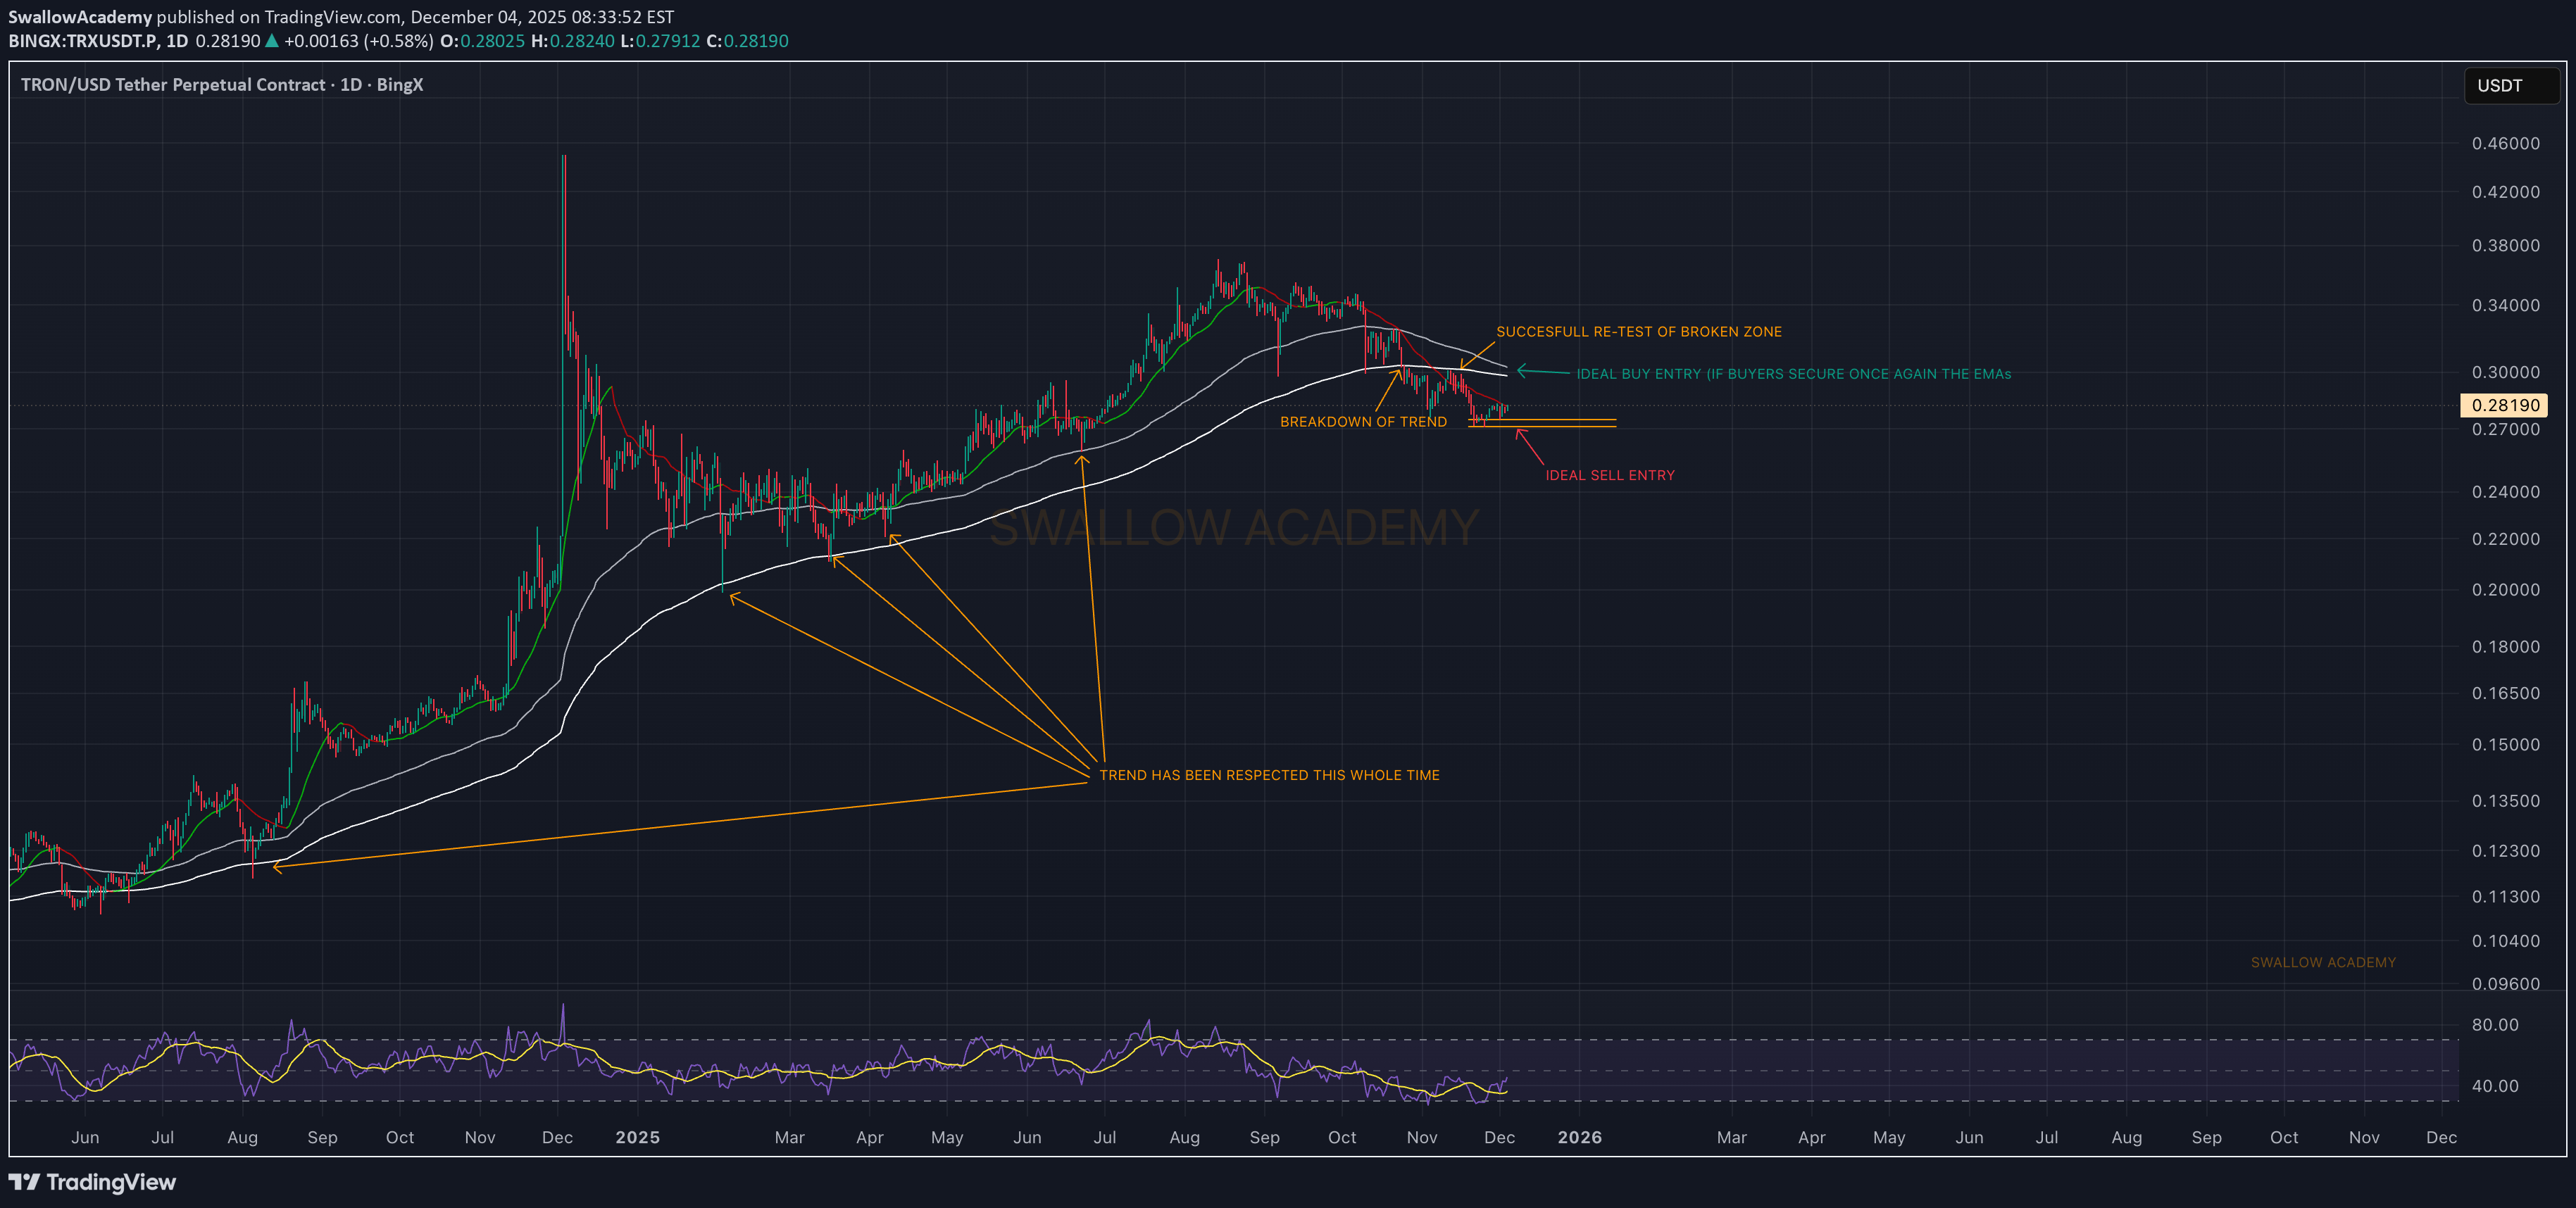
مدتهاست که [قیمت/دارایی] به روند خود پایبند بوده است، اما بالاخره شاهد یک شکست (Breakdown) واضح در آن ساختار بودیم. خریداران تلاش کردند ناحیه را دوباره به دست آورند، اما واکنش آنها تا این لحظه متقاعدکننده نیست. در حال حاضر، نمودار جانب فروش (Sell Side) را میگیرد – مگر اینکه خریداران موفق شوند میانگینهای متحرک نمایی (EMAs) را بازپس بگیرند و به بالای ناحیه شکسته شده برگردند. در غیر این صورت، آرایش (Setup) ایدهآل، همچنان حفظ موقعیت فروش (Short) از سطوح کنونی است. اگر بازآزمایی (Retest) دوباره شکست بخورد، ادامه حرکت نزولی محتملترین سناریو بود. ما به برنامه پایبند بود و منتظر ماند تا این آرایش به طور کامل اجرایی شود. آکادمی پرستو
لحظه سرنوشتساز ترون (TRX): آیا به زودی شاهد انفجار قیمتی خواهیم بود؟
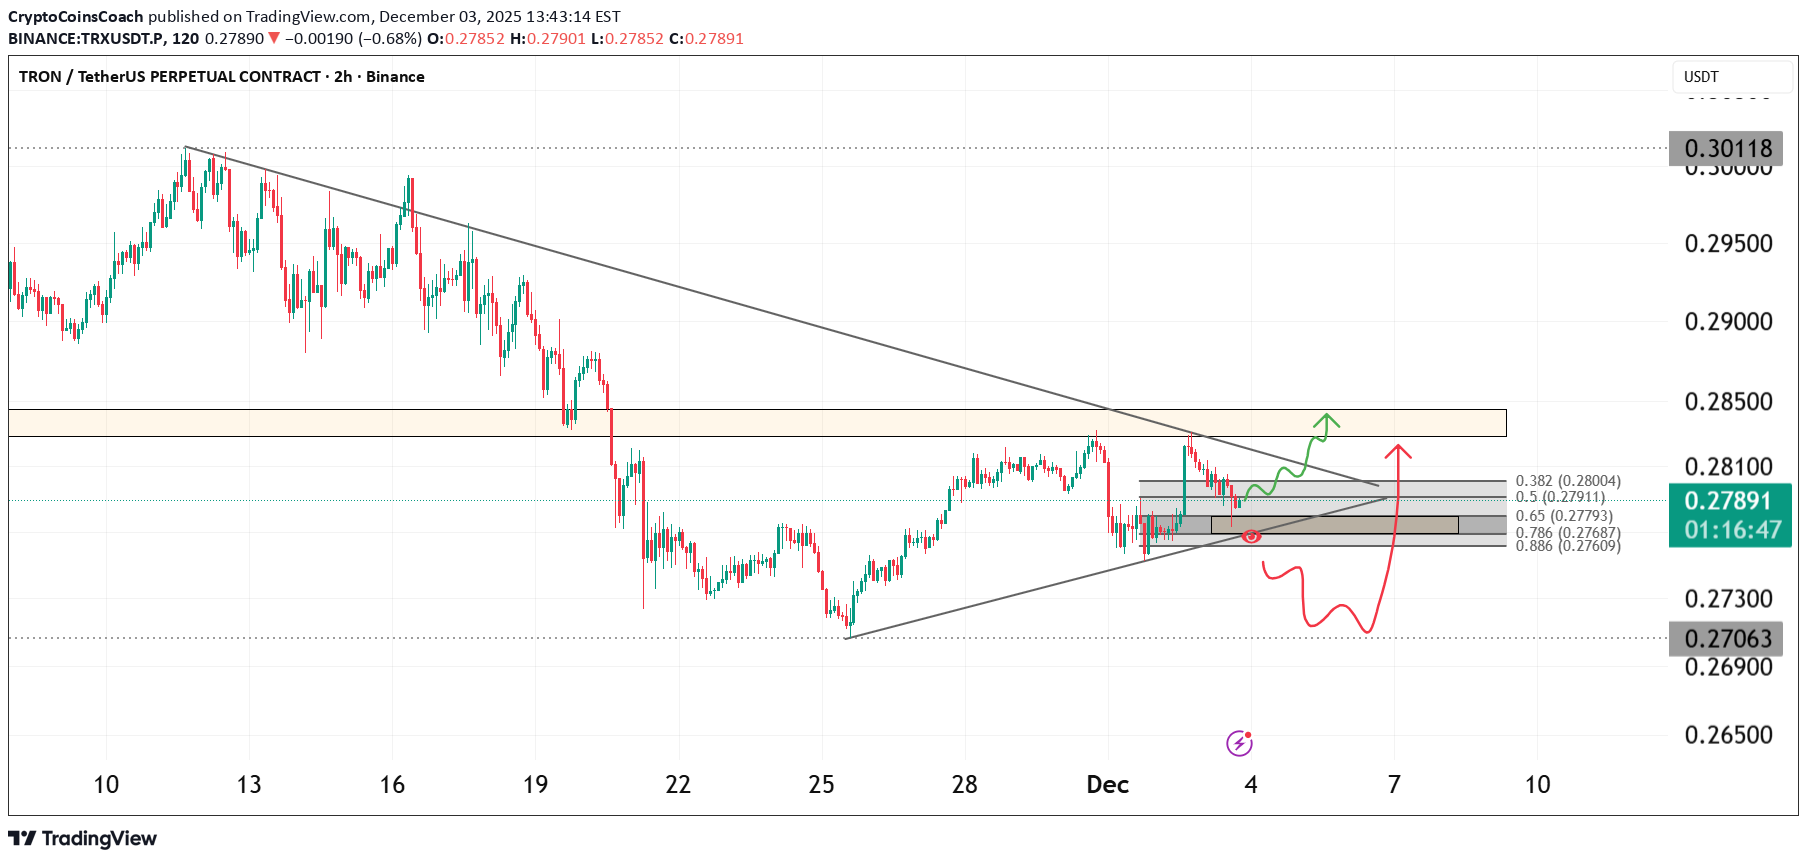
TRX نزدیک شدن به یک نقطه تصمیم گیری بحرانی در داخل یک ساختار فشرده سازی است که در آن قیمت بین مقاومت مورب و یک خط حمایت در حال افزایش نگه داشته می شود. بازار در حالی که مکرراً همان مقاومت را آزمایش میکند، یک سری تمیز از سطوح پایینتر را چاپ کرده است که نشاندهنده افزایش فشار زیر قیمت است. واکنش فعلی در داخل منطقه فیب خاکستری نشان میدهد که خریداران فعال هستند، و تا زمانی که این پشتیبانی برقرار باشد، TRX میتواند فشار دیگری را به منطقه عرضه که در بالا مشخص شده است، انجام دهد. رفتار داخل این منطقه تعیین می کند که آیا قیمت به سمت بالا ادامه می یابد یا برای عقب نشینی عمیق تر رد می شود. منطقه حدود 0.282 تا 0.286 منطقه شکست مهمی است که باید تماشا کرد. اگر قیمت آن را پس بگیرد، شتاب می تواند به سرعت به سمت بالا به سمت جیب های نقدینگی بعدی تغییر کند. نکات کلیدی • قیمت در حال فشرده شدن به راس بین پشتیبانی و مقاومت مورب است • منطقه فیب اصلاحی به عنوان پشتیبانی روزانه برگزار می شود • نقدینگی بالاتر از منطقه عرضه 0.282 تا 0.286 قرار دارد • پایین ترین سطح نشان دهنده رفتار انباشتگی است سناریوی صعودی اگر TRX به نگه داشتن ساپورت فیب ادامه دهد و بالای 0.282 بشکند، ساختار فضایی را برای move به سمت منطقه عرضه بالایی با پتانسیل پیگیری باز می کند. سناریوی نزولی ناتوانی در حفظ منطقه حمایت خاکستری می تواند قیمت را به عقب براند تا خط روند پایین تر در حدود 0.270 دوباره آزمایش شود. باطل شدن شکست تمیز و ادامه در زیر 0.270 تنظیم صعودی را باطل می کند و هرگونه شکست احتمالی را به تاخیر می اندازد. توضیح ساده TRX در یک نقطه تصمیم گیری فشرده می شود. نگه داشتن پشتیبانی به آن فضایی برای شکستن می دهد. از دست دادن پشتیبانی آن را به خط روند پایین باز می گرداند. مراقب باشید که قیمت در حدود 0.282 چگونه رفتار می کند زیرا این سطح همه چیز را تعیین می کند.
ترون (TRX) در آستانه انفجار صعودی بزرگ؛ آیا این حمایت کلیدی، مسیر پرش را هموار میکند؟
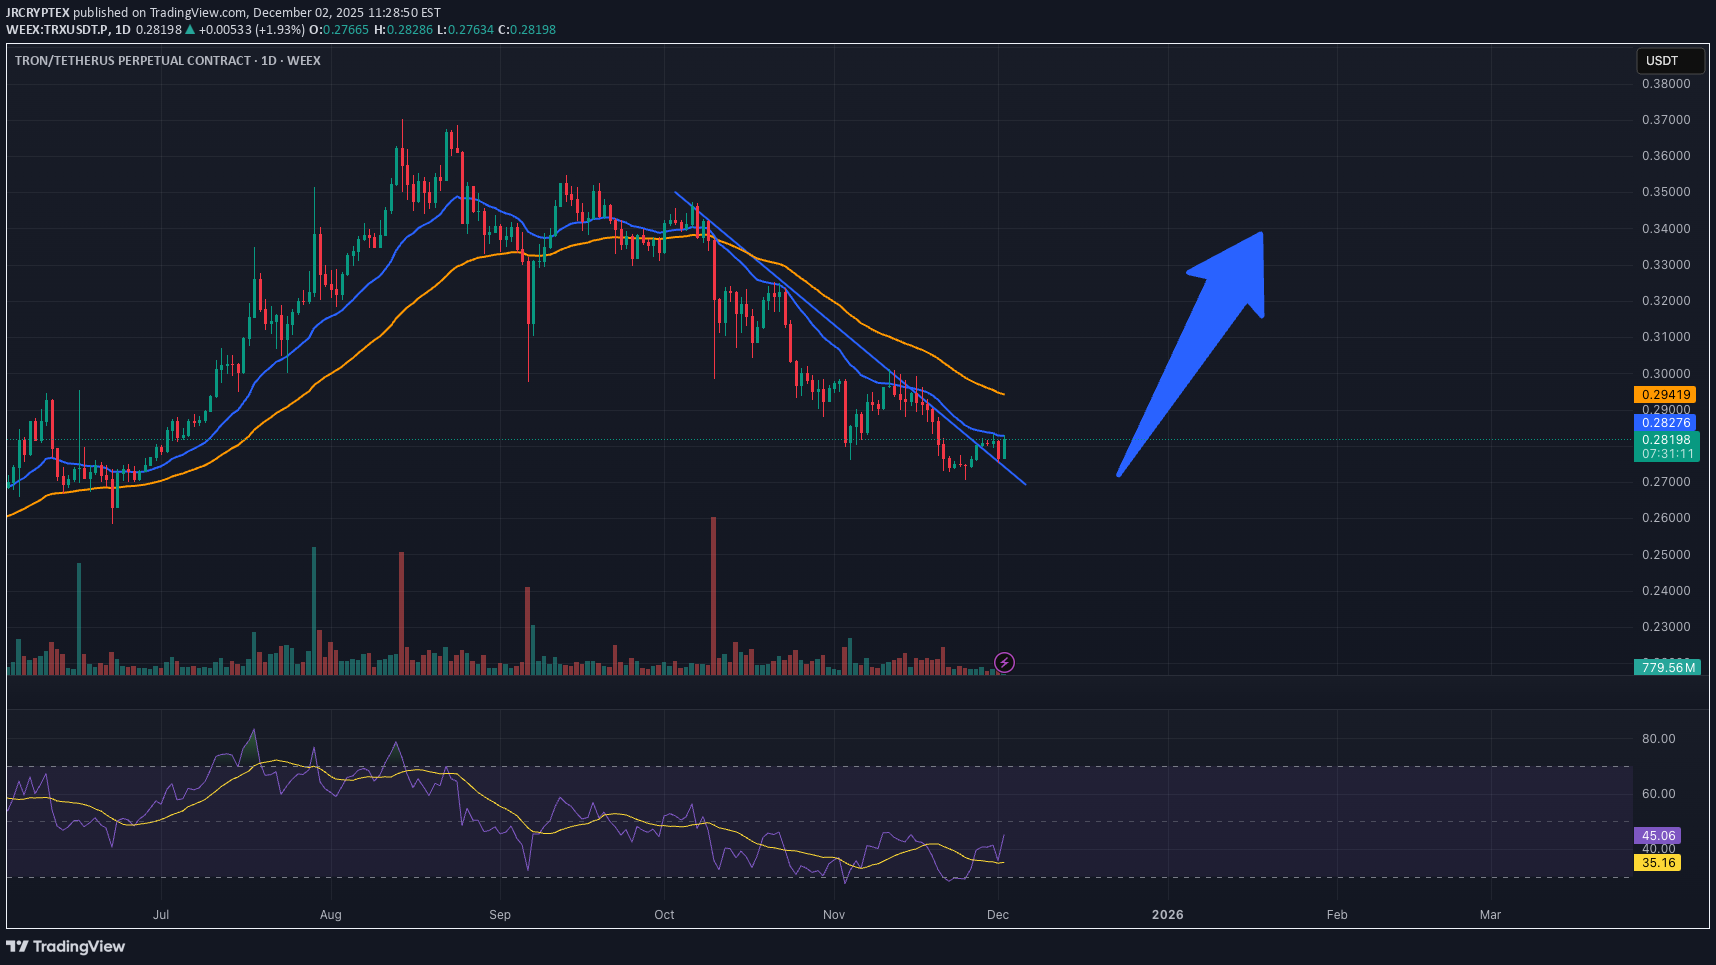
انتظار دارم که Tron به زودی یک شکست قیمتی رو به بالا (صعودی) داشته باشد. در حال حاضر، این دارایی در یک سطح حمایت حیاتی قرار دارد و در آستانه شکستن روند نزولی است. اگر بتوانیم بالاتر از EMAها تثبیت شویم، جهش صعودی بزرگی را پیشبینی میکنم.
سلب مسئولیت
هر محتوا و مطالب مندرج در سایت و کانالهای رسمی ارتباطی سهمتو، جمعبندی نظرات و تحلیلهای شخصی و غیر تعهد آور بوده و هیچگونه توصیهای مبنی بر خرید، فروش، ورود و یا خروج از بازارهای مالی نمی باشد. همچنین کلیه اخبار و تحلیلهای مندرج در سایت و کانالها، صرفا بازنشر اطلاعات از منابع رسمی و غیر رسمی داخلی و خارجی است و بدیهی است استفاده کنندگان محتوای مذکور، مسئول پیگیری و حصول اطمینان از اصالت و درستی مطالب هستند. از این رو ضمن سلب مسئولیت اعلام میدارد مسئولیت هرنوع تصمیم گیری و اقدام و سود و زیان احتمالی در بازار سرمایه و ارز دیجیتال، با شخص معامله گر است.